

Introduction
With the acceleration of global industrialization and urbanization, regional ecological security issues have increasingly become the core contradiction restricting sustainable development. The severity of this problem triggered academic attention as early as the 1970s, when the renowned American environmental expert Lester R. Brown [1] proposed the concept of ecological security and incorporated it into the framework of national security, revealing the systemic impact of ecological degradation on national sovereignty through the collapse of food production and disruption of resource supply chains. In 1989, the International Institute for Applied Systems Analysis (IIASA) further defined ecological security from the perspective of holistic human societal security, emphasizing that ecological security represents a sustainable survival state in which human health, fundamental rights, resource security, social order, and environmental adaptability remain unthreatened. Its essence lies in a composite system comprising natural, economic, and social-ecological security, maintaining long-term societal stability through ecosystem integrity, equitable resource allocation, and social resilience.
As a critical tool for measuring the coordination between humans and nature, ecological security assessment is of significant importance in identifying ecosystem vulnerabilities and constructing safe development paradigms. With the refinement of theoretical systems, ecological security evaluation research has progressively broken through the limitations of single-element assessments, forming a multidimensional and multiscale evaluation framework. In terms of research subjects, it encompasses key areas such as water resources [2], land resources [3], grasslands [4], and tourism [5, 6]. Spatially, it extends across [7, 8], provincial [9], municipal [10], county-level [11], urban agglomeration [12], watershed [13], and nature reserve [14] scales. This hierarchical research network provides comprehensive data foundations and methodological support for in-depth regional ecological security coupling mechanisms analysis.
Academia has developed a diversified methodological framework tailored to various scenarios to address the multiscale and multidimensional demands of ecological security assessment. Prevailing approaches include ecological footprint analysis [13], the Pressure-State-Response (PSR) model [15, 16], machine learning algorithms [17], and system dynamics modeling [18]. The classical PSR model establishes a causal chain linking “human activities-environmental changes-regulatory measures” to interpret human-environment interactions. However, its limited capacity to characterize nonlinear feedback mechanisms prompted scholarly enhancements by integrating Drivers and Impacts dimensions, evolving into the DPSIR (Drivers-Pressures-State-Impacts-Responses) framework. This advancement enables systematic tracing of root causes underlying ecological security challenges [19]. By leveraging their robust nonlinear fitting capabilities and proficiency in processing high-dimensional data, machine learning paradigms have opened novel pathways for ecological security evaluation. Zou et al. [20] pioneered an integrated Random Forest-Multilayer Perceptron (RF-MLP) model that achieves high-precision spatiotemporal predictions of cultivated land ecological security levels. Li et al. [21] synthesized graph theory, matrix analysis, and BP neural networks to develop a BP-DEMATEL model, effectively deciphering indicator correlations within the Pearl River Delta’s ecological security configuration. System dynamics modeling, recognized for its operational simplicity and adaptive strength, excels in unraveling complex interconnected relationships across extended temporal scales [22]. Illustratively, Wang et al. [18] employed system dynamics simulations to project future ecological security scenarios.
Despite methodological proliferation, ecological footprint analysis maintains an irreplaceable status in regional ecological security assessments. The ecological footprint method was introduced in the 1990s by William Rees, a professor of planning and ecological resource studies at the University of British Columbia in Canada, and his student Wackernagel [23, 24]. This innovative concept broke through the limitations of traditional resource assessment and provided a new perspective for measuring the sustainable use of resources. It measures the level of sustainable resource use by accounting for the total area of biologically productive land required to sustain the consumption of natural resources and the absorption of waste for human activities in the region [25]. As a widely used and effective quantification tool, the ecological footprint model has several advantages compared to other methods, such as standardized concepts, simplicity, and ease of comparison between regions [26]. It can intuitively present a region’s ecological surplus or deficit status by comparing human demand for natural resources with the actual supply capacity of ecosystems.
As a critical economically developed city along China’s southeast coast, Quanzhou City has witnessed growing ecological security challenges during its prolonged rapid development. While industrial expansion and urban construction persistently encroach on limited land resources, intensive development has degraded ecosystem services and accelerated resource depletion, severely threatening ecological security. In light of this, the study focuses on the districts and counties of Quanzhou, introducing the theory and methodology of the ecological footprint. It aims to conduct an in-depth analysis of Quanzhou’s ecological security status from 2018 to 2022. It is expected to provide scientific reference for scientific planning, rational allocation, and sustainable utilization of land resources in Quanzhou City and to support the coordinated development of the city’s economy, society, and ecology.
Material and Methods
Study Area
Quanzhou City is located in the southeast of Fujian Province, between 24°22’-25°56’ north latitude and 117°34’-119°05’ east longitude. It borders Fuzhou to the north, Xiamen to the south, Taiwan Island to the east, Zhangzhou and Longyan to the west, and guards the west coast of the Taiwan Strait. The terrain of Quanzhou is higher in the northwest and lower in the southeast, distributed in a stepped pattern. The northwest is the main part of the Dayun Mountains, and the middle is the low hilly area, with relatively gentle terrain ups and downs. The southeast is a coastal plain characterized by flat and open terrain (Fig. 1). Affected by the subtropical oceanic monsoon climate, it is warm and humid all year round, with sufficient light and abundant rainfall. Regarding land use types, the most significant area is covered by forest land, which spans 6773.31 km², accounting for approximately 60% of the total land area. The next is arable land, with an average area of 1922.62 km², representing 17.3% of the total area. It is mainly concentrated in the southeast coastal plain and some river valleys, ensuring the city’s food supply. However, in recent years, rapid urbanization has led to the continuous expansion of urban construction areas, with large amounts of arable and forest land converted into construction land. This has resulted in a continuous decrease in the area of arable and forest land, while construction land has increased. The change in land use structure severely challenges the sustainable use of land resources, so it is of great significance to study the ecological security of the area. Due to the data availability, Jinmen County was not included in the study.
Data Sources
The resident population data, commodity consumption in the biological account, and commodity consumption in the energy account of Quanzhou City used in this paper are derived from the Quanzhou Statistical Yearbook, statistical yearbook, and statistical Bulletin of each county and district from 2019 to 2023. Considering the availability of data and China’s national conditions, where the self-sufficiency rate of staple grains (rice, wheat, and corn) was about 98% in 2016 and remained above 95% until 2022. So the crop production of Quanzhou City replaces the commodity consumption in the biological account, and the industrial production replaces the commodity consumption in the energy account. Some missing data of individual years are replaced by data from adjacent years. For example, the production of edible fungi in Shishi City in 2018 and 2019 refers to the data of 2020, the production of edible fungi in Yongchun County and Dehua County in 2018 refer to the data of 2019, and the production of edible fungi in Shishi City and Dehua County in 2022 refers to the data of 2021. The global average productivity data are sourced from the Food and Agriculture Organization (FAO) statistical database. The equilibrium factor data are based on the global average yields of biological resources calculated by the FAO in 1993. The yield factor data refer to the values calculated for China by Wackernagel [27]. The values of commodity types and corresponding equilibrium factors and production factors in the consumption account are shown in Table 1, and the relevant parameters of commodities in the consumption account are shown in Table 2.
Methods
Ecological Footprint
The ecological footprint refers to the area of biologically productive land required to sustain the consumption of resources and absorption of waste by a specific population or region under certain technological and environmental conditions. It quantitatively reflects the extent of human impact on the ecological environment [25]. Among them, the per capita ecological footprint of the biological account focuses on the occupation of ecological resources by individuals, and the calculation formula is as follows:
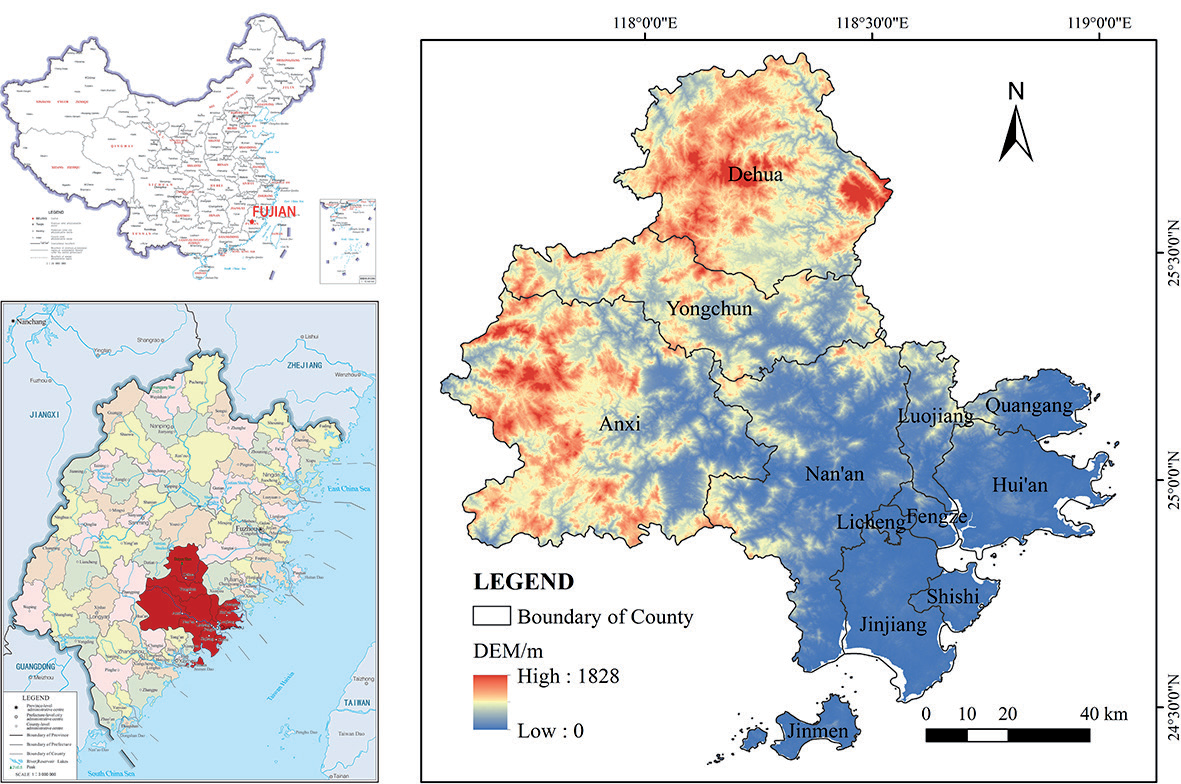
Table 1.
Ecological footprint consumption account of land resources and its equilibrium factors and yield factors.
Table 2.
The relevant parameters of commodities in the consumption account.
[i] Note: The global average production capacity unit for Timber* is m3/hm2 and the per capita consumption unit is m3/person. The density of natural gas is 0.5kg/m3, the unit of per capita consumption of natural gas* is m3/person. The unit of electricity* conversion coefficient is GJ/kWh, and the unit of per capita consumption is kWh/person.
In the formula, efi represents the per capita ecological footprint of land resources in the biological account (hm2/person), ai represents the per capita area of biologically productive land occupied by the consumption of the i-th category of commodity (hm2/ person), ri represents the equilibrium factor for the land use type corresponding to the i-th category of commodity, ci represents the per capita consumption of the i-th category of commodity (kg/person), and pi represents the global average productivity for the i-th category of commodities (kg/hm2).
The per capita ecological footprint of the energy account focuses on the ecological occupation corresponding to individual energy consumption, further refining the measurement of the ecological footprint from the energy perspective. The calculation formula is as follows:
In the formula, efi represents the per capita ecological footprint of the energy account (hm2/person), ci represents the per capita consumption of the i-th category of commodity (kg/person), xi represents the conversion factor for the i-th category of commodity (GJ/t), and fi represents the global average energy footprint for the i-th category of commodity (GJ/hm2).
Ecological Carrying Capacity
Ecological carrying capacity refers to the extent of human activity intensity and the resources and services that ecosystems can support within a certain period and area, while maintaining their relative stability [28]. It is a comprehensive indicator of the ecological demand of human activities on land resources in that area. The calculation formula is as follows:
In the formula, ecj represents the per capita ecological carrying capacity of land resources (hm2/person), aj represents the per capita area of productive land of the j-th type of land use (hm2/person), rj represents the equilibrium factor for the j-th type of land use, and yj represents the yield factor for the j-th type of land use, k represents the quantity of commodity contained in the j-th type of land use.
Ecological Security Assessment
This study uses the ecological surplus/deficit and ecological pressure to jointly reflect the ecological security situation. Ecological surplus/deficit refers to the difference between ecological carrying capacity and ecological footprint [28]. The calculation formula is as follows:
In the formula, ED represents the ecological surplus or deficit status of land resources, EC represents the ecological carrying capacity of regional land resources, and EF represents the ecological footprint of regional land resources. ED = 0 indicates that the land resources are in a state of ecological balance; ED>0 indicates a state of ecological surplus, and ED<0 indicates a state of ecological deficit.
The ecological pressure index is used to assess the interrelationship between resource consumption and the ecosystem’s bearing capacity within a region, obtained by calculating the ratio of ecological footprint to ecological carrying capacity [28]. The calculation formula is as follows:
In the formula, EPI represents the ecological pressure index, EF represents the ecological footprint of regional land resources, and EC represents the ecological carrying capacity of regional land resources.
Results
Temporal and Spatial Change Analysis of Ecological Footprint
Considering the availability of energy consumption data across the various districts and counties of Quanzhou City, this study referred to the approach of He et al. [29] and primarily considered the consumption of commodities in the biotic account when calculating the ecological footprint and carrying capacity for each district and county. When calculating the total ecological footprint and carrying capacity for Quanzhou City, this study mainly referenced the consumption of commodities in both the biotic and energy accounts.
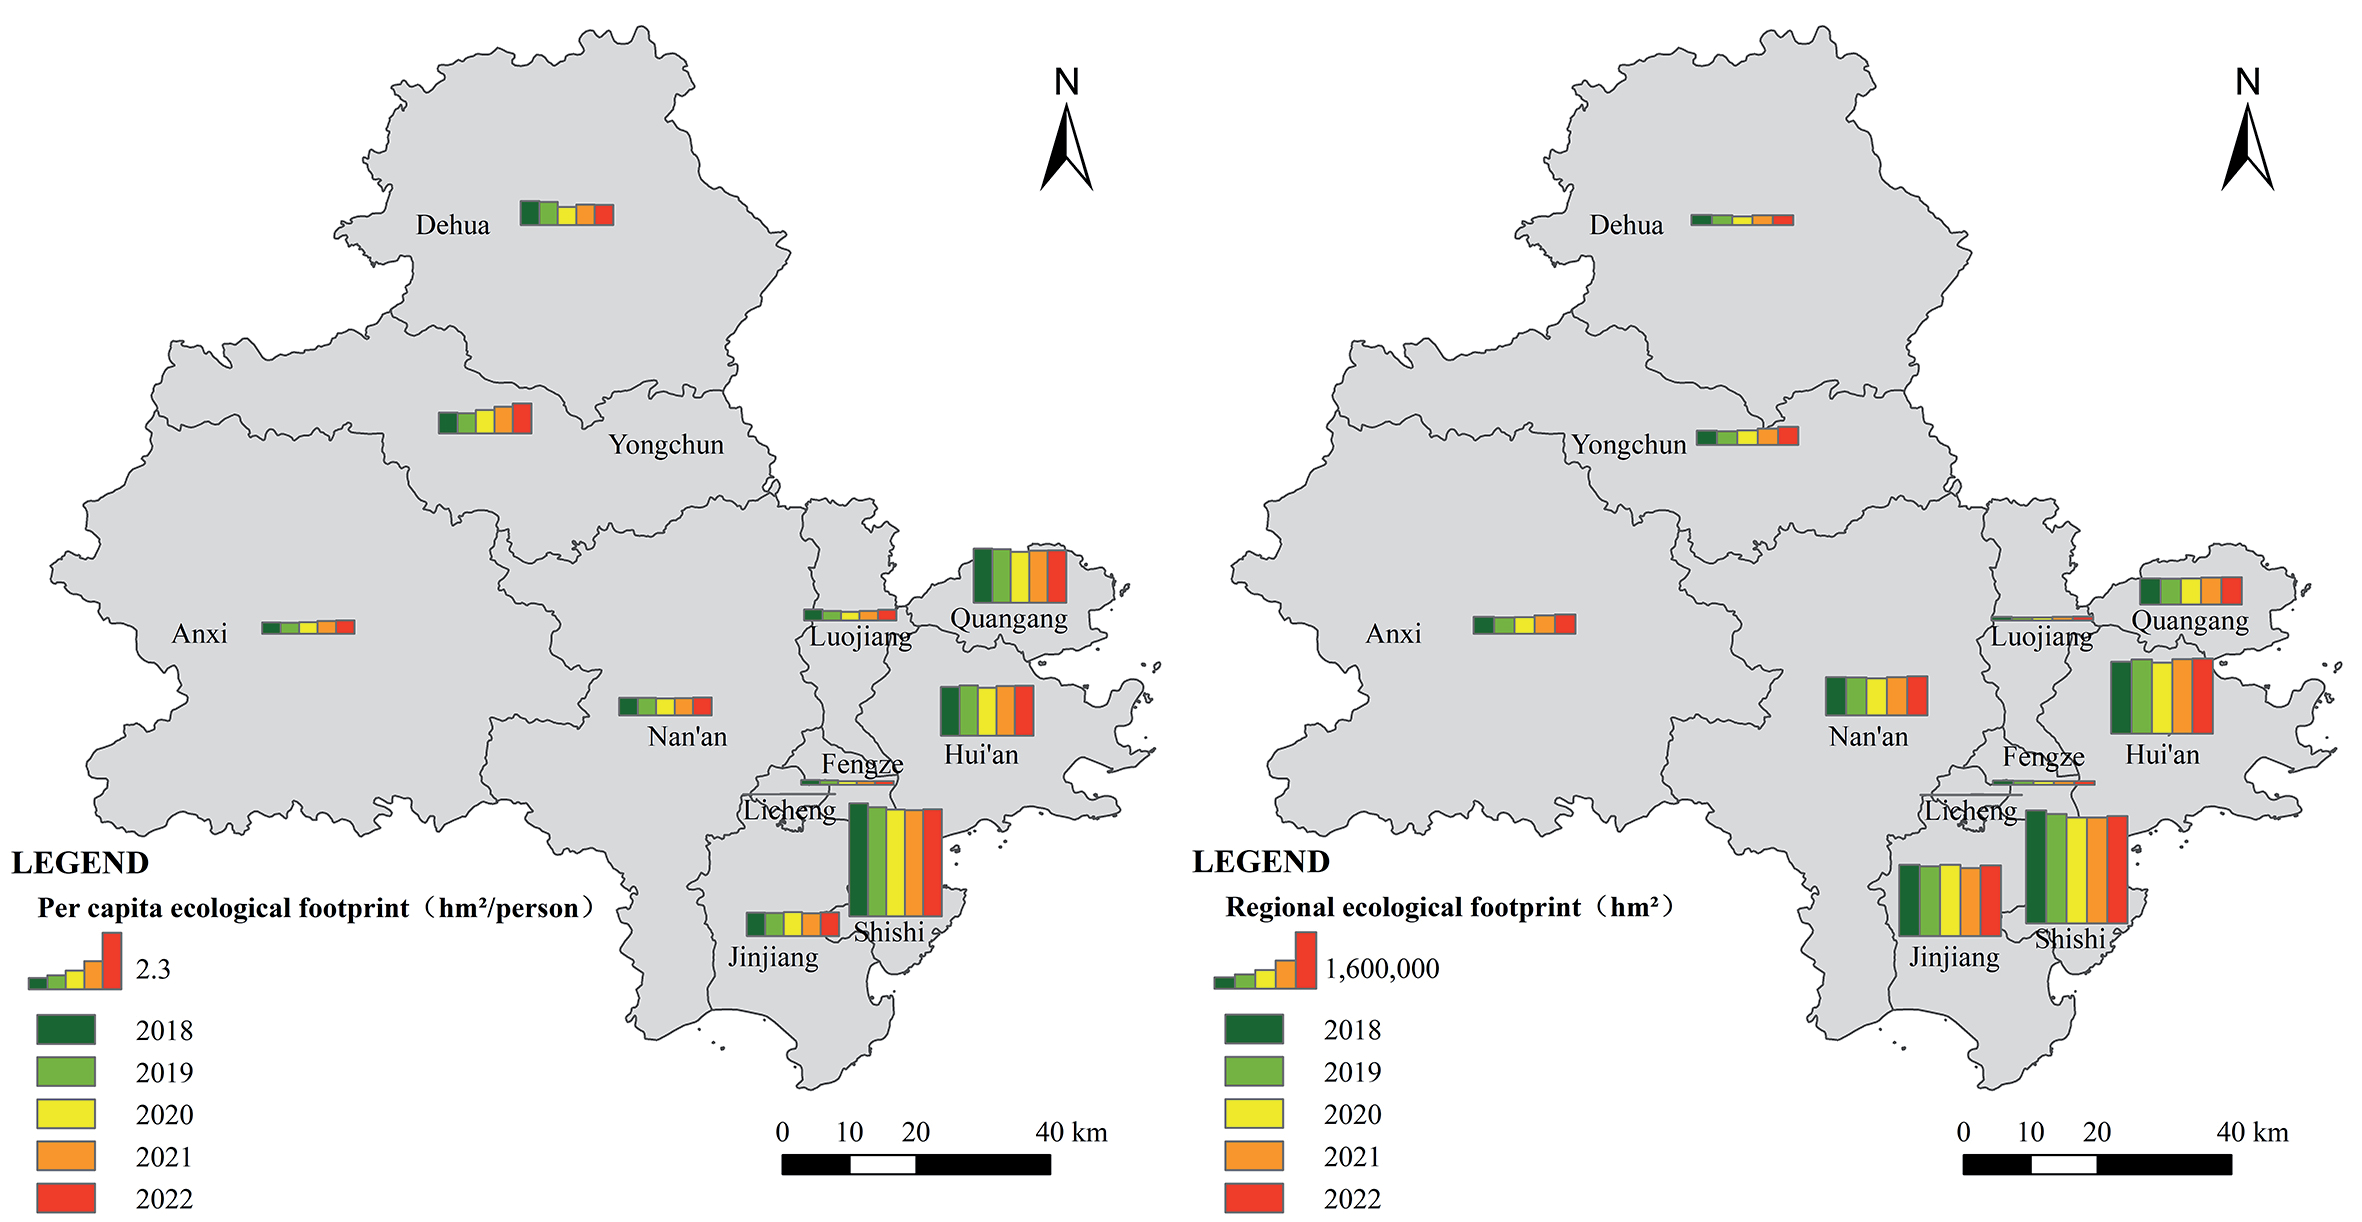
The spatial distribution of per capita and regional ecological footprint across various districts and counties of Quanzhou City from 2018 to 2022 is shown in Fig. 2. The results indicate that per capita and regional ecological footprints were higher in the southeast coastal areas, moderate in the northwest inland areas, and lower in the central areas. At the per capita level, Shishi City had the highest average ecological footprint from 2018 to 2022, reaching 4.45 hm2/person. The temporal series shows a dynamic trend of initial decrease followed by an increase, with the peak in per capita ecological footprint in 2018 at 4.63 hm2/person, which was primarily attributed to the historically highest level of aquatic product consumption that year. By 2021, the per capita ecological footprint dropped to its lowest at 4.36 hm2/person. Quanhai District and Hui’an County had the second-highest average per capita ecological footprint among all districts and counties in Quanzhou City. At the ecological footprint level, Shishi City also ranked first with an average of 3.08×10⁶ hm2 from 2018 to 2022, followed by Hui’an County and Jinjiang City (a county-level city). In comparison, Licheng District had the lowest per capita and regional ecological footprints among all districts and counties, at only 0.01 hm2/person and 3098.05 hm2, respectively.
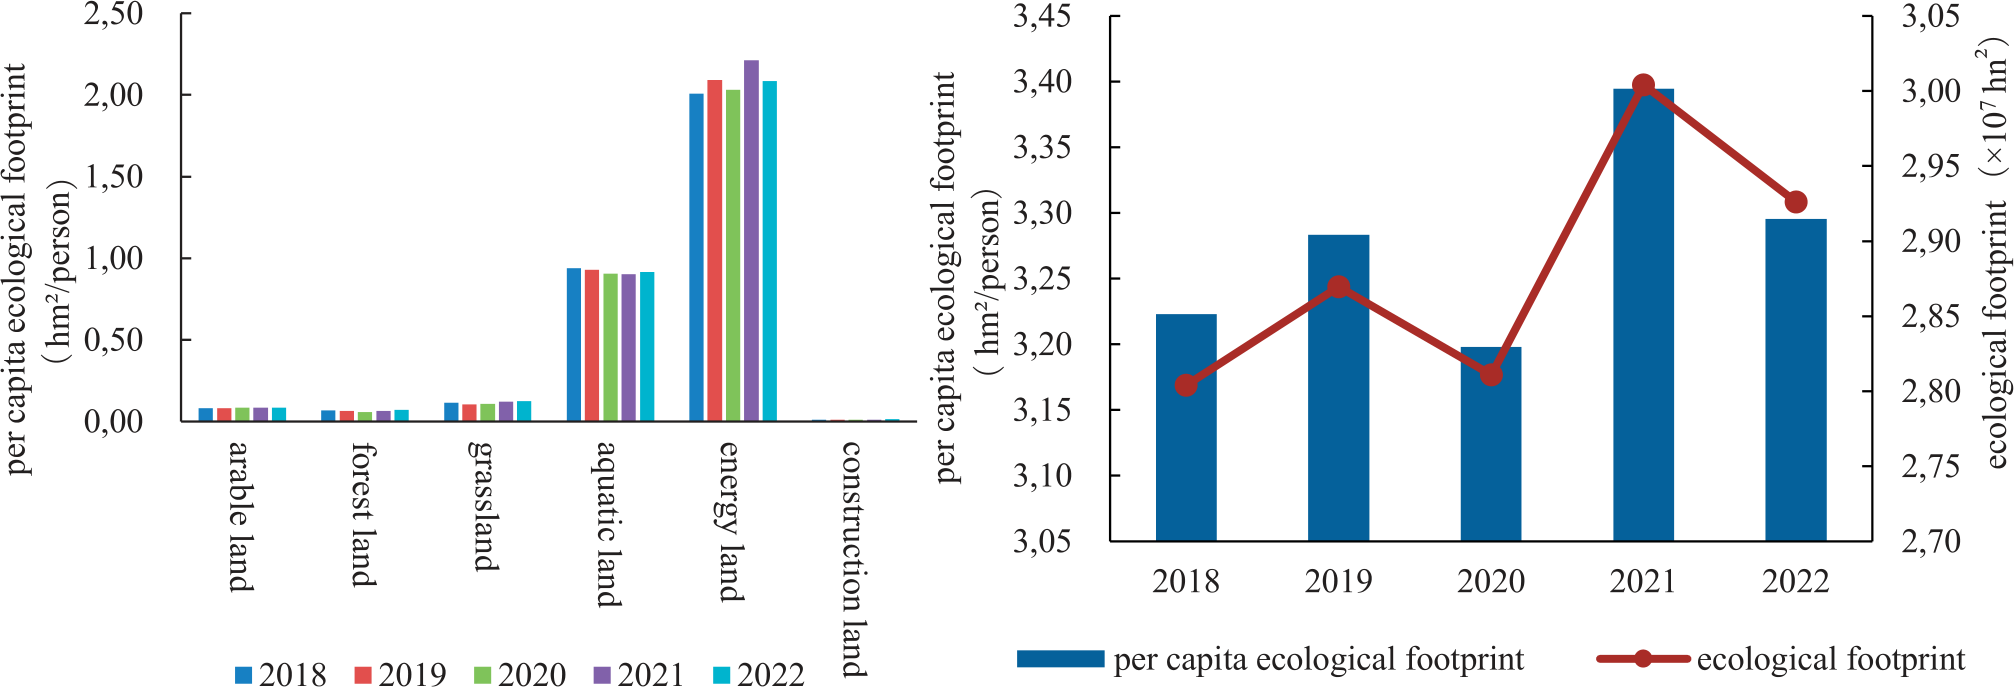
From 2018 to 2022, the changes in ecological footprint for each type of land use in Quanzhou City are shown in Fig. 3. Among all kinds of biologically productive land, the per capita area of energy land was the largest, at 2.09 hm2/person, accounting for 63.59% of the total per capita ecological footprint, followed by aquatic area, which accounted for 28.00%, and the smallest was construction land, at only 0.36%. Among the commodities consumed in the Biological account, the largest average annual per capita area was for aquatic products, at 0.92 hm2/person, which accounted for 77.68% of the total per capita ecological footprint in the Biological account. It was related to Quanzhou City’s coastal geographical location advantage, ensuring an abundant and diverse supply of aquatic products and a higher consumption preference among residents for these products. This was followed by pork, grain, and timber, with dairy having the smallest average annual per capita area. Among the commodities consumed in the energy account, raw coal and crude oil had the highest average annual per capita areas, at 1.18 hm2/person and 0.75 hm2/person, respectively, together accounting for 91.92% of the total per capita ecological footprint in the energy account. This was closely related to the industrial structure of Quanzhou, and industrial sectors such as ceramics, textiles, machinery manufacturing, and other industries were highly dependent on raw coal and crude oil. Kerosene has the smallest average annual per capita area. From 2018 to 2022, the per capita and regional ecological footprint of Quanzhou City showed a fluctuating trend of first increasing, then decreasing, and then increasing and decreasing again. In 2021, the per capita and regional ecological footprint peaked at 3.39 hm2/person and 3.00×10⁷ hm2, respectively, mainly due to an increase in raw coal and crude oil consumption. The smallest per capita ecological footprint and regional ecological footprint occurred in 2020.
Temporal and Spatial Change Analysis of Ecological Carrying Capacity
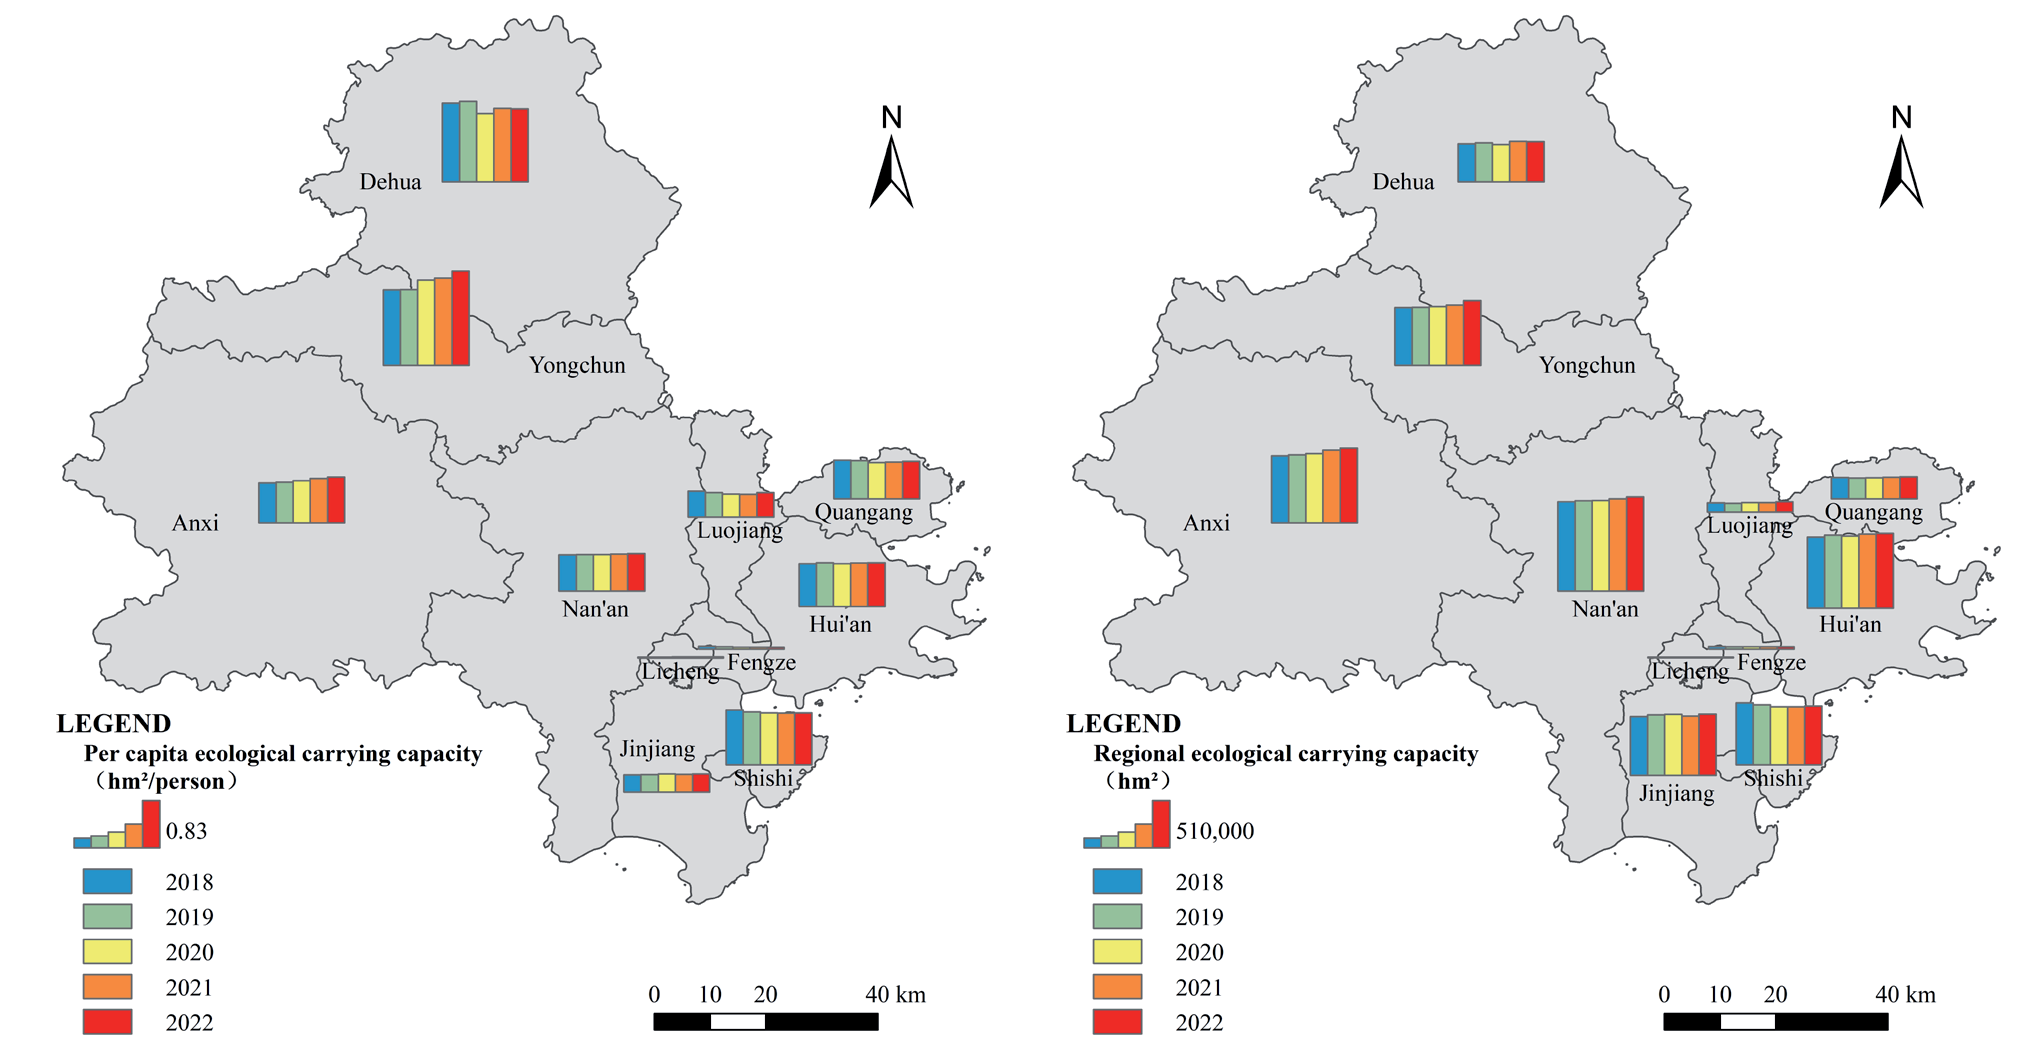
From 2018 to 2022, the spatial distribution of per capita and regional ecological carrying capacity across various districts and counties of Quanzhou City is shown in Fig. 4. The results showed that the per capita ecological carrying capacity exhibited a spatial distribution characteristic of higher in the northwest inland areas, followed by the southeast coastal regions, and lower in the central areas. Among them, Yongchun County had the highest average per capita ecological carrying capacity, reaching 1.46 hm2/person, showing a trend of increasing year by year, with the highest reaching 1.65 hm2/person. A significant increase of 25.00% was achieved in five years, which was mainly attributed to the rise in the consumption of grain and vegetables in the cultivated land resources in the region. Dehua County had the second-highest average per capita ecological carrying capacity at 1.31 hm2/person. Regarding regional ecological carrying capacity, the spatial distribution showed a characteristic of being higher in the central areas and lower around the periphery. Due to its large population, Nan’an City had the highest regional ecological carrying capacity, with an average annual ecological carrying capacity of 9.80×10⁵ hm2, and this showed a trend of increasing year by year. In 2022, it peaked at 1.01×10⁶ hm2, marking an increase of 5.42% over the five years.
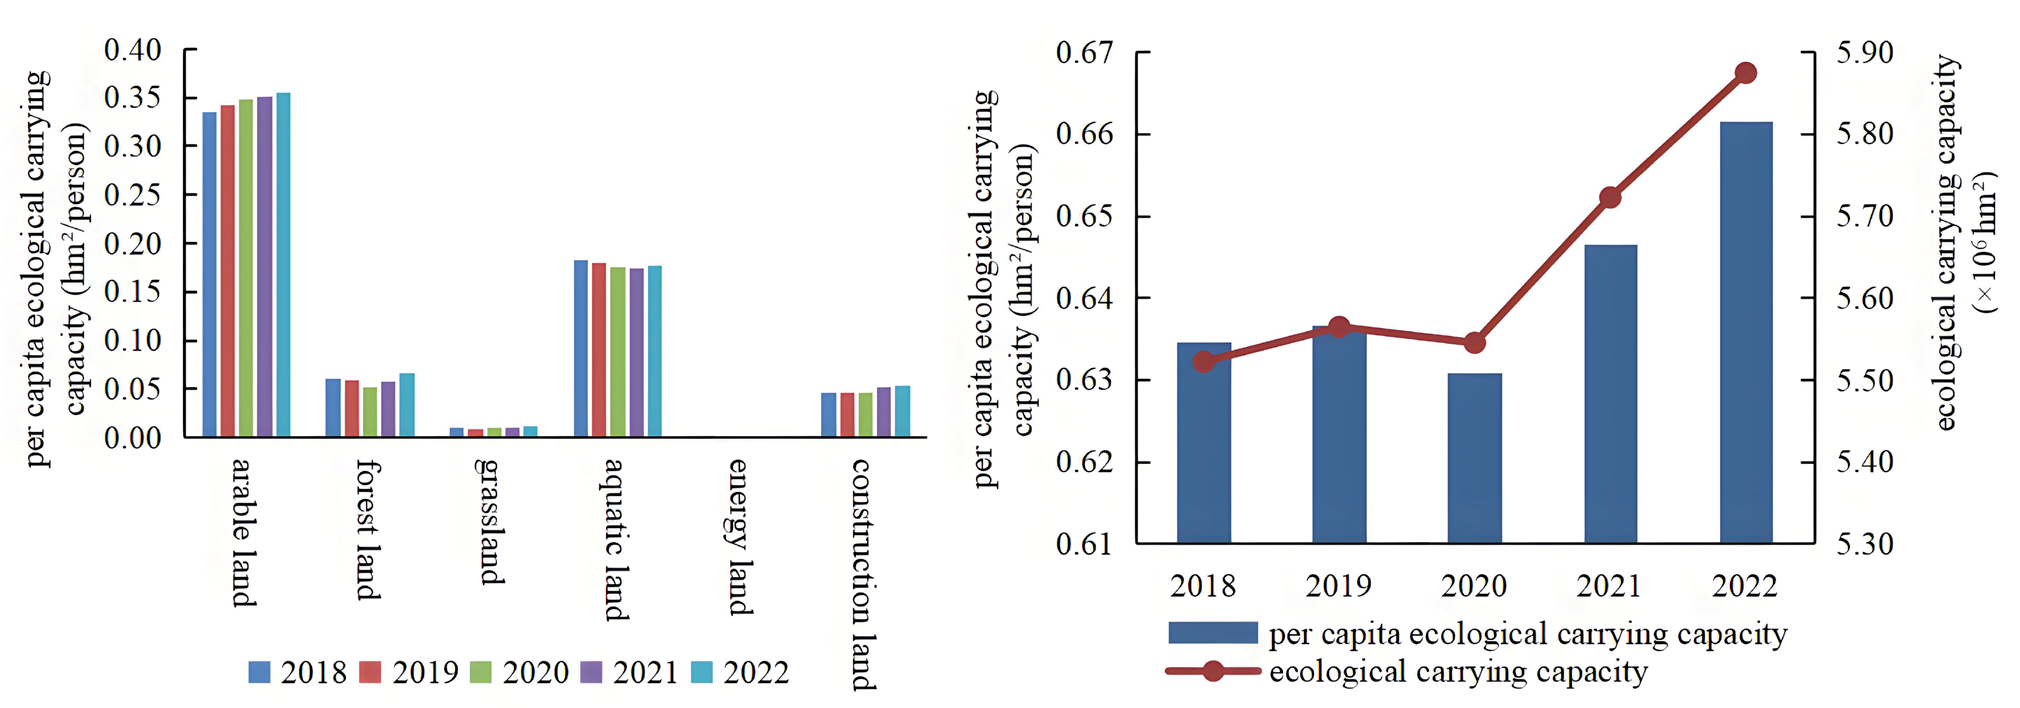
The ecological carrying capacity of various land use types in Quanzhou City from 2018 to 2022 is shown in Fig. 5. The results showed that among the biological accounts, the per capita ecological carrying capacity of arable land is the highest, with an annual average reaching 0.35 hm2/person, and it exhibited a significant year-on-year increasing trend from 2018 to 2022. Aquatic areas’ per capita ecological carrying capacity was the second highest, with an annual average of 0.18 hm2/person. The combined per capita ecological carrying capacity of arable land and aquatic areas accounted for 81.55% of the total per capita ecological carrying capacity. Among them, only the per capita ecological carrying capacity of the aquatic areas showed a downward trend over the five years, with a decrease of 2.73%. In the Energy account, the per capita ecological carrying capacity of energy land was 0. The annual average per capita ecological carrying capacity of construction land was 0.05 hm2/person, accounting for 7.60% of the total per capita ecological carrying capacity. The per capita ecological carrying capacity of construction land showed a downward trend from 2018 to 2020, then turned upward from 2021 to 2022, reaching its peak in 2022 at 0.05 hm2/person, with an increase of 13.90%, which was the highest among all types of biologically productive land. The per capita ecological carrying capacity and regional ecological carrying capacity of Quanzhou City from 2018 to 2022 showed a trend of fluctuation in the early period and steady rise in the later period, reaching their highest values in 2022, at 0.66 hm2/person and 5.87×10⁶ hm2, respectively.
Fig. 3.
Ecological footprint, total per capita ecological footprint, and total ecological footprint of each land use type in Quanzhou from 2018 to 2022.
Temporal and Spatial Change Analysis of Ecological Security State
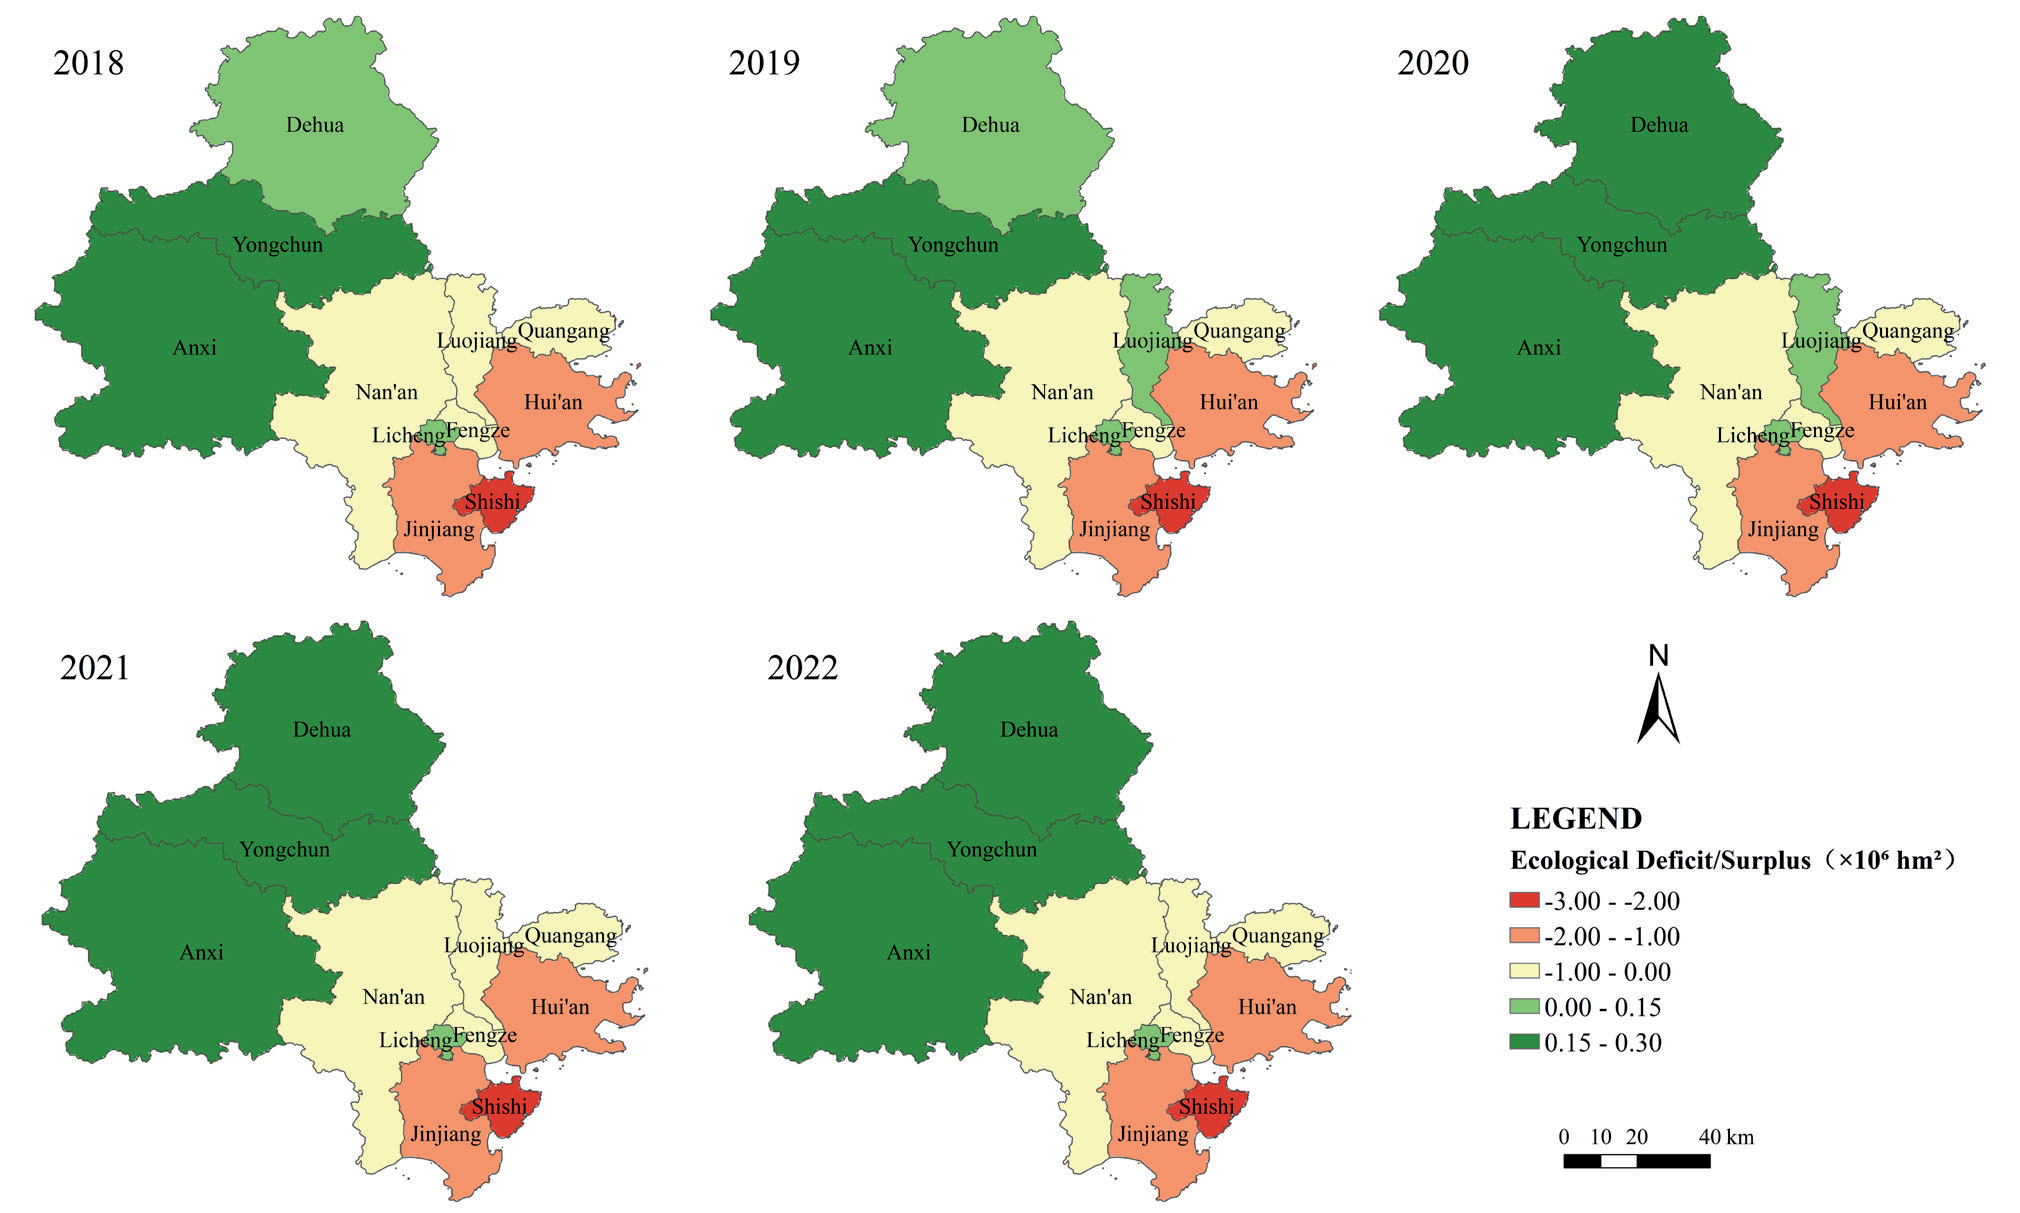
The spatial distribution of ecological surplus/deficit across various districts and counties of Quanzhou City from 2018 to 2022 is shown in Fig. 6. During these five years, areas that remained in a state of ecological surplus were mainly concentrated in the western and northern parts, including Anxi County, Yongchun County, and Dehua County, as well as the central area of Licheng District. Among them, Anxi County had the most prominent ecological surplus, with an average annual surplus reaching 2.63×10⁵ hm2, and overall, it showed an upward trend. The ecological condition of Luojiang District exhibited certain volatility over these five years, successfully transitioning from a state of ecological deficit to a surplus between 2019 and 2020. However, it then reverted to a state of ecological deficit in the following two years, with the degree of ecological loss intensifying, indicating that the ecological condition of Luojiang District is relatively fragile. Shishi City, Jinjiang City, Hui’an County, and Quanhai District, on the other hand, faced more severe ecological deficit issues, among which, Shishi City had the most significant ecological deficit, with an average annual deficit reaching −2.44×10⁶ hm2. However, the ecological deficit situation in Shishi City is gradually decreasing over time, and its ecological condition is steadily improving.
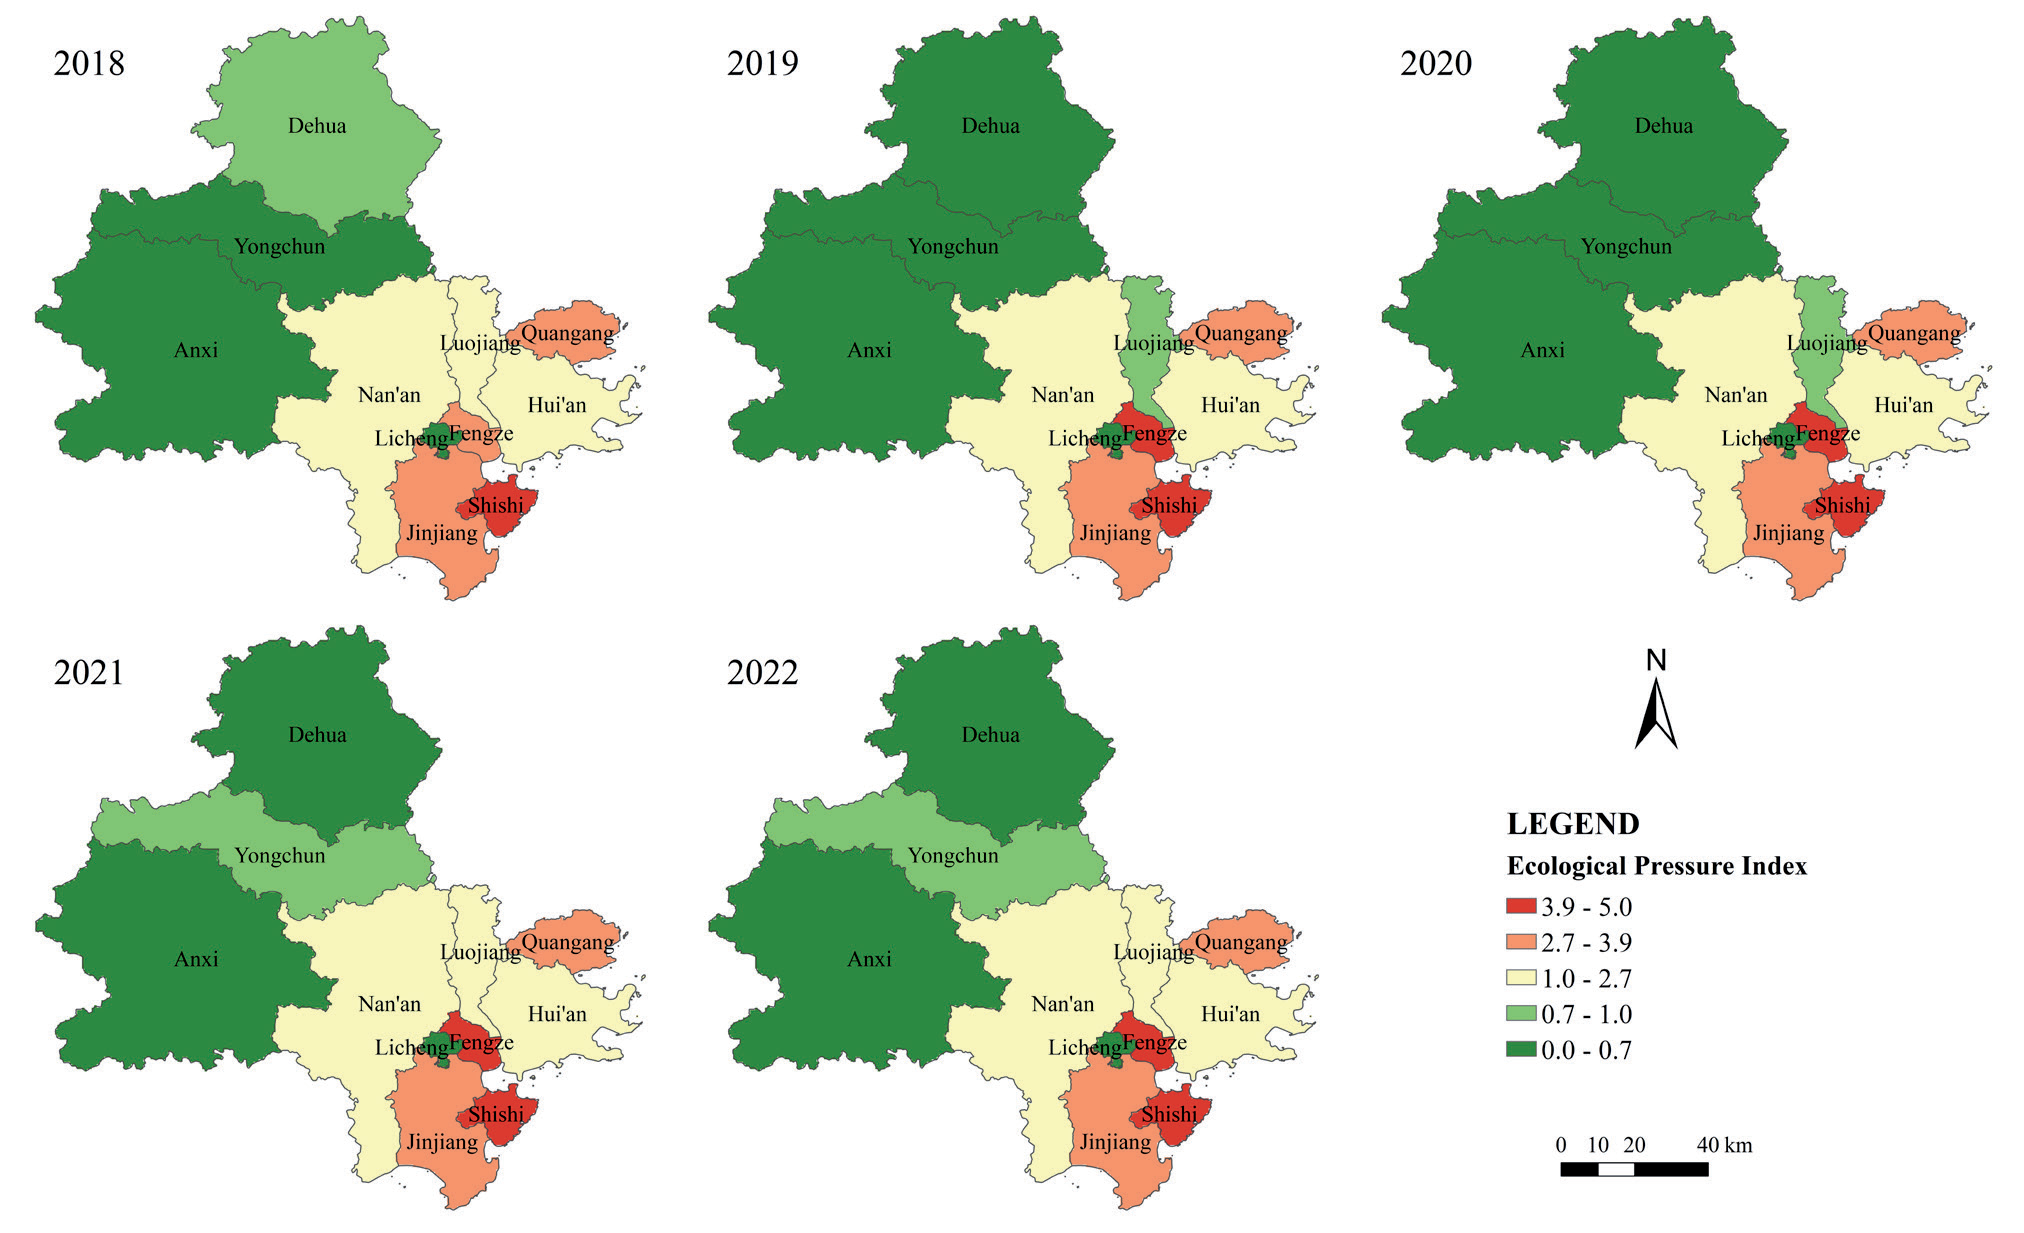
The spatial distribution of the ecological pressure index across various districts and counties of Quanzhou City from 2018 to 2022 is shown in Fig. 7, which generally indicates a decreasing spatial distribution trend from the southeast coast to the northwest inland. In the southeast coastal area, the ecosystem of Shishi City was facing severe challenges, with the highest average ecological pressure index reaching 4.83. Over these five years, its ecological pressure development trend has been relatively stable, always in a high-risk ecological pressure state. Next were Fengze District and Quanhai District, with average ecological pressure indexes of 4.09 and 3.30, respectively. Districts with an ecological pressure index below 1 included Luojiang District, Licheng District, Anxi County, Yongchun County, and Dehua County, among which Licheng District had the smallest ecological pressure index, with an average ecological pressure index of 0.40. In 2021 and 2022, this index further decreased to 0.35 and 0.36, respectively, further alleviating ecological pressure.
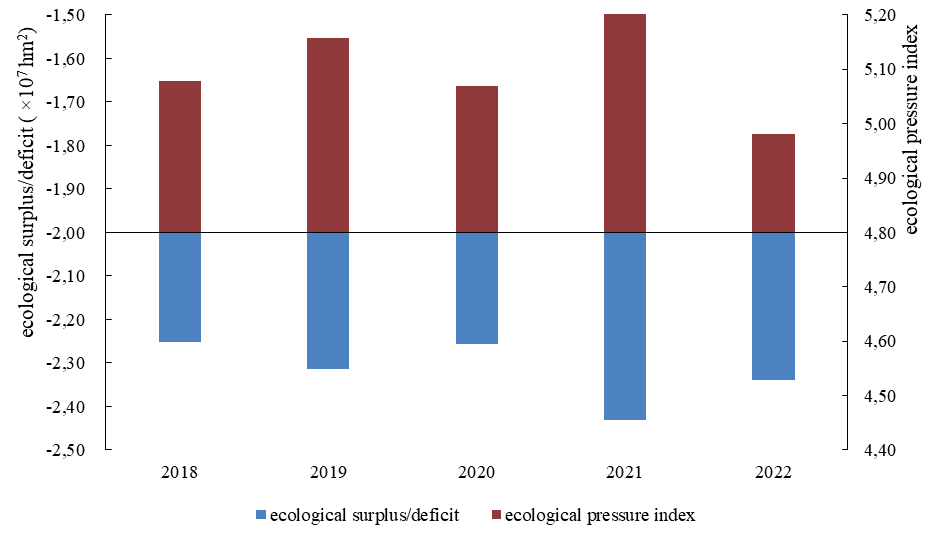
The ecological surplus/deficit and the ecological pressure index for Quanzhou City from 2018 to 2022 are depicted in Fig. 8. Overall, Quanzhou City was in a state of ecological deficit during these five years, with values fluctuating between −2.44×10⁷ and −2.25×10⁷ hm2, indicating that the carrying capacity provided by the ecosystem was significantly lower than the resources consumed and the waste generated. The scale of the ecological deficit widened in 2019 compared to 2018, and the most significant deficit occurred in 2021, reaching −2.43×10⁷ hm2. The average ecological pressure index of Quanzhou City over these five years was 5.11; it rose to 5.16 in 2019, and peaked at 5.25 in 2021. Although the ecological pressure index dropped to 4.98 in 2022, combined with the ecological deficit situation, it suggested that while there were signs of ecological environment improvement, it was still relatively fragile. The overall ecosystem was under considerable pressure, and effective measures were urgently needed to alleviate the ecological deficit and improve ecological security.
Discussion
The southeast coastal areas of Quanzhou City exhibited a relatively high ecological footprint, due to active economic activities on one hand and a unique industrial structure on the other. In Shishi, a typical city, due to its textile and garment industry and marine food industry, every link from production to transportation and sales involves much resource consumption, making energy land and aquatic areas account for a higher proportion of the ecological footprint. Quanzhou City’s current energy structure is still highly dependent on traditional fossil fuels, which can exert significant pressure on the ecological environment and may also face the risk of resource scarcity. Therefore, it is necessary to accelerate the adjustment of the energy structure and increase the proportion of clean energy in energy consumption.
In the northwest inland areas of Quanzhou City, the per capita ecological carrying capacity was high, achieved through the rational use of arable land resources, leading to a significant growth in per capita ecological carrying capacity. It is essential to fully consider the local ecological environment’s carrying capacity during industrial development to avoid excessive and disorderly concentrated development. In the biological account, arable land and aquatic areas contributed the most to the total per capita ecological carrying capacity, while the per capita ecological carrying capacity of construction land. However, a small proportion showed significant growth later on. It is essential to balance the development of various types of land use in urban development and land use. On the one hand, strengthening the protection of arable land and aquatic areas, strictly controlling pollution discharges, and implementing sustainable fishing development strategies are necessary to ensure the stability of their ecological functions. On the other hand, the expansion of construction land must be scientifically planned and strictly managed to improve land use efficiency and prevent blind expansion from causing damage to the ecological environment.
The spatial distribution differences of ecological surplus/deficit and ecological pressure index in various counties and districts of Quanzhou City profoundly reflected the impact of different regional development models on ecological security. The western and northern areas with ecological surplus adhered to the development concept of prioritizing ecology, focusing on environmental protection and sustainable resource utilization, thus achieving a virtuous interaction between the economy and the ecosystem. In contrast, the southeastern coastal areas with severe ecological deficits experienced rapid economic growth at the cost of ecological threats. Quanzhou City demonstrates a persistent ecological deficit status coupled with substantial ecological pressure, a condition mirroring the Budapest Metropolitan Area in Hungary, where both regions exceed local biocapacity thresholds. Notably, their temporal trajectories diverge significantly: While Quanzhou’s ecological deficit exhibited progressive intensification during the 2018-2022 monitoring period, the Budapest Metropolitan Area has successfully mitigated its ecological imbalance through systematic policy interventions since the early 2000s [30]. To reverse this trajectory, Quanzhou must implement three synergistic strategies ‒ ecological restoration through nature-based solutions, industrial restructuring towards circular production systems, and energy mix optimization prioritizing renewable integration. These measures collectively address the root causes of ecological overshoot while maintaining socioeconomic vitality, ultimately aligning regional development with global sustainability frameworks.
The ecological security pattern of Quanzhou exhibits significant spatial heterogeneity, with distinct differences between the southeastern coastal and northwestern inland regions highlighting the profound impacts of industrial structure, energy composition, and land use types on the ecosystem. However, the assessment of this pattern remains constrained by limitations in current data availability. Due to the difficulty in obtaining accurate consumption data, the biological account’s commodity consumption was approximated using production volumes, neglecting critical factors such as inventory fluctuations, cross-regional trade, and processing losses. This approach likely leads to overestimating actual consumption, consequently inflating the ecological footprint and carrying capacity values. For Shishi City, Yongchun County, and Dehua County, edible fungus consumption data were substituted with figures from adjacent years, which may affect the analysis of interannual variation patterns in these areas. This study’s equilibrium and yield factors primarily rely on existing domestic and international research, lacking localized calibration. Future studies could enhance their applicability by incorporating region-specific adjustments based on improved data accessibility. The exclusion of energy accounts at the county-level scale imposes inherent constraints on the comprehensiveness of the ecological security assessment. These methodological limitations represent common challenges in regional ecological security research. Nevertheless, the current findings provide a foundational framework for regional ecological management. As data systems continue to improve, future studies can progressively refine the accuracy of ecological accounting.
Conclusions
This study comprehensively evaluates the ecological security in Quanzhou City from 2018 to 2022. The main conclusions are as follows:
From 2018 to 2022, the ecological footprint across various districts and counties of Quanzhou City was highest along the southeast coast, followed by the northwest inland areas, and lowest in the central areas. Shishi City had the highest average per capita and regional ecological footprints among all districts and counties, reaching 4.45 hm2/person and 3.08×10⁶ hm2, respectively. From an overall perspective of Quanzhou City, energy land and aquatic areas were the main types of biologically productive land, accounting for 63.59% and 28.00% of the total per capita ecological footprint, respectively. The per capita and regional ecological footprints of Quanzhou City showed a fluctuating trend over time and reached a peak in 2021, mainly influenced by the increased consumption of raw coal and crude oil.
From 2018 to 2022, the per capita ecological carrying capacity across various districts and counties of Quanzhou City showed a spatial distribution characteristic of being highest in the northwest inland areas, followed by the southeast coastal areas, and lowest in the central areas, with Yongchun County having the highest at 1.46 hm2/person, and an annual growth rate of 25.00%. The regional ecological carrying capacity was higher in the central areas and lower around the periphery. Nan’an City had the highest, at an average annual ecological carrying capacity of 9.80×10⁵ hm2, which increased by 5.42% over the five years. Arable land and aquatic areas were the main contributors to the total per capita ecological carrying capacity of Quanzhou City, accounting for 81.5%. The average per capita ecological carrying capacity of construction land was 0.05 hm2/person, peaking in 2022 with an increase of 13.90%.
From 2018 to 2022, Anxi County, Yongchun County, and Dehua County in the west and north of Quanzhou City and Licheng District in the middle of Quanzhou City maintained ecological surplus, especially Anxi County, with an average annual surplus of 2.63×10⁵ hm2. However, Shishi City suffered the most severe ecological deficit, with an average annual deficit reaching −2.44×10⁶ hm2. The ecological pressure index decreased from the southeast coast to the northwest inland, with Shishi City having the highest ecological pressure, an average index of 4.83. In contrast, Licheng District had the lowest ecological pressure, with an average index of 0.40, further dropping to 0.35 and 0.36 in the last two years. Quanzhou City was generally in a state of ecological deficit over these five years, reaching the highest value in 2021, at −2.43×10⁷ hm2. The average ecological pressure index for Quanzhou City over the five years was 5.11, peaking at 5.25 in 2021, indicating that the overall ecosystem of Quanzhou City still faced significant pressure.

