

Introduction
Natural capital and ecological services are the cornerstones of human survival and the continuation of modern civilization and are the key supports for sustainable social and economic development [1]. With the development of the social economy, increasing human activity has meant that the consumption of natural resources has gradually exceeded the ecosystem’s supply. Therefore, the concept of sustainable development has become mankind’s consensus. Many studies around the world have explored methods for assessing urban development and ecological conditions. Assessment methods have gradually evolved from initial simple qualitative assessments to multi-angle quantitative assessments, with the ecological footprint method becoming one of the mainstream methods. The components [2], influencing factors [3], and determining factors [4, 5] of ecological footprints have been explored globally, and sustainable development policies have been integrated into the ecological footprint method [6]. This multi-factor ecological assessment method better reflects the impact of changes in sustainable development policy and the functional transformation of the ecosystem on ecological status. Relevant research results show that increased urbanization levels, increased energy consumption, and the implementation of relevant policies are related to the ecological footprint [7, 8].
Because of its superior ability to reflect the economic development and ecological connection of cities, a variety of ecological footprint models combined with relevant factors have been built. For example, Małgorzata combined the ecological footprint with the ecological carrying capacity to evaluate the environmental carrying capacity of European cities [9]. Muhammed correlated these factors to analyze Bali’s land-carrying capacity value [10], and Shi analyzed the driving factors of green development in tourist cities using the improved ecological footprint model combined with urban GDP [11]. However, these ecological footprint methods do not fully reflect the impact of ecosystem service diversity on ecology, making it difficult to track the trends in ecological value [12].
Accordingly, increasing research has focused on the organic integrations between ecosystem service value (ESV) and ecological footprint. Min built a more comprehensive pollution footprint model based on traditional ecological footprint analysis combined with the ecological footprint concept of ecosystem services [13]. Li assessed the ecological security of the Manas River Basin based on the ecological footprint model of ESV improvement, combined with equilibrium factors and yield factors [14]. The improved ecological footprint model in the present study combines the theories of ESV and ecological footprint, and it considers the diversity of ecosystem functions compared with the traditional ecological footprint model. Furthermore, by including equilibrium factors and yield factors, the model can achieve the overall analysis and unified calculation of regional ecological status in evaluating ecological status [15]. The value of ecosystem services and ecological footprints also has broader application backgrounds in ecological security, land use, and climate change. Zhang has conducted many related studies, including using geographic information mapping, improved algorithms, and Markov FLUS models to analyze land use changes and their impact on ESV in Ezhou City from 2001 to 2020 and set up multi-scenario simulations. These studies provide guidance for improving the regional ecological environment, developing sustainable land use and ecological restoration strategies for Ezhou City, and addressing the challenges of land use change to ecological security [16].
The Chengdu-Chongqing economic circle occupies a unique and important strategic position in the overall development of China. Therefore, the Chengdu-Chongqing economic circle has achieved rapid development in various aspects, such as economy and culture, but it faces some unique ecological problems in the rapid development process. Firstly, the acceleration of urbanization has led to the development of a large amount of land, the continuous compression of natural ecological spaces, and the threat to biodiversity. Secondly, the development of industry and transportation has brought serious environmental pollution problems, such as air pollution, water pollution, etc. Furthermore, population growth and increased economic activity have intensified resource consumption and continued ecological pressure [17-19]. In view of the dual pressures of economic development and environmental protection, it is of great importance to promote the conservation of the ecological environment [20]. As urbanization levels increase and planning for the construction of the Chengdu-Chongqing economic circle progresses, an ecological assessment of this region is urgently needed [21]. As an important economic growth pole with a crucial strategic position, studying the ecological issues in this region can promote the coordinated development of the economy and environment and demonstrate the country’s sustainable development. Secondly, typical ecological problems, such as the ecological pressure and changes in the value of ecosystem services brought about by urbanization, are representative and can provide a reference for other regions. Finally, the strong support of national policies is conducive to promoting the implementation and improvement of policies. In the past, ecological assessments of the Chengdu-Chongqing economic circle only focused on a single index, such as ESV, ecological index, or landscape pattern. This resulted in classification, comparison, or research on a single ecosystem aspect in assessing ecological status, which failed to fully link the specific development situation of the Chengdu-Chongqing economic circle with ecological status [22-24]. This article adopts the theory of ecological footprint and ESV, organically combining ecological footprint with ESV so that ecological footprint reflects ecosystem demand, ecological carrying capacity reflects supply, and more comprehensively measures regional ecological status. In the model, equilibrium factors and yield factors are calculated based on the value of ecosystem services, taking into account various ecological service functions of land. Unlike traditional models that only consider biological productivity functions, it accurately reflects regional differences in ecological service capabilities. Multi-source data, including land use data and socio-economic statistical data (from multiple yearbooks), is used to calculate ecological carrying capacity and model parameters, and the data is rich and targeted.
Accordingly, the present study used the ecological footprint model based on the improvement of ESV to calculate and analyze the ecological footprint and ecological carrying capacity of the Chengdu-Chongqing economic circle from 2012 to 2022. This enabled an ecological footprint model of the Chengdu-Chongqing economic circle to be built. By including the PLUS prediction model, the land use of the Chengdu-Chongqing economic circle in 2027 was predicted, and the ecological footprint model of the Chengdu-Chongqing economic circle in 2027 was constructed to inform the economic development and ecological protection strategy of the Chengdu-Chongqing economic circle.
Materials and Methods
Study Area
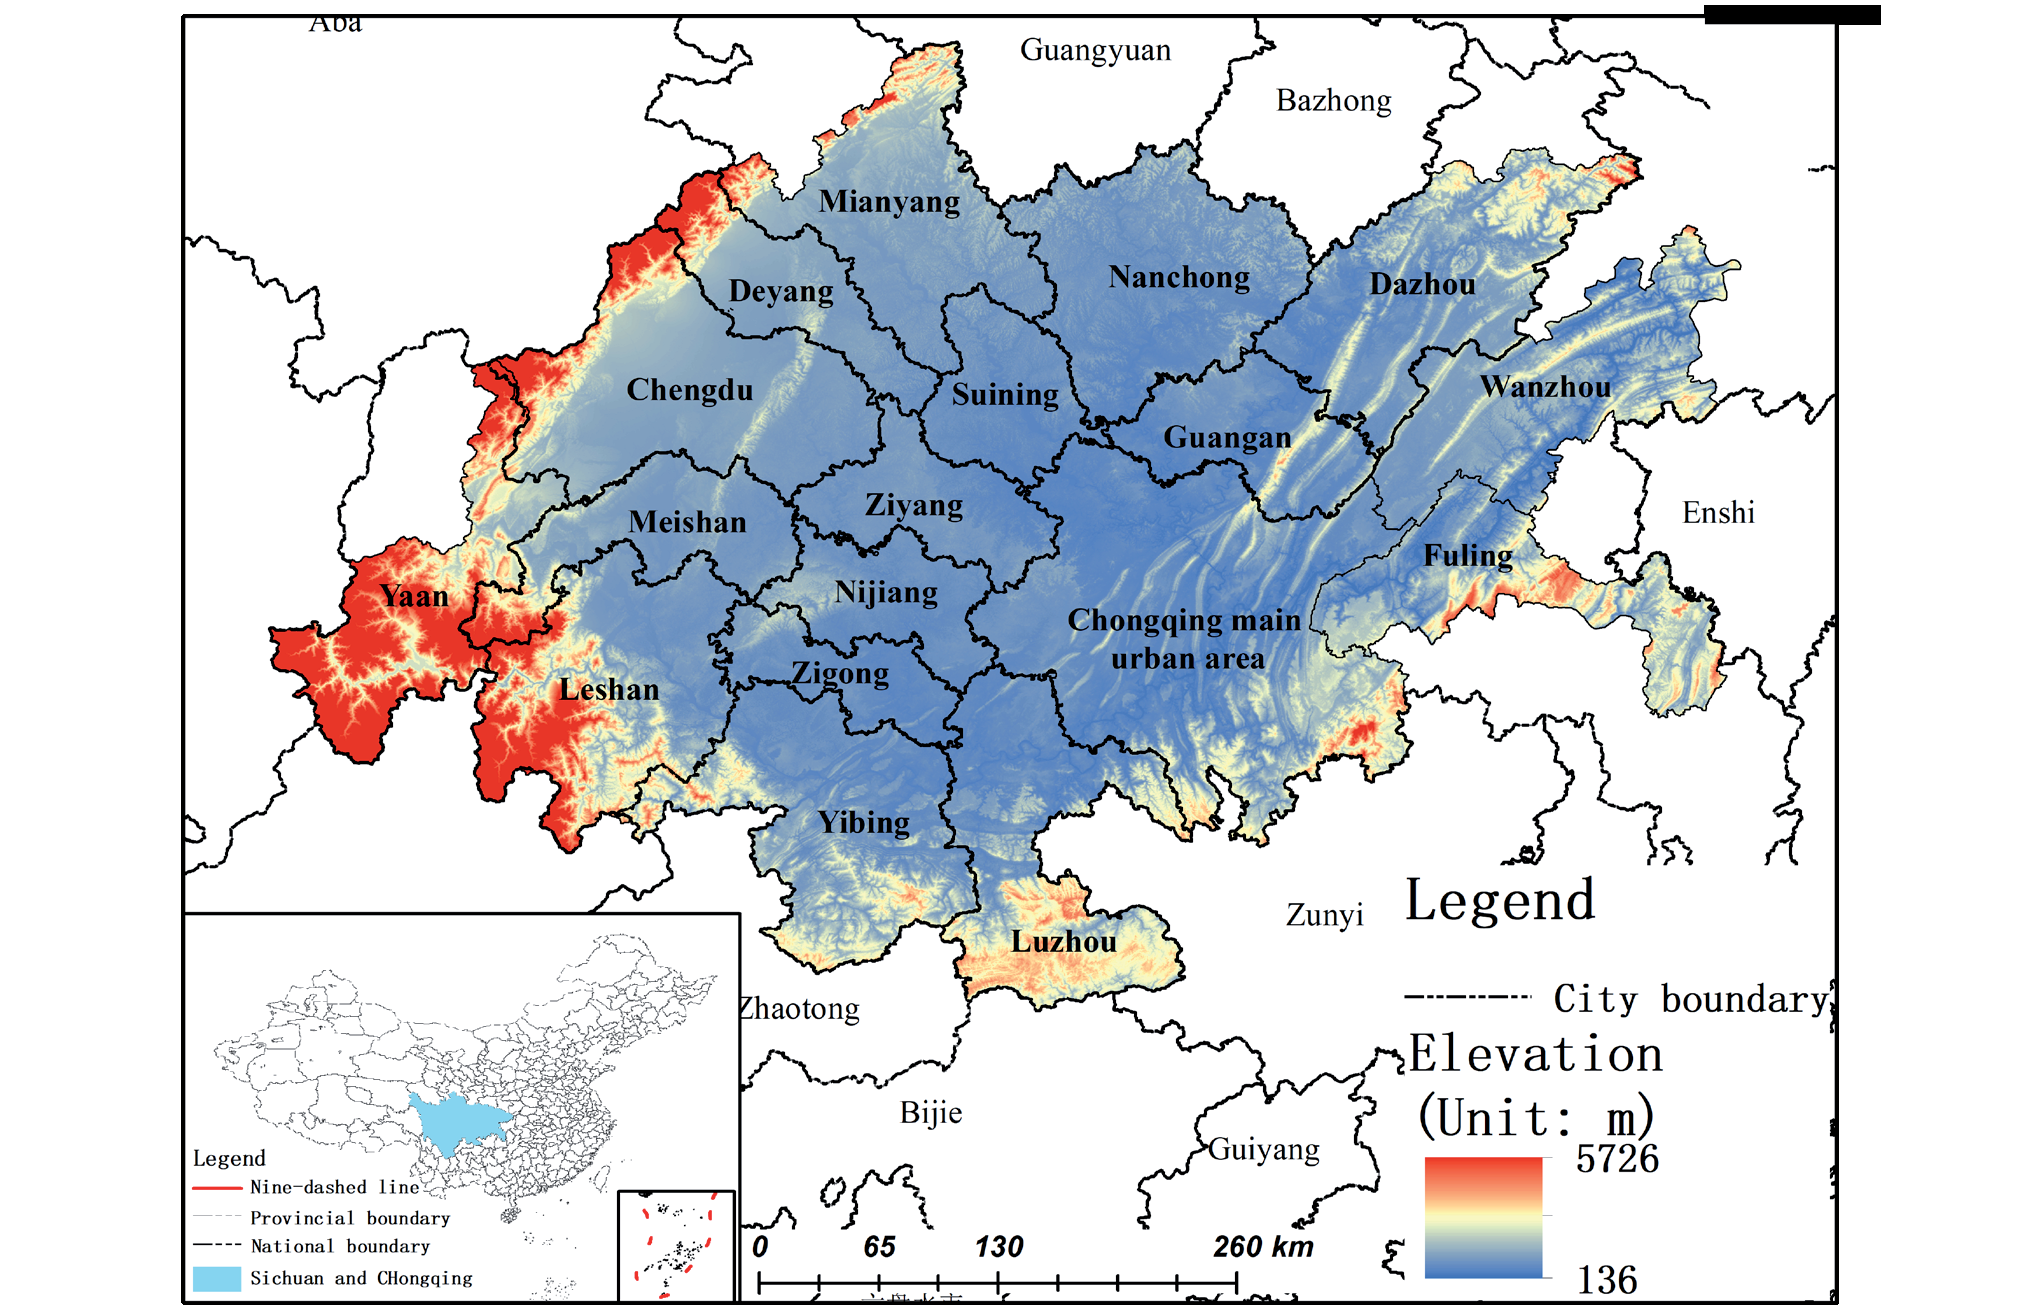
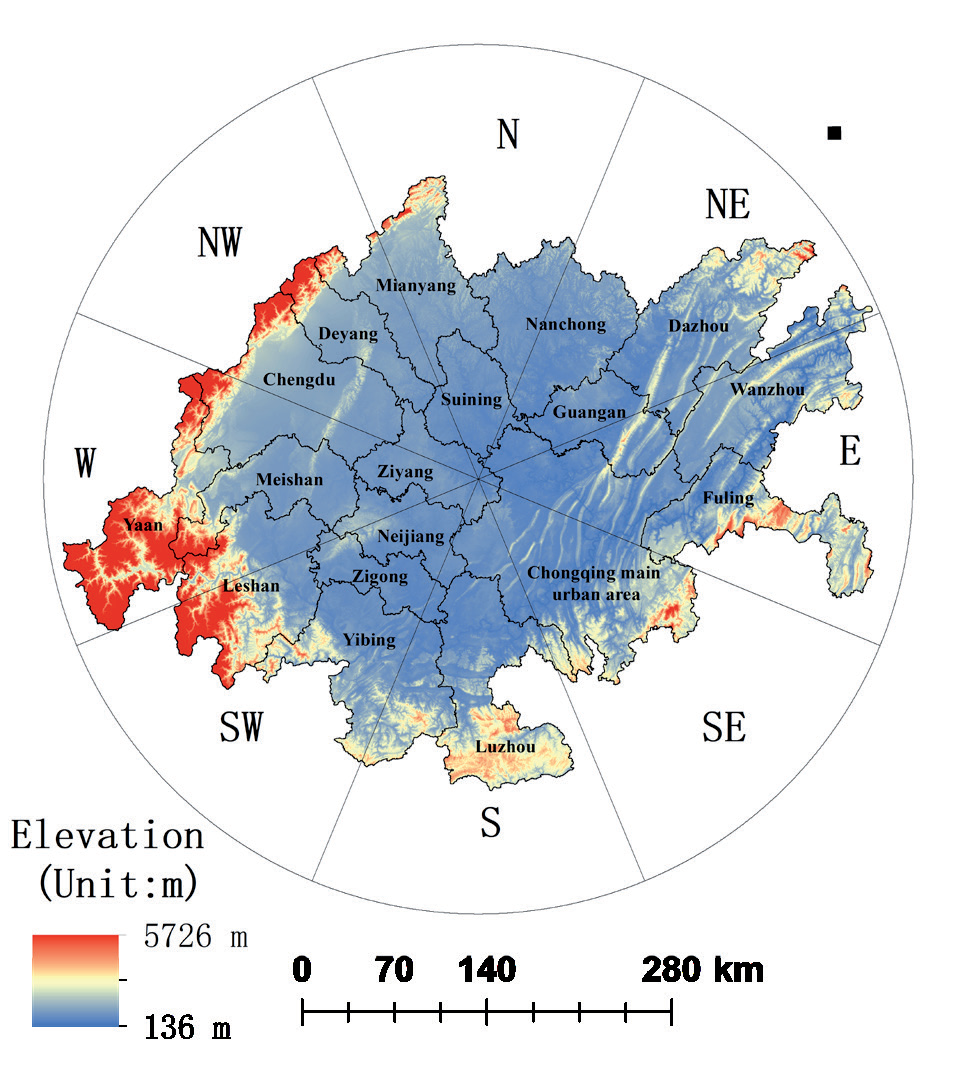
The Chengdu-Chongqing economic circle is in southwest China, between 101°56’39”–109°14’51”E longitude and 27°39’66”–33°02’40”N latitude. It is at the intersection of the ‘Belt and Road’ and the Yangtze River Economic Belt and is the starting point for the new land and sea passage in the west. It has the unique advantages of connecting the southwest and northwest, as well as East Asia, Southeast Asia, and South Asia. The study area encompassed 27 districts (counties) in Chongqing, including Yuzhong, Wanzhou, and Qianjiang, as well as parts of Kaizhou and Yunyang. (Chongqing has a large number of single cities, so it is divided into three regions: the Chongqing main urban area, Wanzhou, and Fuling [25]). The study area also included 15 cities in Sichuan Province, including Chengdu, Mianyang (except Beichuan and Pingwu), Dazhou (except Wanyuan), and Ya’an (except Tianquan and Baoxing). The research area has excellent ecology, abundant energy and mineral resources, dense urban areas, and diverse scenery. It is the most densely populated area in western China and has the strongest industrial foundation, the strongest innovation ability, the broadest market space, and the highest degree of openness; thus, it has a unique strategic position in the country’s development. The city has a total area of 185,000 Km2 (Fig. 1).
Data Source and Processing
The data sources used in this study included the following. The ChinaLandCoverDataset (CLCD) land use data set of Wuhan University, the 2012-2022 China Statistical Yearbook, the Sichuan Statistical Yearbook, the Chongqing Statistical Yearbook, and the national agricultural product cost and income data compilation. The PLUS model’s predictors included NDVI data, precipitation data, GDP data, population density data, and 2022 DEM (SRTMDEM) data from 2012 to 2022 (Table 1). According to the equivalent factor method, the 2012, 2017, and 2022 land use data were reclassified into six categories: farmland, forest, grassland, water area, desert, and construction land. The ESV ecological footprint and ecological carrying capacity of the Chengdu-Chongqing economic circle were quantitatively calculated based on socio-economic statistical data. The PLUS model was used to forecast the land use in the study area in 2027 and calculate the corresponding ecological indicators in the study area in 2027. Finally, the ecological indicators of the study area from 2012 to 2027 were analyzed in time and space.
ESV Calculation
The ecological service value refers to the various benefits that the ecosystem provides to human beings. Xie adopted an ESV calculation method based on equivalent factors [26]. In this approach, the existing equivalent factor table was revised according to the land use type of the study area, and the definition of ESV was combined with one standard equivalent factor. The Equations are as follows:
Here, Dt is the amount of ESV of a standard equivalent factor in year t, j is the crop type, mj is the sown area of food crops of class j (hm2), pj is the price of crop type j (yuan·kg–1), qj is the yield per unit area of crop type j (kg·hm–2), and Mt is the total sown area of n food crops in t year. Fi is the sum of the equivalent factors of the service value of class i ecosystem, and eik is the equivalent factor of ecological service value k of class i ecosystem. Pi is the value of ecosystem services per unit area of a class i ecosystem.
Construction of Ecological Footprint Model
Ecological Footprint Model
The ecological footprint is transforming the waste consumed and discharged from a regional development into a certain area of bioproductive land. This enables the regional sustainable development status to be determined by comparing the supply and demand. In this model, the ecological footprint reflects the ecosystem’s needs and represents the area with the total ecological service function required for human survival and development in a region. The ecological carrying capacity reflects the supply of ecosystems and represents the total area of various ecosystems that a region provides for the development of human society. These aspects are calculated via the following Equations.
Here, EF is the ecological footprint, N is the region’s total population, ef is the per capita ecological footprint, ri represents the equilibrium factor of class i ecosystem, and aai represents the converted per capita ecosystem area of class i. EC represents the ecological carrying capacity, ec means per capita, ai is the actual per capita occupancy of class i ecosystem area, and yi is the yield factor of class i ecosystem. ER stands for ecological surplus, and ED stands for ecological deficit. When EC>EF, the supply capacity of ecosystem services is greater than the loss capacity, and the region is in the ecological surplus state, EC – EF = ER. When EC<EF, the ecosystem service supply capacity is lower than the depletion capacity, and the region is in the ecological deficit state, EC – EF = ED.
Table 1.
Data Source.
Calculation of Equilibrium Factor and Yield Factor
When calculating the ecological footprint and ecological carrying capacity, due to the different production capacities of different types of biological productive land and the differences in the production capacities of the same biological productive land in different regions, for unified accounting, the land is transformed into areas of the same production nature through equilibrium factors. The bioproductive land area is compared between regions using the yield factor, which is calculated according to the following Equations.
Here, Pi is the value of ecosystem services per unit area of class i ecosystem in the study area (yuan·hm–2·a–1), P̅ NP is the average ESV per unit area of all ecosystems in the study area (yuan·hm–2·a–1), Dt is the ESV of one standard equivalent factor in the study area in years (yuan·hm–2), and Fi is the sum of equivalent factors of service value of class i ecosystem in the study area. Si is the area of class i ecosystem of the study area (hm2); E̅ i is the value of ecosystem services per unit area of class i ecosystem in China (yuan ·hm–2·a–1); D t is the national ESV of year t with a standard equivalent factor (yuan ·hm–2); and F t is the sum of equivalent factors of the value of class i ecosystem services in China.
Spatiotemporal Analysis Method
Standard Deviation Ellipse Method
As a quantitative analysis method for the spatial distribution characteristics of geographical elements, the standard deviational ellipse analysis method can accurately reveal the spatial distribution center, dispersion, and direction trend of geographical elements [27]. To evaluate the relationship between ESV, ecological footprint, and ecological carrying capacity, as well as the evolution trend and influencing factors of these three ecological indicators, the above ecological indicators were analyzed using standard deviational ellipse analysis. The specific calculation Equations are provided below.
Here, SDEx and SDEy are the center coordinates of the ellipse calculated at last; xi and yi are the spatial position coordinates of each element; X̅ and Y̅ are the arithmetic mean centers; x̃ i and ỹi are the differences between the mean center and the xy coordinates, and n is the number of all spots. tanθ is an elliptical direction angle, and σx and σy are the standard deviations of the X and Y axes, respectively.
Hotspot Analysis
Hotspot analysis, a local spatial autocorrelation index, can detect the spatial aggregation of high or low values of ecosystem services. The statistical significance can be tested using the standardized Z-value of 100 million to verify that the Z-value is positive. The higher the value, the closer the clustering of the high values (hot spots); the more negative the Z-value, the closer the clustering of low values (cold spots) [28]. To identify potential ecological problems in the study area, this study analyzed the spatial aggregation pattern and distribution trends in ESV, ecological footprint, and ecological carrying capacity in the Chengdu-Chongqing economic circle by hotspot analysis. The following Equations were used.
Here, Gi* is the plaque aggregation index, wij is the weight matrix between patches i and j, and xi and xj are the attribute values of patches i and j. Additionally, n is the total number of plaques, x is the mean of all patches in the space, and S is the standard deviation of all patch attribute values.
PLUS Prediction Model
The PLUS model is an improved model based on the FLUS model, which can predict land use changes, urban expansion planning, ecological environment assessment, etc. The model uses the forest algorithm to extract land expansion data from two phases of land change. The land expansion analysis strategy (LEAS) and the cellular automata model (CARS) of multiple random patch seeds reveal the causes of land use changes to better analyze their impact on the ecological environment and economic development. In the PLUS model, the expansion and change process of land use can be simulated more accurately by adopting the LEAS strategy. The simultaneous application of the CARS model also enables the more accurate modeling of different types of land-use patches. These improvements make the PLUS model more reliable and accurate in land use change analysis, which is of great significance for improving the science underpinning sustainable land use.
In the present study, Chengdu-Chongqing economic circle land use data from 2012 and 2017 were used as the original data, and land use data from 2022 were simulated to evaluate the prediction results. The predictive OA accuracy was 90.02%, and the Kappa coefficient reached 80.00%.
Results and Discussion
Temporal and Spatial Change Analysis of ESV
Analysis of Temporal Change in Ecological Service Value
Combined with the land use prediction results of the Chengdu-Chongqing economic circle in 2027 by the PLUS model, the equivalent factor method was used to calculate the ESV of the Chengdu-Chongqing economic circle in 2012–2027 (Table 2). The results showed that the ESV of the Chengdu-Chongqing economic circle fluctuated. From 2012 to 2027, it decreased, increased, and then decreased, showing a И fluctuation trend. From 2012 to 2027, it showed a fluctuating increasing trend, from 346.072 billion yuan in 2012 to 414.825 billion yuan in 2027, peaking at 447.291 billion yuan in 2022. Overall, the value of ecosystem services in the study area followed a fluctuating and increasing trend; this indicated that there was attention to ecological protection in conjunction with economic construction in the study area, in accordance with the concept of sustainable development. It is speculated that the substantial increase in the value of ecosystem services in the study area from 2017 to 2022 was strongly correlated with the development of the Chengdu-Chongqing economic circle and the release and implementation of relevant documents.
The contribution of different classes to the ESV of the Chengdu-Chongqing economic circle from 2012 to 2027 was as follows: forest>farmland>water area>grassland>desert. Farmland, forest, grassland, and desert showed an increasing trend in ESV from 2012 to 2022, peaking in 2022 and then decreasing from 2022 to 2027. The water area showed a continuously increasing trend from 2012 to 2027. The ESV of construction land was not considered, so it was zero. In conclusion, the contribution rate of farmland, forest, grassland, and desert to the ESV of the Chengdu-Chongqing economic circle did not significantly change from 2012 to 2027, while the contribution rate of water area to the ESV of the study area showed an increasing trend. The increase in the contribution rate of water area to the value of ecosystem services was in parallel with the release of the “Water Security Plan of Shuangcheng Economic Circle in Chengdu-Chongqing”.
Analysis of Spatial Changes in ESV
The ESV of the Chengdu-Chongqing economic circle from 2012 to 2027 was graded according to the distribution (Fig. 2). The results showed that the value of ecosystem services in the western part of the study area was higher during 2012-2027, while the value of ecosystem services in the central and northern parts of the study area was relatively lower. This was partly related to the land cover in the Chengdu-Chongqing area. At the edge of the study area, the terrain is not flat, and there is much forest and grassland, which effectively maintains the ecosystem’s self-regulation ability. The central area of the study area is suitable for human habitation and agricultural production activities on the Sichuan Plain, so it is mostly farmland and construction land circle, which results in ecosystem damage. Therefore, the value of ecosystem services on the fringe of the study area was higher than that in the middle of the study area.
From 2012 to 2027, the economy at the edge of the Chengdu-Chongqing economic circle was relatively underdeveloped, and grassland and forest played a strong role in maintaining the ecosystem. Therefore, the ESV of Ya’an, Leshan, Yibin, and Luzhou at the edge of the Chengdu-Chongqing economic circle was relatively high. The central region of the study area underwent rapid economic development, resulting in a large amount of construction land and farmland. Therefore, the ESV of Chengdu, Mianyang, Neijiang, Nanchong, and Guang’an was relatively low. Although the economic development of Chongqing in the eastern part of the Chengdu-Chongqing economic circle was rapid, the ESV of the eastern part of the Chengdu-Chongqing economic circle was also relatively high due to the influence of the terrain and land cover type. In summary, while continuously developing the value of ecosystem services in the central region of the research area, more attention should be paid to protecting the ecological environment and constructing ecological civilization, thereby achieving sustainable development.
Table 2.
Statistical Table of Ecosystem Service Value (Unit: Billion Yuan).
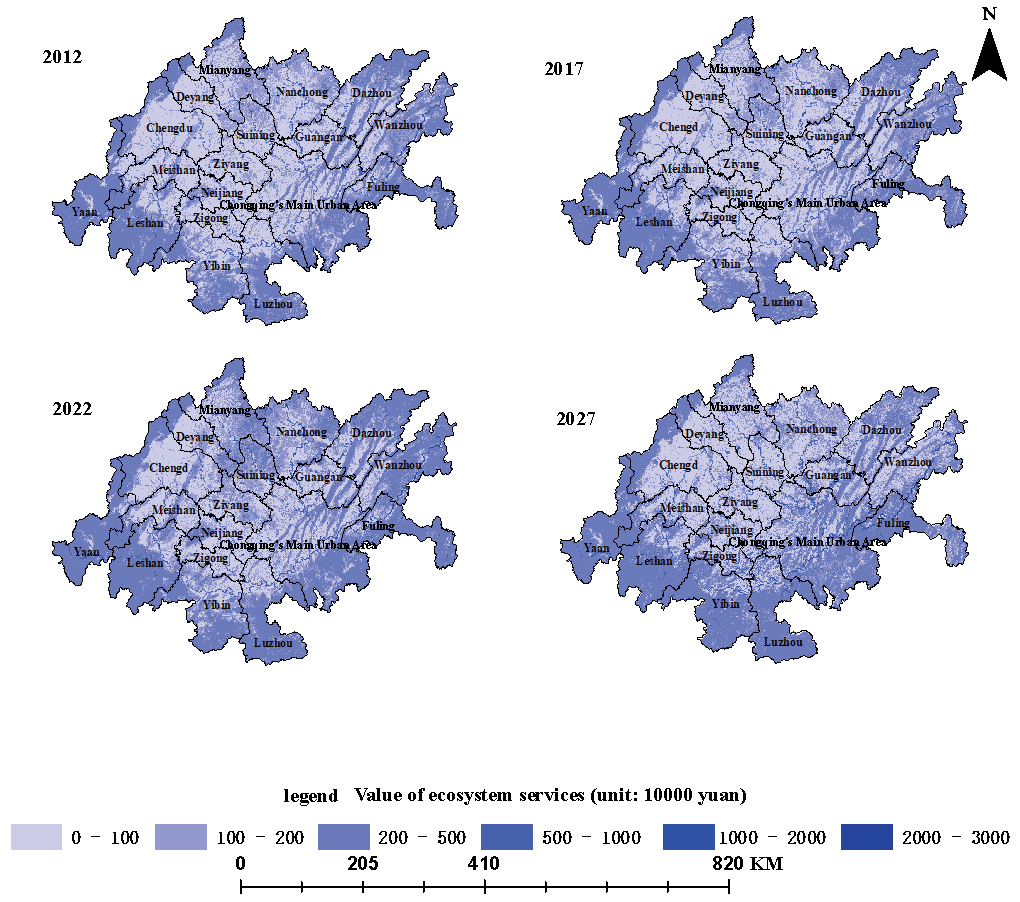
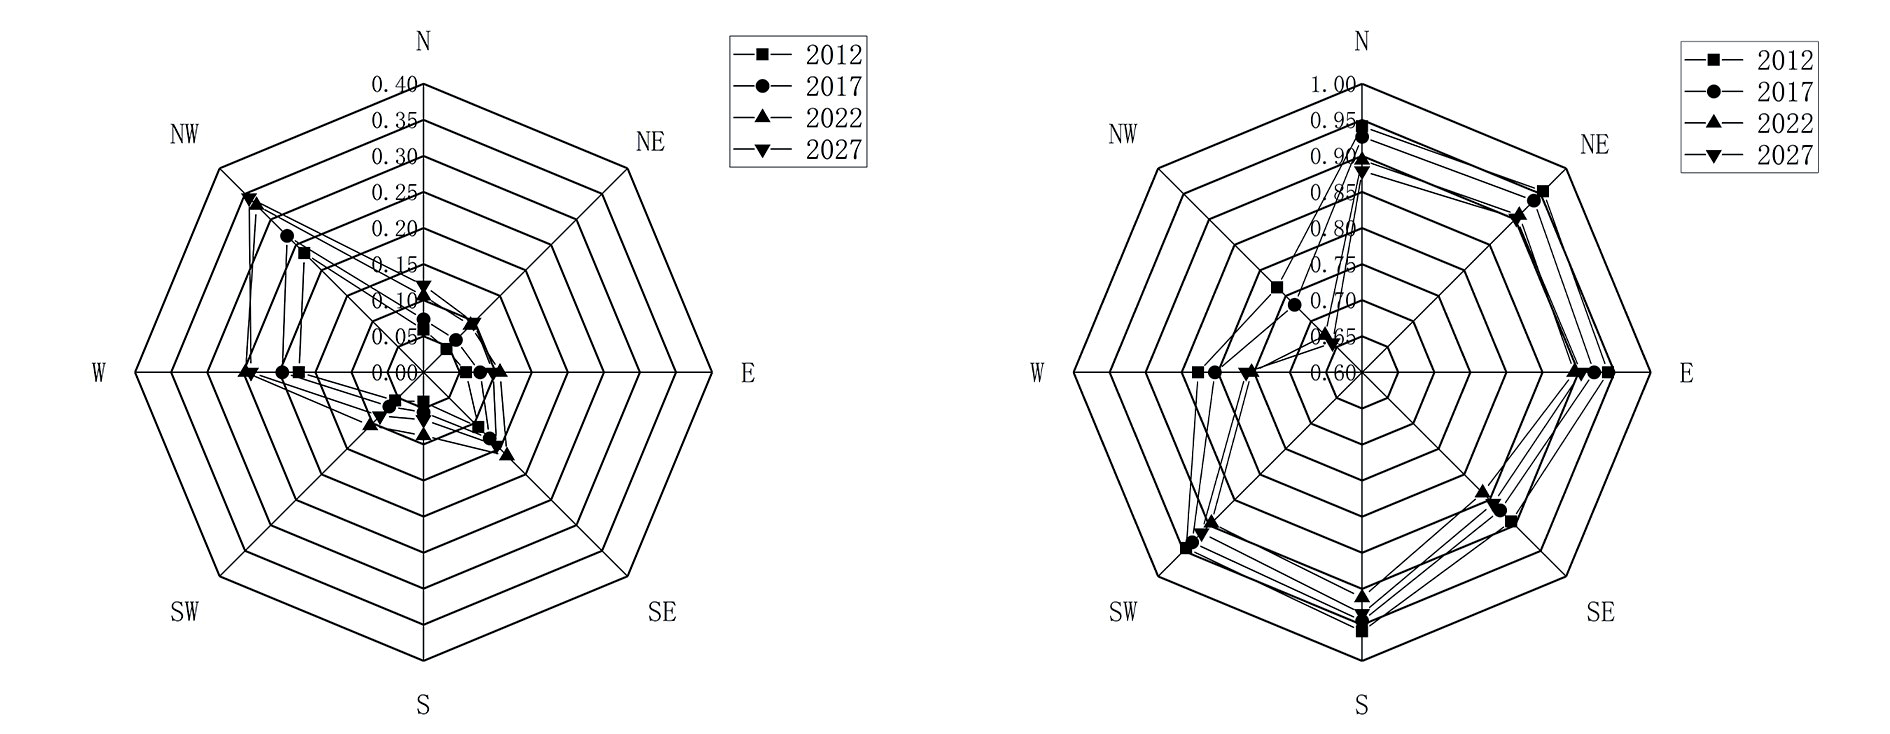
A standard deviational ellipse analysis was performed to analyze the spatial distribution characteristics of ESV in the Chengdu-Chongqing economic circle. This provided the directional distribution characteristics of ESV in the study area (Fig. 2). The results showed that from 2012 to 2022, the center of eESV in the Chengdu-Chongqing economic circle migrated to the northwest and then to the northeast, showing an upward trend in its center of gravity. From 2022 to 2027, the center of gravity of ESV in the Chengdu-Chongqing economic circle shifted to the southwest, showing a downward trend. The standard deviation of the elliptic shape plotted did not change significantly during 2012-2022, indicating that the development, expansion intensity, and cohesion of ESV in the Cheng-Chongqing economic circle did not significantly change. In 2027, the plotted distribution range of the standard deviational ellipse decreased significantly, indicating that the expansion intensity of the development of ESV in the study area was weakening, and the cohesion was strong. This indicates that the supply of ESV in the study area became more spatially concentrated from 2012 to 2027, and the peripheral high-value area drove the development of the inner low-value area. This was consistent with relevant development concepts such as the central city of Chengdu-Chongqing economic Circle driving small and medium-sized cities.
Fig. 3.
ESV Hotspot Analysis of Chengdu Chongqing Economic Circle and the Center of Gravity Migration Route.
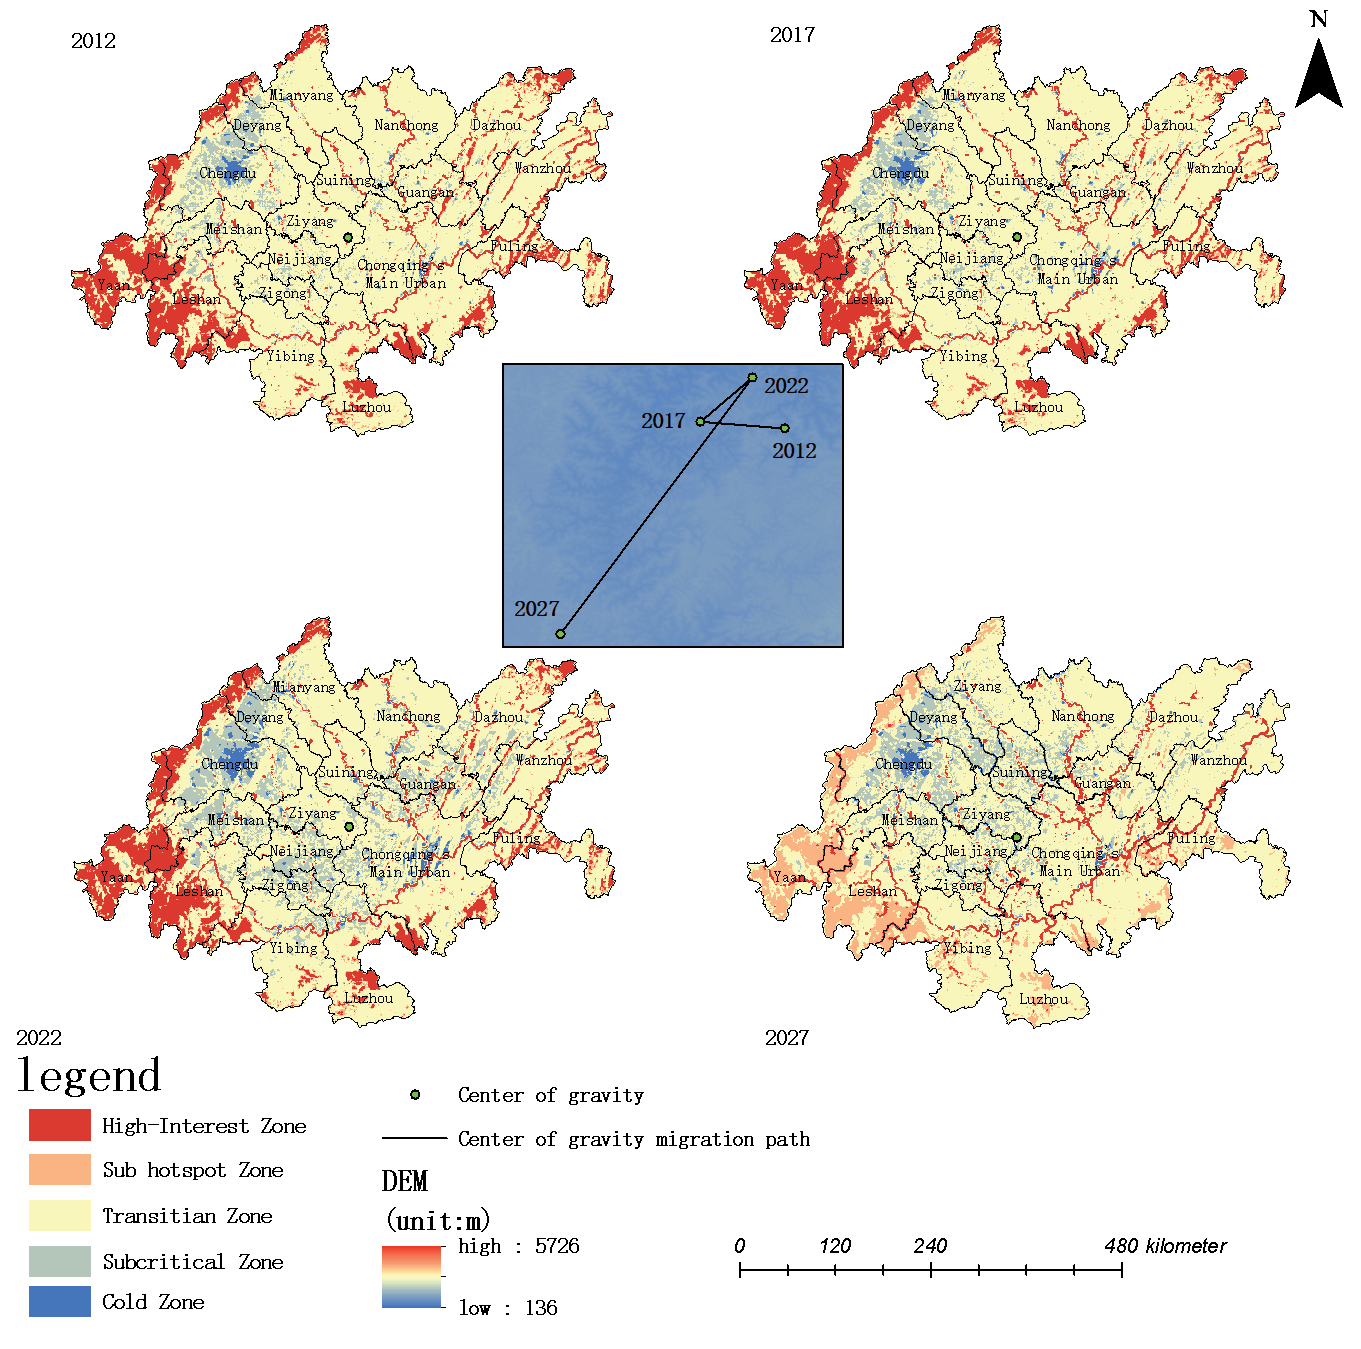
Next, a hot spot analysis of ESV in the Chengdu-Chongqing economic circle was performed. The degree of spatial aggregation of the ESV was divided, from high to low, into cold spot areas, sub-cold spot areas, transition areas, sub-hot spot areas, and hot spot areas (Fig. 3).
The statistical analysis of the classification data (Table 3) showed that most of the hot spots in the study area were concentrated. Some were distributed in the forest and grassland areas in the western part of the study area, and some were distributed in the water area of the study area. The distribution of cold spots in the study area was also relatively concentrated, mainly in the area of accumulated construction land in the northwest region. From 2012 to 2027, with the continuous expansion of construction land in the Chengdu-Chongqing economic circle, the sub-cold spot areas and transition areas around the construction land transformed into cold spot areas and sub-cold spot areas, respectively. This hotspot distribution trend was formed mainly due to the importance of protecting the ecological environment in the Chengdu-Chongqing economic circle development strategy. The expansion of cold spot areas and sub-cold spot areas indicated that the ecological condition of the study area was deteriorating. Therefore, along with urban development, attention to protecting the ecological environment is needed to construct an ecological civilization.
Table 3.
Statistical Table of the Proportion of Area in Different Levels of ESV, EF and EC Hotspot Analysis in the Chengdu Chongqing Economic Circle (%).
Temporal and Spatial Change Analysis of the Ecological Footprint Model
Temporal Change Analysis of the Ecological Footprint and Ecological Carrying Capacity
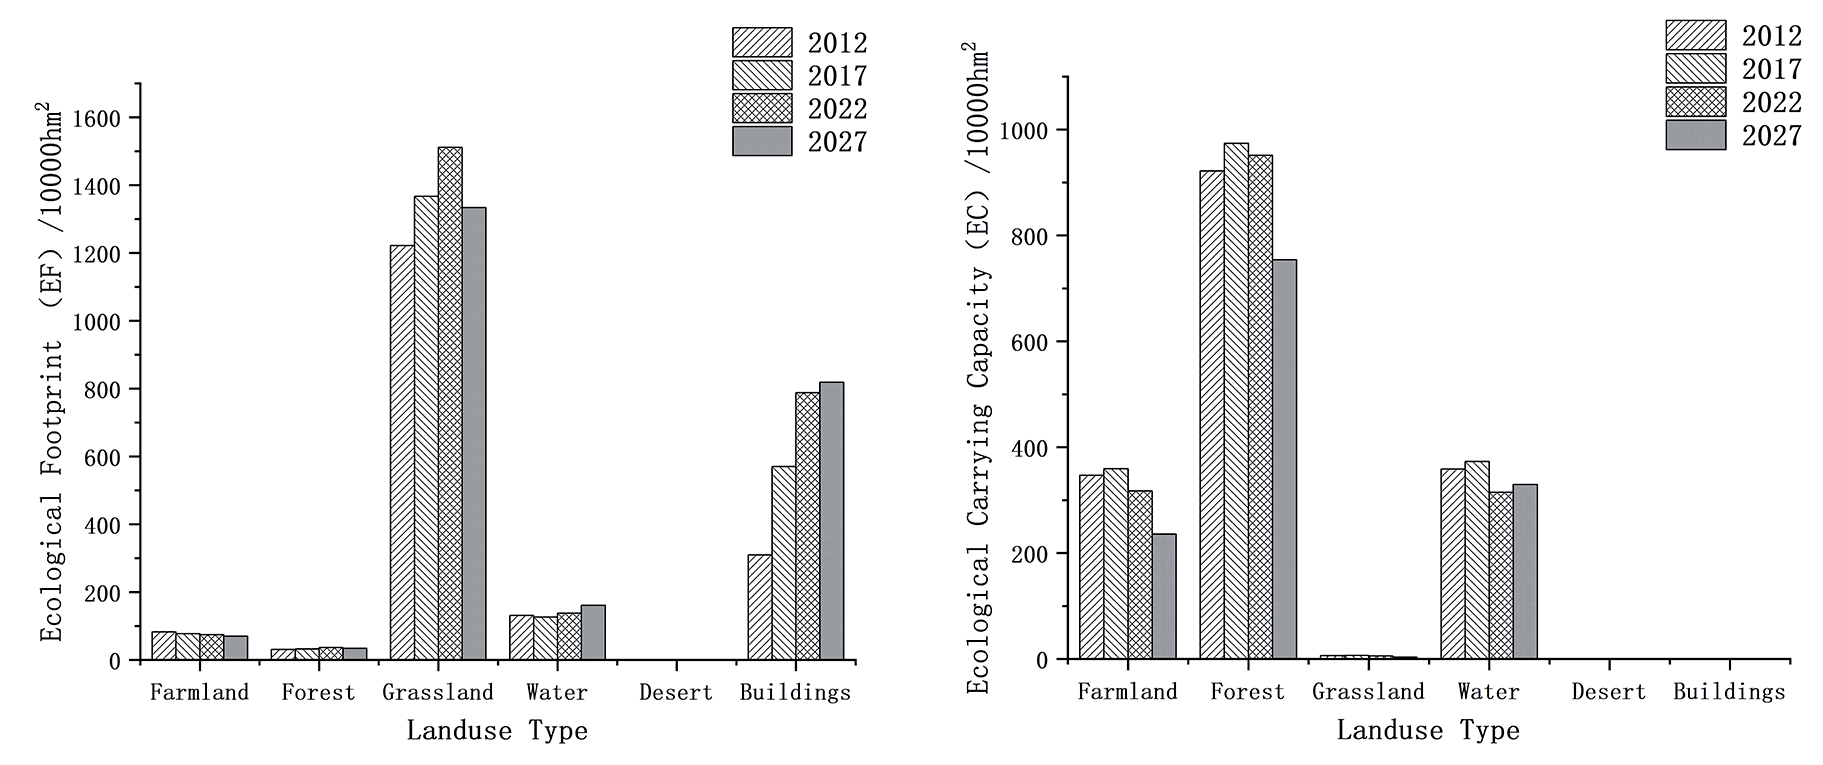
Combined with the calculation parameters of the Chengdu-Chongqing economic circle forecast in 2027, the ecological footprint model of the Chengdu-Chongqing economic circle from 2012 to 2027 was constructed based on the ecological footprint model of ESV (Fig. 4). The results showed that the ecological footprint of the Chengdu-Chongqing economic circle first increased and then decreased. The ecological footprint showed an increasing trend from 2012 to 2022 and a decreasing trend from 2022 to 2027. The ecological footprint increased from 17.7597 million hectares in 2012 to 24.1791 million hectares in 2027, peaking at 25.4855 million hectares in 2022. The ecological carrying capacity of the Chengdu-Chongqing economic circle showed an increasing trend from 2012 to 2017 and a continuous decreasing trend from 2017 to 2027, decreasing from 16.336,600 hectares in 2012 to 13.2268 million hectares in 2027 and peaking at 17.13 million hectares in 2017.
From the ecological footprint and ecological carrying capacity of the Chengdu-Chongqing economic circle from 2012 to 2027, the contribution rate of the ecological footprint was as follows: grassland>construction land>water area>farmland>forest. The results showed that grassland and construction land were the main sources of the ecological footprint in the study area, so the change in the ecological footprint was mainly affected by grassland and construction land. This indicated that human activities had a large impact on the ecological footprint. The statistical results showed that the ecological carrying capacity of forest and farmland was consistent with the overall trend in the ecological carrying capacity in the study area. Therefore, the change in ecological carrying capacity was mainly affected by farmland and forest, indicating that cultivated land production activities and corresponding forest protection measures greatly impacted the ecological carrying capacity.
Spatial Change Analysis of Ecological Footprint and Ecological Carrying Capacity
The distribution of the ecological footprint and ecological carrying capacity of the Chengdu-Chongqing economic circle from 2012 to 2027 is displayed in Fig. 5 and Fig. 6 hierarchically. The regions with a large ecological footprint from 2012–2027 were distributed across the whole study area, mainly in the northwest and southeast. This was related to the study area’s development status and land cover. A large amount of construction land was distributed in the northwest and southeast of the study area and was concentrated in economically developed areas such as Chengdu and Chongqing. Therefore, these regions will result in ecosystem damage, resulting in a high ecological footprint within the region and increasing the ecological footprint of the whole study area. Although the development of Ya’an City is relatively slow, the development intensity is increasing, resulting in damage to the local ecosystem and a high ecological footprint.
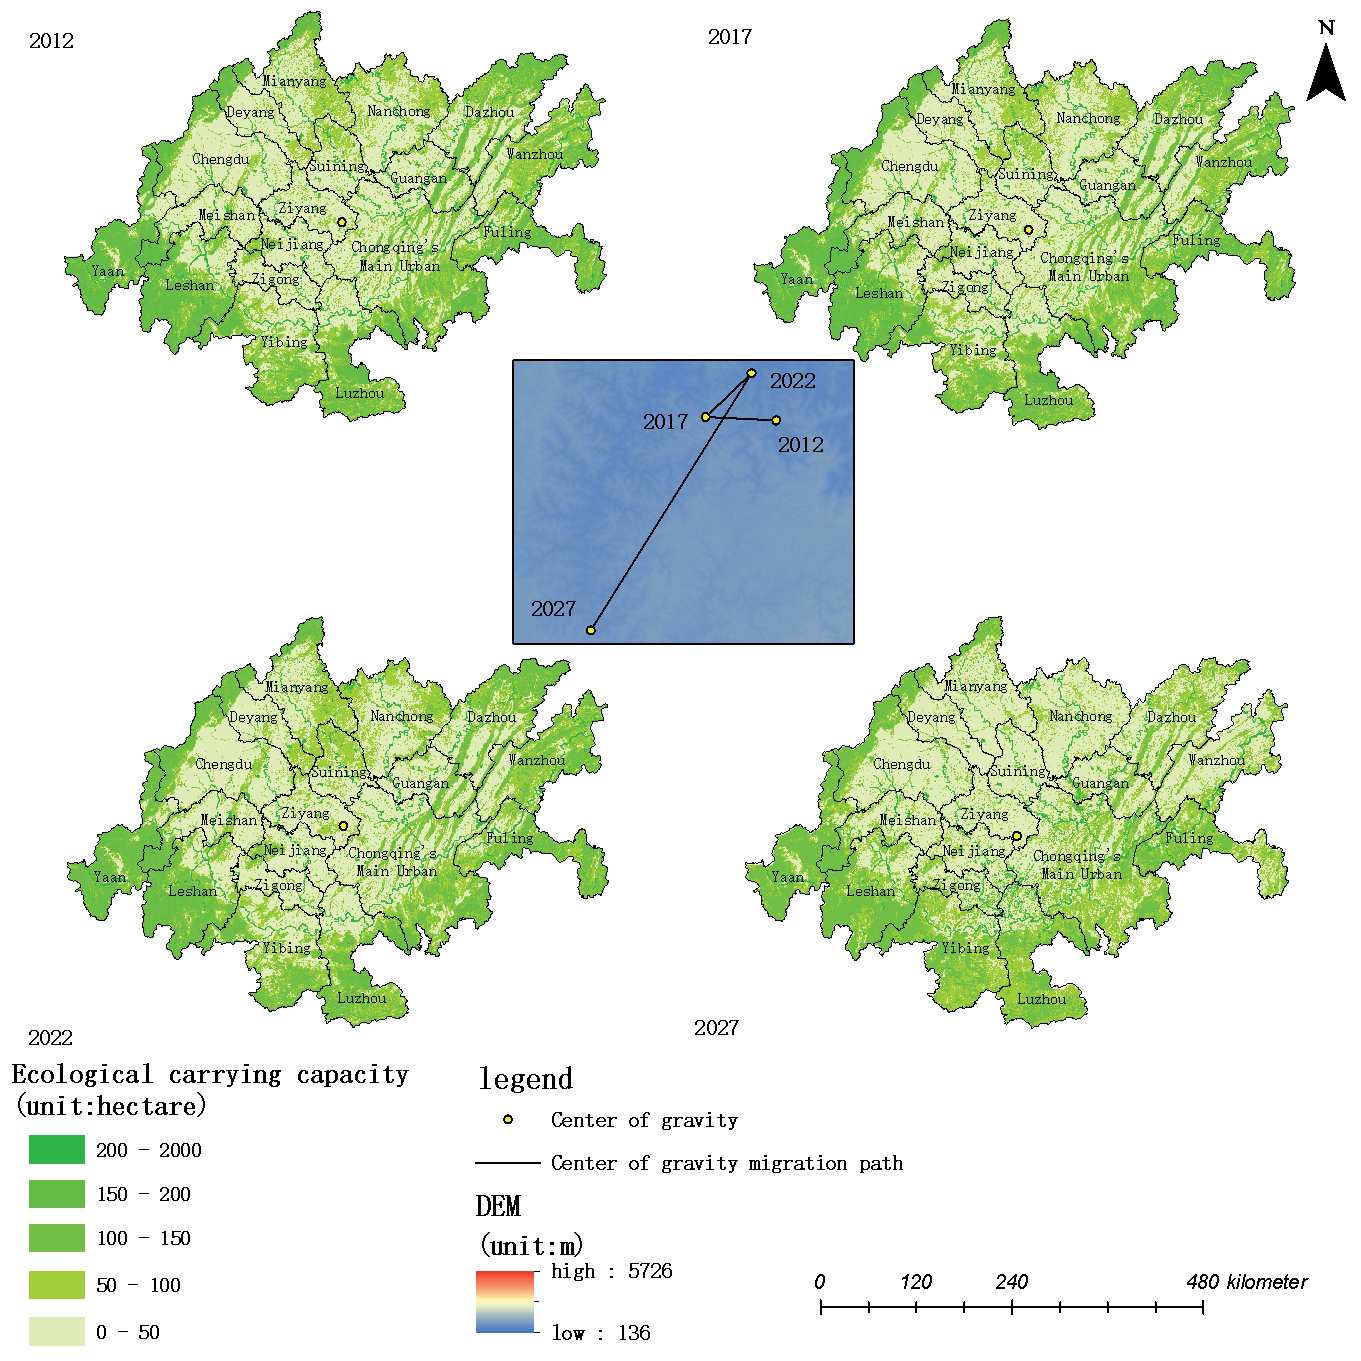
From 2012 to 2027, the ecological carrying capacity of the western region was higher, and that of the central and northern regions was lower. There are many forests and grasslands around the margins of the study area, which can provide a degree of self-maintenance and regulation ability for the ecosystem of the study area. There is also much farmland and construction land in the central region of the study area, and the production activities on farmland and human activities on construction land will damage the ecosystem. Therefore, the ecological carrying capacity of the marginal regions was higher than that of the central region. From 2012 to 2027, Yaan, Leshan, Yibin, and Luzhou in the fringe areas of the Chengdu-Chongqing economic circle had higher ecological carrying capacity because of their good ecological environment. The economic development of the central region has been rapid, and it contains a large amount of construction land and farmland. Hence, the ecological carrying capacity of Chengdu, Mianyang, Neijiang, Nanchong, Guang’an, and other places was relatively low. Although the economic development of Chongqing in the eastern part of the Chengdu-Chongqing economic circle has been rapid, the ESV in the eastern part of the Chengdu-Chongqing economic circle was also relatively high due to the impact of its land cover.
Fig. 5.
Spatial distribution of EF in the Chengdu Chongqing Economic Circle and the Center of Gravity Migration Route.
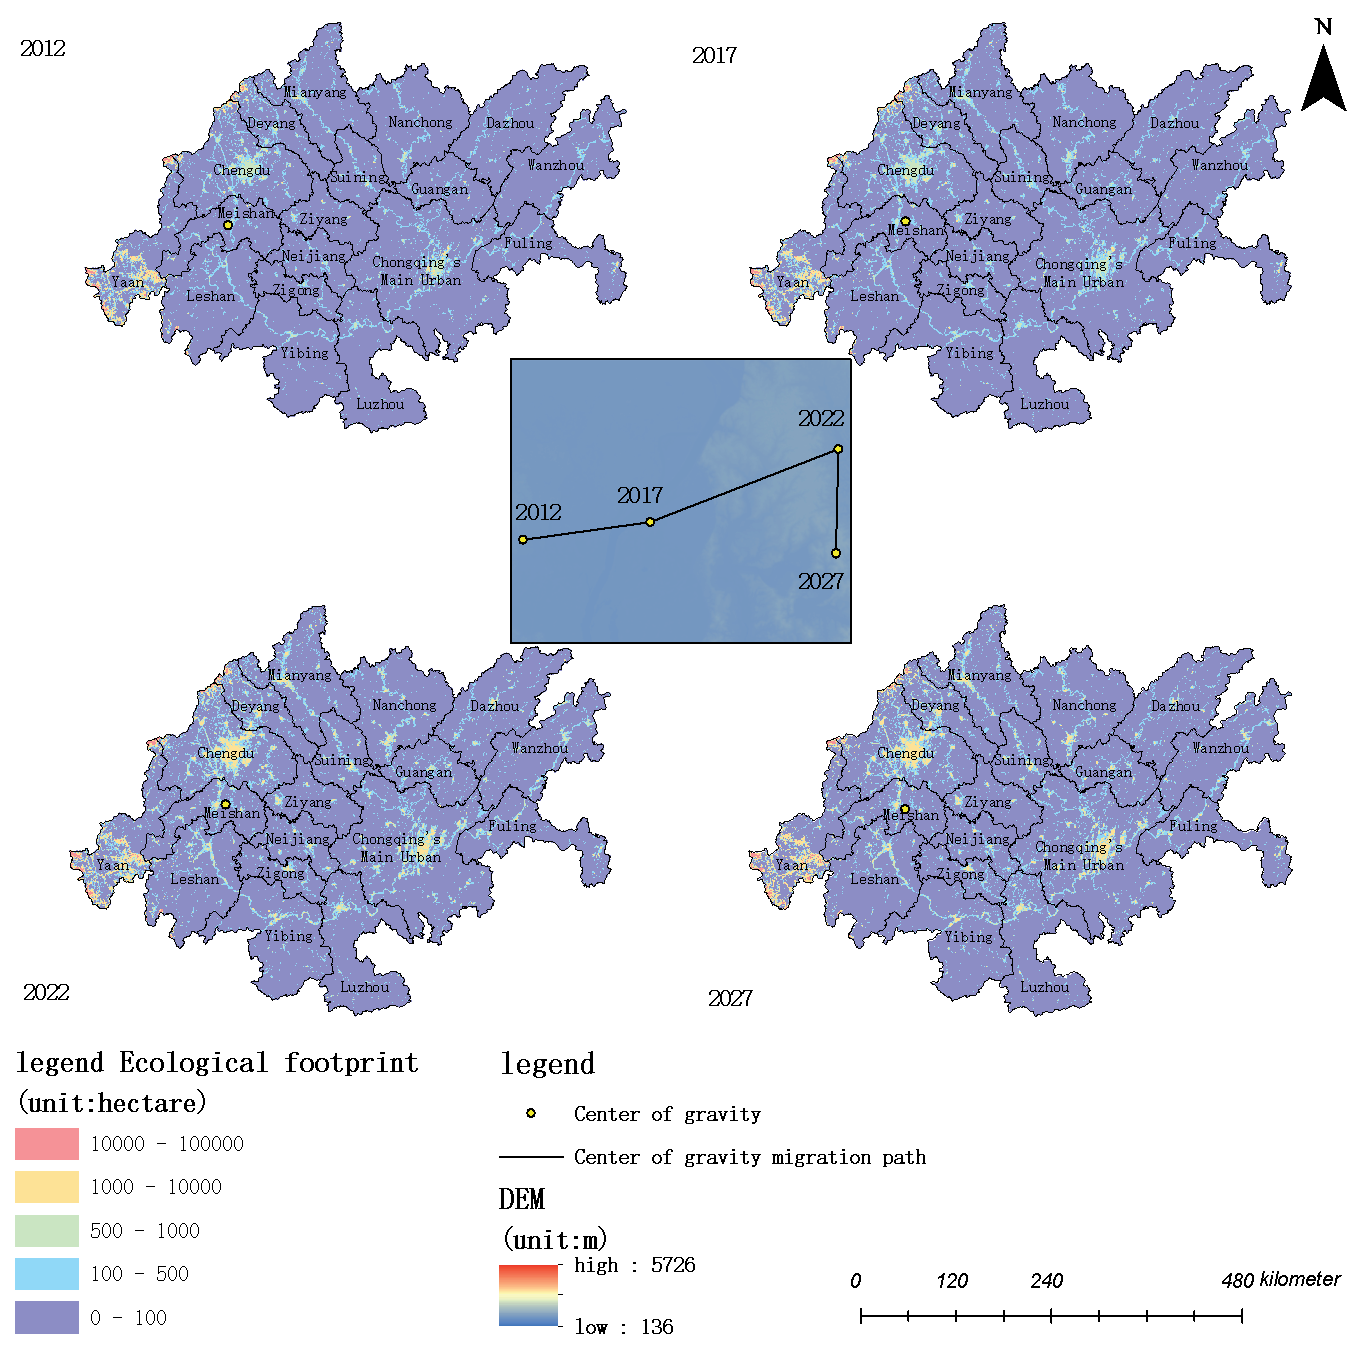
Standard deviational ellipse analysis was carried out on the ecological footprint and ecological carrying capacity of the Chengdu-Chongqing economic circle to obtain the directional distribution characteristics of the ecological footprint and ecological carrying capacity of the study area (Fig. 5 and Fig. 6). The results showed that from 2012 to 2022, the center of gravity of the ecological footprint of the Chengdu-Chongqing economic circle shifted to the northeast and upwards. From 2022 to 2027, the center of gravity of the ecological footprint of the Chengdu-Chongqing economic circle shifted to the southwest, showing a downward trend. From 2012 to 2027, the center of gravity of the ecological footprint in the study area was in Meishan City, west of the Chengdu-Chongqing economic circle. There was no significant change in the elliptical shape standard deviation from 2012 to 2027, indicating no significant change in the expansion intensity or cohesion of the ecological footprint of the Chengdu-Chongqing economic circle. This indicated that the demand and consumption of natural resources in the central region of the research area increased from 2012 to 2027, and the development center moved from the outside to the inside, consistent with the development concept and development trend of the Chengdu-Chongqing economic circle.
From 2012 to 2022, the center of gravity of the migration of the ecological carrying capacity of the Chengdu-Chongqing economic circle shifted to the northwest and then to the northeast, showing an upward trend. From 2022 to 2027, the center of gravity of the ecological carrying capacity of the Chengdu-Chongqing economic circle shifted to the southwest, showing a downward trend. From 2012 to 2022, there was no significant change in the standard deviational elliptical shape, indicating no significant change in the expansion intensity and cohesion of the ecological carrying capacity of the Chengdu-Chongqing economic circle. In 2027, the plotted standard deviational ellipse shifted to the southeast, and the area decreased significantly, indicating that the expansion intensity of the ecological carrying capacity in the study area had weakened and the cohesion was strong. The decrease in the standard deviational ellipse area implied that the ecosystem’s ability to provide resources and services in the study area weakened from 2012-2027, and the direction of the standard deviational ellipse indicated that the ecological carrying capacity of the central region of the study area increased. This reflected some contraction of the ecosystem’s supporting capacity.
Fig. 6.
Spatial distribution of EC in the Chengdu Chongqing Economic Circle and the Center of Gravity Migration Route.
The ecological footprint and ecological carrying capacity of the Chengdu-Chongqing economic circle were analyzed, and the spatial aggregation degree of ESV was divided into, from high to low, cold spot areas, sub-cold spot areas, transition areas, sub-hot spot areas, and hot spot areas (Fig. 7).
Fig. 7.
a) Analysis of EC Hotspots in the Chengdu Chongqing Economic Circle and b) Analysis of EC Hotspots in the Chengdu Chongqing Economic Circle.
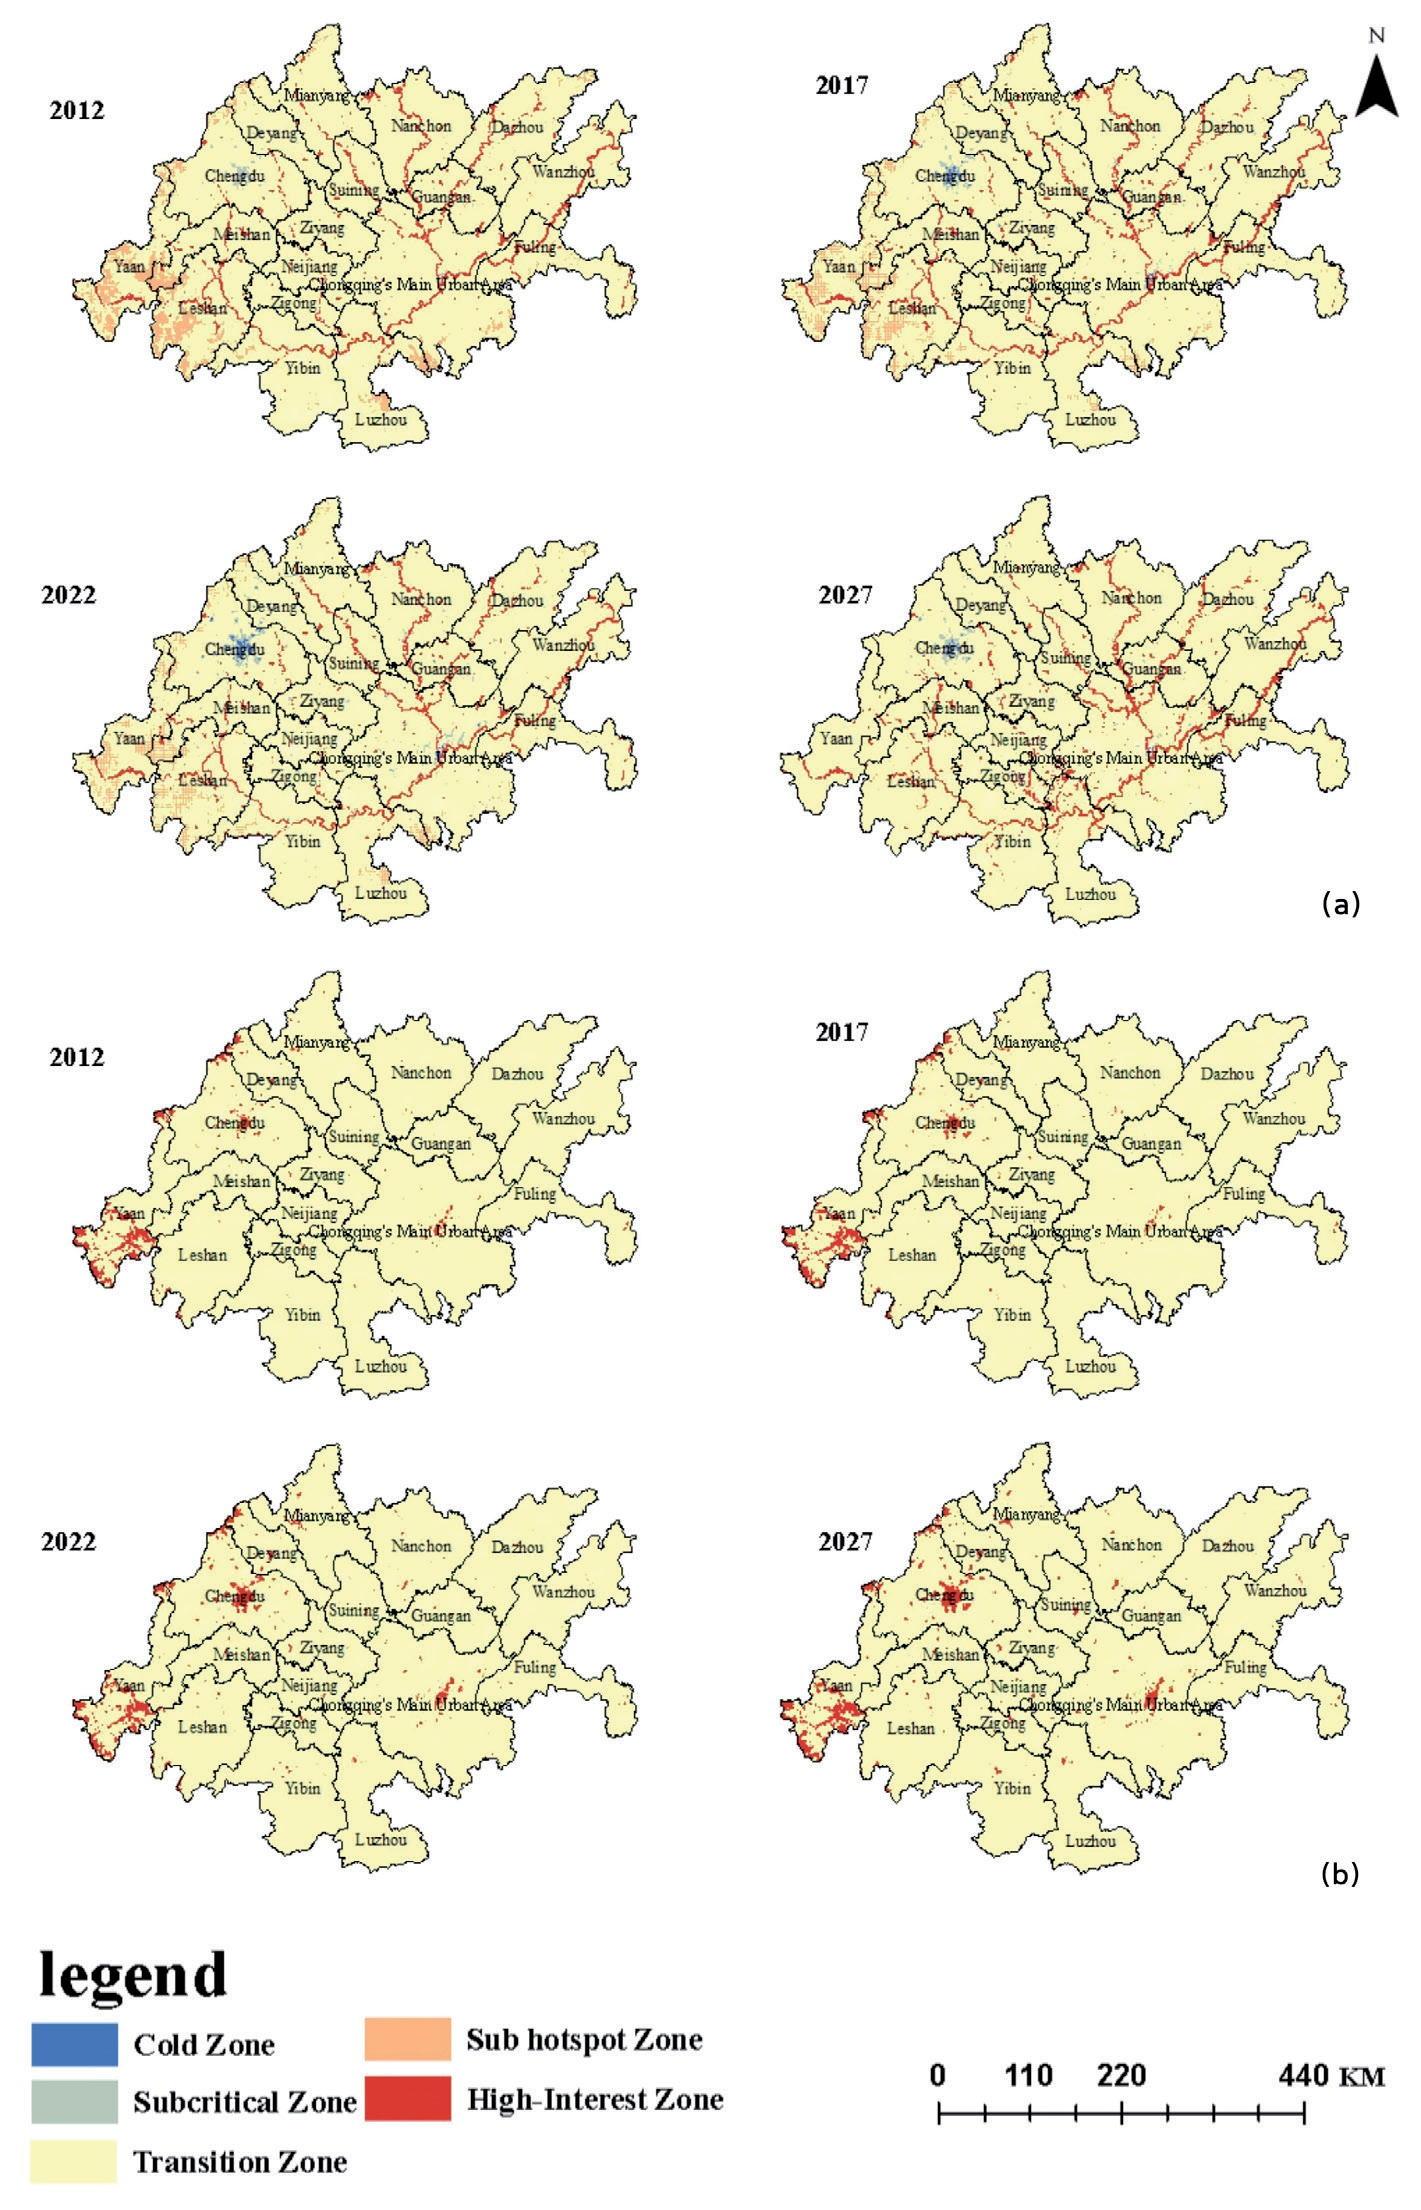
The statistical analysis of the classification data is shown in Table 3. The results showed that most of the ecological footprint hot spots were concentrated in the forest and grassland areas in the western part of the study area. There were no cold spots in the study area. From 2012 to 2027, with the increase in construction land area in the Chengdu-Chongqing economic circle, the transition area around construction land was transformed into hot spot areas and sub-hot spot areas. This hot spot distribution trend was mainly due to the importance of protecting the ecological environment in the Chengdu-Chongqing economic circle development strategy. As the central city of the Chengdu-Chongqing economic circle, economic development has led to a concentrated increase in the ecological footprint of the research area. Therefore, it is necessary to focus on protecting the ecological environment and constructing an ecological civilization in conjunction with city development.
In terms of ecological carrying capacity hot spots, the distribution of hot spots in the study area was relatively scattered and mainly related to the distribution of water in the study area. The sub-hot spots from 2012 to 2022 were distributed in the forest and grassland areas in the western part of the study area. From 2022 to 2027, the sub-hot spot areas in the west of the study area transformed into transition areas. The distribution of cold spots in the study area was relatively concentrated, mainly in the construction land accumulation area in the northwest. Additionally, with the increase in construction land area in the Chengdu-Chongqing economic circle from 2012 to 2027, the sub-cold spot areas and transition areas around the construction land from 2012 to 2022 converted to cold spot areas and sub-cold spot areas, respectively. From 2022 to 2027, the proportion of cold spot areas and sub-cold spot areas increased, but the cold zone in the northwest construction land accumulation area changed into a transition zone. The distribution and transformation trend of hot and cold spots indicated that the impact of urban development on the ecosystem was increasing with the city’s expansion; however, implementing the sustainable development policy has ensured that the study area has retained a good ecological condition.
Temporal and Spatial Analysis of Ecological Surplus and Ecological Deficit
The spatial distribution of ecological surplus and ecological deficit in the Chengdu-Chongqing economic circle from 2012 to 2027 was obtained (Fig. 8 and Fig. 9). The results showed that from 2012 to 2027, the ecological deficit in the whole region was mainly concentrated in the northwest and southeast, which was related to the land cover and development status of these regions. As central cities of the Chengdu-Chongqing economic circle, Chengdu City in the northwest and Chongqing City in the southeast region have developed rapidly. Because of their high human activity, these areas were in a state of ecological deficit. Additionally, with the expansion of construction land, some of the ecological surplus was transformed into an ecological deficit. Due to the relatively slow development and good ecological environment in the remaining regions, most regions were in a state of ecological surplus.
Overall, the ecological status of the Chengdu-Chongqing economic circle was mostly in the state of sustainable development. Still, the rapid development of the two central cities resulted in their state of ecological deficit. With the implementation of the development strategy wherein central cities drive the development of small and medium-sized cities in the Chengdu-Chongqing economic circle, the ecological deficit area of the whole region constantly expanded with the expansion of cities, indicating that development across the whole region has increased the consumption of natural resources and the service capacity of the ecosystem has declined.
ESV in the Chengdu-Chongqing Economic Circle
Based on a comparative analysis of the above results, the ESV of the Chengdu-Chongqing economic circle showed a depression distribution pattern that was high in the west and low in the middle. The ESV first decreased, then increased, then decreased from 2012 to 2027, showing a trend of increasing ring-shaped fluctuation. From 2012 to 2027, it showed a fluctuating increasing trend, from 346.072 billion yuan in 2012 to 414.825 billion yuan in 2027, peaking at 447.291 billion yuan in 2022. A comparison of the ESV contribution rate revealed that areas of farmland, forest, and water were the main sources of ESV in the Chengdu-Chongqing economic circle. Zou [29] studied the cross-sensitivity of land use transformation and ecological service value in the Chengdu-Chongqing economic circle from 2000 to 2018, finding that the ESV in this region first decreased, then increased, then decreased. The ESVs in the study area in 2000, 2005, 2010, 2015, and 2018 were 491.318 billion yuan, 488.959 billion yuan, 492.119 billion yuan, 4900.55 billion yuan, and 480.8 billion yuan, respectively, showing an overall downward trend and a bowl-shaped distribution pattern of “outer high and middle-low”. This result shows high consistency with our study’s trend and spatial distribution but exhibits certain differences in specific numerical values. The consistency indicates that the ecological service value of the region presents a bowl-shaped distribution pattern of “high outside and low inside” in time and space, and some areas have low service value, indicating that the ecological change trend of the region is certain. The difference in numerical values is due to the different methods used to evaluate the value of ecosystem services, resulting in differences in the representation of the resulting values. Shao conducted research and analysis on the spatiotemporal evolution and driving factors of ecosystem services in the Chengdu-Chongqing urban agglomeration based on the GWR model and found that the total amount of ecosystem services in the Chengdu-Chongqing urban agglomeration showed a deteriorating trend [30]. The ESVs of the Chengdu-Chongqing urban agglomeration from 1995 to 2015 (5 periods in 1995, 2000, 2005, 2010, and 2015) were 347.53 billion yuan, 346.408 billion yuan, 345.243 billion yuan, 343.802 billion yuan, and 342.392 billion yuan, respectively. In terms of spatial distribution, there are significant regional characteristics in the central areas of Chengdu and Chongqing, as well as the Jinyun Zhongliang Mountain Range. The above results are highly consistent with the results of this article in terms of the trend and spatial distribution of the total value of ecosystem services in the study area. The results of the present study were similar. However, the analysis revealed that the spatial supply of ESV in the Chengdu-Chongqing economic circle became more concentrated, indicating that the development of natural resources in the study area had concentrated. In the hot spot analysis, by referring to relevant development policies of the Chengdu-Chongqing economic circle, it was found that the change in hot spot and cold spot areas mainly depended on the degree of development and land type changes in the study area. Li [31] and Fan [32] conducted a detailed discussion on the relationship between land use, land cover, and ESV and found that human activities and socio-economic development have become the main driving factors for the decline in ESV in Yuxi City. In summary, the supply capacity of ESV is not fixed and is affected by many factors, such as human activity, climate change, land use changes, etc. Human activity can destroy and degrade ecosystems, thereby reducing their ability to provide services.
A series of measures are required to maintain and enhance the supply capacity of eESV. These include rational land use planning, protection of biodiversity, reducing pollution emissions, strengthening ecological restoration, etc.; these will help achieve sustainable ecosystem development whilst improving human well-being. At the same time, evaluating and monitoring the value of ecosystem services is also very important to increase understanding of changes in their supply capacity and provide a scientific basis for making relevant policies and management decisions.
Ecological Footprint and Ecological Carrying Capacity of the Chengdu-Chongqing Economic Circle
From the perspective of the total ecological footprint, the ecological footprint of the study area first increased and then decreased, increasing from 17.7597 million hectares in 2012 to 25.4855 million hectares in 2022 and then decreasing to 24.1791 million hectares in 2027. Ecological footprint analysis of different land types within the research area revealed grassland and construction land to be the main sources of ecological footprint in the Chengdu-Chongqing economic circle. The trend in the ecological footprint of grassland was consistent with the overall ecological footprint. The ecological footprint of construction land increased continuously, indicating the increasing impact of human activity on the ecological environment. Xu evaluated the ecological security of the Yangtze River Economic Belt based on three-dimensional ecological footprints, from footprint breadth to footprint depth [33]. In terms of footprint breadth, the regional average in the Chengdu-Chongqing twin city area increased from 0.250 hm2/person in 2000 to 0.418 hm2/person in 2020, an overall increase of 67.2%. In terms of footprint depth, there is a slight fluctuation in the Chengdu-Chongqing twin city area, and the overall trend is upward. Chongqing has a relatively large footprint depth, showing an upward-downward trend, reaching a maximum value of 5.152 hm2/person in 2016, while the footprint depth in Sichuan Province has remained relatively stable. Present a spatial distribution pattern of high in the middle and low on the four sides in terms of spatial distribution. Liu found a significant and increasingly negative correlation between the degree of land use and habitat quality in the Chengdu-Chongqing area [34]. The land use change from 2000 to 2010 was mainly the conversion of cultivated land to construction land, accounting for 70.47% of the total area of cultivated land transferred out. The transferred construction land was mainly distributed in Chengdu, Deyang, Mianyang, and Nanchong in Sichuan, as well as the central urban area and Nanchuan in Chongqing. Areas with lower habitat quality (average habitat quality index of 0.35) are mainly distributed in the Chengdu metropolitan area and the central urban area of Chongqing, areas with frequent human activities, a relatively developed economy, and a high degree of urban development. This was consistent with the temporal and spatial changes in the ecological footprint of the study area, indicating that the impact of human exploitation of the natural environment on the ecosystem was increasing.
The analysis showed that the spatial and temporal distribution of ecological carrying capacity and ESV in the study area were generally consistent, showing a depression distribution pattern of high in the west and low in the middle. The area decreased from 16.3366 million hectares in 2012 to 13.2268 million hectares in 2027, reaching a peak of 17.13 million hectares in 2017. The total amount decreased by 19.03%. Xiao analyzed the ecological carrying capacity of the Chengdu-Chongqing Economic Circle from 2006 to 2015 in terms of ecological resilience, ecological support, and ecological pressure and found that the ecological carrying capacity of the Chengdu-Chongqing Economic Circle showed an upward trend during the research period [35]. This study shows that the spatial and temporal distribution of ecological carrying capacity and ESV is generally consistent, with higher values in the west and lower values in the east, mainly from cultivated land, forests, and water bodies. Chengdu, Mianyang, and Chongqing have better ecological carrying capacity, while most other areas have lower capacity. Xiao’s research found that the ecological carrying capacity of the Chengdu-Chongqing Economic Circle showed an upward trend during the study period, with some areas having good ecological carrying capacity, which is consistent with the regional characteristics and main sources of ecological carrying capacity in this study. Among them, Chengdu, Mianyang, and Chongqing have good ecological carrying capacity, while most other areas have low ecological carrying capacity, accounting for 56.25%. Farmland, forest, and water areas were the main sources of ecological carrying capacity, which indicated that these three land types strongly promoted the self-recovery and self-regulation ability of the Chengdu-Chongqing economic circle and were important elements for maintaining sustainable development. The supply of ecological services in the Chengdu-Chongqing economic circle ecosystem was consistent with the ecological capacity. The center of the ecological footprint was in Meishan City, which is close to Chengdu City, indicating that the demand and consumption of resources in the central area of the Chengdu-Chongqing economic circle were constantly increasing.
The spatiotemporal changes in ecological footprint and ecological carrying capacity reflect the impact of socio-economic factors, natural factors, and related policies on ecology. Firstly, two important socio-economic factors, population size and economic development level, have different impacts on the spatiotemporal changes of ecological footprint and ecological carrying capacity. Population growth has led to increased resource demand, accelerated resource consumption, and increased demand for infrastructure construction in the Chengdu-Chongqing economic circle, resulting in an increase in ecological footprint. The improvement of the economic development level leads to an increase in consumption capacity. During the rising economic development level, industry development will lead to an increase in ecological footprint. On the contrary, if economic development is used for environmental protection industries and for improving resource utilization efficiency, the improvement of the economic development level will enhance the ecological carrying capacity of the region.
Secondly, natural factors will also become important driving factors for the spatiotemporal changes in ecological footprint and ecological carrying capacity. Natural factors such as precipitation and temperature changes can affect ecosystem productivity. Drought can lead to a decrease in land productivity and a reduction in ecological carrying capacity. Land use change, as a natural factor, also affects the region’s ecological footprint and carrying capacity. The conversion of arable land to construction land may lead to a weakening of ecological carrying capacity and an increase in ecological footprint. The change in land use has altered the composition of ecosystem service functions, affecting ecological footprint and ecological carrying capacity.
Finally, relevant regional development policies will impact changes in ecological carrying capacity and ecological footprint. The government’s resource management and ecological protection policies are crucial. Different policies have different impacts. Prohibiting logging and restricting fishing are important measures for the government to enhance ecological carrying capacity in the development process. At the same time, policies that encourage technological innovation aim to achieve the efficient use of resources and reduce ecological footprints by promoting technological innovation.
In summary, the spatiotemporal changes in ecological footprint and ecological carrying capacity do not depend on a single factor but are the result of the coordination, mutual influence, and joint action of multiple factors. The ecological status and social and economic development of the Chengdu-Chongqing economic circle were found to be in a state of sustainable development, with the development of other small and medium-sized cities driven outward by the two development centers of Chengdu and Chongqing. This formed a development pattern of urban agglomeration with distinctive characteristics, a reasonable layout, and sustainable development.
Ecological Deficit and Ecological Surplus in the Chengdu-Chongqing Economic Circle
The ecological surplus/deficit distribution in the Chengdu-Chongqing economic circle showed distinct characteristics. In the period 2012-2027, the ecological deficit was mainly concentrated in the northwest and southeast regions. Wang conducted a spatiotemporal study on the ecological space and ecological carrying capacity of five mega city clusters in China from 1990 to 2020 [36]. They found that, from the perspective of the comprehensive carrying capacity of ecological space, about 78.1% of the 96 urban areas in the mega city clusters were in an overloaded or severely overloaded state. Among them, 56.3% of the cities in the Chengdu-Chongqing economic circle are severely overloaded, mainly distributed in the central and western parts of Chengdu-Chongqing. In the northern part of Chengdu-Chongqing, the overloading situation has worsened. This was closely related to the status of local land cover and development. In the northwest and southeast regions, where the major cities of Chengdu and Chongqing are located, the economic development momentum was extremely rapid, and human activity was frequent. The presence of a large amount of construction land led to the huge consumption of various resources in these two regions. The remaining regions were mostly in a state of ecological surplus due to their relatively slow development, low economic and human activity intensity, and relatively low resource consumption. Research has shown that the ecological deficit of the Chengdu-Chongqing economic circle is mainly concentrated in the northwest and southeast regions, where rapid urban development and frequent human activities have led to significant resource consumption. Policymakers and planners should reasonably control construction land’s scale and expansion speed, especially in big cities such as Chengdu and Chongqing and surrounding areas, to avoid ecological pressure caused by excessive expansion. Secondly, protecting ecological land: Given that arable land, forests, and water bodies are the main sources of ESV and ecological carrying capacity, it is necessary to strengthen the protection of this ecological land. Set ecological protection red lines, strictly limit the development and occupation of arable land, forests, and water bodies, and ensure that their ecological functions are maintained and utilized. Ecological deficit has a negative impact on regional sustainable development. From the perspective of resource supply, a long-term ecological deficit indicates excessive consumption of regional resources, such as excessive logging of forest resources and overexploitation of mineral resources, which will lead to the gradual scarcity of regional resources. In terms of ecological protection, ecological deficits can damage the service functions of ecosystems, such as excessive land development, leading to decreased soil fertility and vegetation coverage, which in turn can cause problems such as soil erosion. Therefore, the state of the ecological deficit has become a potential risk of ecosystem collapse, threatening human survival and development and disrupting the balance of sustainable development.
Ecological surplus promotes regional sustainable development. It indicates that the regional ecosystem is relatively stable and healthy, capable of providing sufficient resources and good ecological services. From the perspective of resource supply, regions with ecological surplus have sufficient resources to meet their production and living needs and can better respond to sudden environmental events. Adequate resources ensure the ecological security of the region. Ecological surplus also provides a foundation for sustainable economic development, supporting the development of sustainable industries such as ecological and tourism industries and promoting long-term prosperity in the region. Promoting relevant policies for the construction of the Chengdu-Chongqing economic circle has resulted in the rapid development speed of the two central cities. This has greatly increased the demand for and consumption of resources, resulting in a state of ecological deficit. Additionally, according to the policy model of central cities driving the development of small and medium-sized cities, the ecological deficit area has continued to spread outwards with the continuous expansion of the city scale. As a result, the ecological condition of the whole region has deteriorated.
To further optimize the planning and layout of land use in the Chengdu-Chongqing economic circle, reasonable control of construction land’s scale and expansion speed is required. At the same time, increased investment and efforts in ecological construction will actively promote the concept of green development and related technologies. By increasing the effective utilization of resources and promoting the implementation of relevant ecological protection policies, efforts should be made to slow the speed of ecological deterioration to ensure coordinated and sustainable economic and ecological development in the Chengdu-Chongqing economic circle.
Comparison with Traditional Footprint Model
Compared with the traditional ecological footprint model, this study’s novel ecological footprint model has the following advantages. First, based on the ecological footprint model of ESV, the diversity of ecosystem services was factored in, and the value of ecosystem services was quantified from the perspective of ecosystem services such as supply services, regulation services, support services, and cultural services. The introduction of equilibrium and production factors through the value of ecosystem services improved the accuracy of the novel ecological footprint model. Second, in constructing the ecological footprint model in this study, parameters can be adjusted according to local crop productivity, land cover, and other conditions; this makes the model more universal and enables the ecological status of different regions to be compared using one index. The ecological footprint model based on ESV can better reveal the mobility of ESVe and the relationship between social and economic development and ESV. Furthermore, the ecological footprint model based on ESV can reflect human consumption of ESV from the perspective of the ecological footprint and ecological carrying capacity. It also reflects the amount of productive land area occupied by human activity, providing a reference for the assessment of the ecological status of a certain region.
However, this ecological model – which was based on ESV – did not specifically set construction land parameters. The relevant construction land parameters could not be accurately obtained by the approach adopted in the present study, and the evaluation of the equilibrium factor and yield factor of construction land was determined to be the same as the relevant factors for farmland. Furthermore, the ESV of construction land was not discussed. Therefore, the model introduced in this paper cannot accurately calculate the ESV of construction land and would yield inaccurate results for this land use type.
The land forecasting data also introduced uncertainty to the calculation results. Changes in land use data and economic statistical data are affected by many factors, such as human activities and the natural environment, so this study could not completely and accurately predict the relevant data. It is hoped that future studies will introduce more accurate and comprehensive data and data prediction models to further improve model accuracy.
The Limitations of the Equivalence Factor Approach
The equivalent factor method used in this article calculates the value of ecosystem services by setting a unified equivalent factor, which, to some extent, simplifies the functions of ecosystem services and makes it difficult to reflect their complex relationships. Although multiple ecosystem service functions have been considered, the synergistic effects and implementation mechanisms between various functions in the actual ecosystem are extremely complex. Taking forest ecosystems as an example, their vegetation not only provides food and raw materials but also plays a synergistic role in regulating climate, conserving water sources, and maintaining biodiversity. The equivalent factor method makes it difficult to express these complex relationships accurately and can only roughly calculate the ESV of forests.
Secondly, the equivalent factor method ignores the dynamic changes in functionality. The ecosystem service functions change with time and environmental changes. Still, the equivalent factor method is based on relatively fixed equivalent factors, and it is difficult to reflect this change. For example, with climate change and environmental changes in some areas, the water conservation and hydrological regulation functions of various species in the ecosystem in that region have been enhanced or weakened. However, the equivalent factor method may not be able to adjust the calculation in a timely manner, thus not accurately reflecting the actual changes in ESV, resulting in a lag in the assessment of ESV in the region compared to the actual situation, which affects the accurate understanding and decision-making of ecosystem changes. Moreover, the equivalent factor method adopts a unified standard approach, which cannot accurately reflect regional specificity and affects the accurate assessment of ESVs in different regions, affecting the scientificity of land use planning and ecological protection decisions.
Finally, the equivalent factor method is difficult to adapt to new demands and problems. With the development of society, new ecological problems continue to emerge, and people’s demands for ecosystem services are becoming increasingly diverse. For example, in the context of global climate change, the carbon sink function of ecosystems has received much attention, but the equivalent factor method has not yet been included in the carbon sink value assessment in a timely manner. In addition, for some emerging ecosystem service demands, such as ecotourism experiences, cultural ecological services, etc., the equivalent factor method lacks corresponding standards. It cannot comprehensively evaluate the value of ecosystems in meeting the diverse needs of modern society, which limits their effectiveness in ecological protection and sustainable development practices.
Conclusions
The following conclusions were drawn by constructing an ecological footprint model based on the ESV of the Chengdu-Chongqing economic circle from 2012 to 2027.
(1) The ESV of the Chengdu-Chongqing economic circle from 2012 to 2027 showed a fluctuating trend. From 2012 to 2017, the total ESV of the Chengdu-Chongqing economic circle decreased. From 2017 to 2022, the value of ecosystem services increased significantly due to development policies related to the Chengdu-Chongqing economic circle. The total ESV of the Chengdu-Chongqing economic circle decreased from 2022 to 2027.
(2) From 2012 to 2027, the ecological footprint of the Chengdu-Chongqing economic circle increased and then decreased, peaking at 2,548.55 in 2022. The contribution rate of different regions to the ecological footprint of the Chengdu-Chongqing economic circle was as follows: grassland>construction land>water area>farmland>forest; thus, grassland and construction land had the greatest impact, which indicated that human activities had the most impact on the ecological footprint.
(3) From 2012 to 2027, the ecological carrying capacity first increased and then decreased, peaking at 17.13 million hectares in 2017. The trend in the ecological carrying capacity of forest and farmland was consistent with the overall ecological carrying capacity, so the change in ecological carrying capacity was mainly affected by farmland and forest. Therefore, human production activities and forest protection measures greatly impacted the ecological carrying capacity.
(4) From 2012 to 2027, the ecological deficit in the region was mainly concentrated in construction land in the main urban areas of Chengdu and Chongqing. With the expansion of construction land, the areas of ecological surplus will continue to be transformed into areas of ecological deficit. The center of the two cities will expand and gradually drive the development of other small and medium-sized cities in line with the development plan of the Chengdu-Chongqing economic circle.

