

Introduction
One of the most critical crises facing human society today is the global climate crisis brought on by greenhouse gas emissions. Carbon peaking and carbon neutrality have been acknowledged as critical strategic initiatives to address the world’s climatic concerns. In response, many countries have set aggressive carbon reduction targets, aiming for both carbon peaking and carbon neutrality. For example, the European Union and the United States have established their carbon neutrality goals for 2050, while China has committed to peaking its carbon emissions by 2030 and achieving carbon neutrality by 2060. These goals are crucial for global climate action and meeting the international agreements’ sustainable development targets. However, the path to achieving these goals varies across nations, reflecting economic, technological, and energy structure differences. China faces unique challenges in balancing its rapid economic growth with environmental sustainability. China is presently responsible for more than one-third of the world’s carbon emissions, making it one of the world’s largest consumers of energy and carbon emitters [1]. China’s efforts in energy conservation and emissions reduction are not only crucial for domestic environmental and ecological construction but also have profound implications for global climate action [2, 3].
From the perspective of ecological modernization theory, economic growth and environmental sustainability are not necessarily mutually exclusive. This theory suggests that modern societies can achieve economic development while addressing ecological concerns through technological innovation, regulatory frameworks, and environmental reforms. For China, adopting green technologies and promoting sustainable industries could be key strategies in reconciling its modernization goals with environmental imperatives [4]. Moreover, low-carbon theory emphasizes transitioning to an economy that minimizes carbon emissions through renewable energy, energy efficiency, and decarbonization of key industries. Xiong et al. [5] reviewed the current status of low-carbon building development and discussed challenges and potential improvements for the future. This work supports the idea that China can pursue higher living standards and technological advancements while reducing its carbon footprint by fostering low-carbon industries and investing in clean energy. Nonetheless, there is tension between China’s vision of a modern society by 2035, which includes higher living standards, economic prosperity, and technological advancement, and the critical need to reduce carbon emissions [6, 7]. The historical interdependence of population increases, economic development, and carbon emissions gives rise to this conflict, making it difficult to balance these three factors and environmental sustainability. Achieving the dual goals of carbon peaking and carbon neutrality will require China to not only make technological and industrial shifts but also adopt a more eco-centric approach to its future development plans.
The driving forces behind carbon emissions are often investigated using the Logarithmic Mean Divisia Index (LMDI). The LMDI decomposition model without residual terms was proposed by Sun et al. [8]. It is distinguished by perfect decomposition and consistent aggregation and precisely measures the relative contributions of predefined factors to changes in aggregate indicators. Earlier research predicted carbon emissions using the Kaya and the LMDI decomposition models [9-11]. Furthermore, the Kaya model has been employed to investigate the elements that propel carbon emissions. According to some academics, urbanization causes notable disparities in the economic development of urban and rural areas in developing nations, substantially affecting CO2 emissions. They suggested tweaks to the U-Kaya model and used three distinct urbanization policy modes to forecast China’s potential carbon emissions in 2020 [12].
However, the majority of the previously stated literature examines the factors impacting carbon emissions using the LMDI decomposition model or the Kaya model independently, without merging the two. Ortega and Mena [13] integrated the two models to investigate the variables that affected India’s carbon emissions from 1990 to 2016. They discovered that per capita income is the main contributor to the increase in CO2 emissions in India, and that India will reach its government target for 2020 in terms of emission intensity. Furthermore, Jiang et al. [14] utilized the Kaya-LMDI model to evaluate the driving forces behind CO2 emissions from non-residential electricity consumption in China from 2007 to 2016. The Kaya model and the LMDI decomposition model were merged by You et al. [15] to examine the interactions between CO2 emissions and residential central heating. Based on this, we use the Kaya model for carbon emissions accounting and combine the LMDI decomposition model to determine the primary factors affecting carbon emissions.
Regional carbon emissions are influenced by population, economy, and energy consumption. Logistic regression is one of the most commonly used statistical analyses in multivariate modeling [16]. It has been applied in various fields, such as predicting natural gas demand [17] and population [18]. The Autoregressive Integrated Moving Average Model (ARIMA), commonly used for economic forecasting, is a statistical model employed for time series analysis and forecasting. For instance, scholars have used the ARIMA model to forecast GDP in China for 2020-2021 [19] and in Jordan for 2020-2022 [20]. Additionally, Gu et al. [21] demonstrated that incorporating nighttime light remote sensing (NLT) as an exogenous variable improves the predictive performance of the ARIMA model when forecasting GDP. In terms of energy consumption prediction, some scholars use the least squares method to forecast energy consumption, such as predicting Turkey’s electricity consumption [22].
In carbon emission prediction, Zhou et al. [23] analyzed and forecasted China’s net carbon emissions from 2021 to 2035 using a TWSVR model based on AO. Hu and Man [24] proposed three carbon emission prediction models based on deep learning, combining model uncertainty, combination mechanisms, data-driven approaches, and intelligent algorithms. Qiao et al. [25] developed a decoupling model using BysO_LightGBM to study the relationship between urban development characteristics and carbon emissions. In comparison to the least squares method, an increasing number of scholars [26-28] have adopted LSTM for carbon emission prediction, achieving more significant results. Research on carbon emissions under multiple scenarios has become mainstream. For instance, Zhang et al. [29] simulated and estimated various carbon emission scenarios in China from 1991 to 2030. Bao et al. [30] utilized system dynamics to model and simulate three scenarios regarding the growth rate of China’s thermal power, carbon emission peak, and development trends, investigating the future economic and policy impacts on the thermal power industry. Li et al. [31] presented a novel carbon emission prediction method that combines meta-learning and differential long short-term memory networks, significantly improving accuracy and reducing overfitting when predicting industrial CO2 emissions. Zhong et al. [32] explored carbon reduction pathways for Chinese provinces by integrating regional development plans and carbon intensity convergence trends, using the IPCC’s shared socio-economic pathways to predict carbon peak values and timings, highlighting significant disparities in emissions influenced by economic levels and population. Qi & Yu [33] utilized a bottom-up national energy technology model to optimize China’s energy transformation pathway and highlight the electricity sector’s critical role in achieving these goals.
How China will reach its carbon neutrality objective is one of its major problems. Thus, it is essential to anticipate carbon emissions precisely. We must resolve the conflict between China’s objectives of 2030 peak carbon, 2035 modernization, 2050 Chinese-style modernization, and 2060 carbon neutrality and offer the government path planning suggestions to meet the anticipated goals. Previous studies on carbon emission forecasting have primarily focused on predicting multiple provinces or the entire country [22-25], and the broad regional scope of these studies has diminished their relevance for urban policy formulation. To address this gap, this study specifically examines a single city in eastern China (City X) and proposes concrete pathways to achieve dual carbon goals tailored to this urban context. We construct a predictive model for regional carbon emissions and their related factors (economy, population, energy consumption) in City X, considering the heterogeneity in population and economic development among cities. We thoroughly analyze how the energy structure and efficiency will develop under various scenarios to forecast the carbon emissions of X city and identify the goals and strategies for reaching the twin carbon goals (carbon peak and carbon neutrality). We set three scenarios to provide a basis for policy formulation to achieve the dual carbon goals.
This study builds upon previous research by integrating both the Kaya and Logarithmic Mean Divisia Index (LMDI) models with deep learning techniques, specifically the Long Short-Term Memory (LSTM) network. Unlike traditional models that rely on historical trends or linear relationships, the LSTM model captures complex temporal dependencies, making it particularly well-suited for long-term carbon emission forecasting. This theoretical advancement allows for more precise predictions, addressing limitations in single-method forecasting approaches. In the context of carbon emissions, combining the LSTM model with the Kaya and LMDI decomposition models represents a novel methodology that significantly enhances the accuracy of regional carbon accounting. By doing so, the study offers a robust analytical tool that challenges traditional methods, providing a more dynamic and comprehensive approach to carbon emission forecasting.
In practical terms, this study provides policymakers with actionable insights by simulating carbon emission pathways under three distinct scenarios: natural, baseline, and ambitious. These scenarios allow the government to assess different strategies for achieving carbon neutrality by 2060 and peaking goals by 2030. The study’s findings offer a detailed roadmap for decision-makers to promote industry upgrades, energy decarbonization, and the electrification of energy use. Additionally, the regional focus of the study ensures that the policy recommendations are tailored to the specific characteristics of City X, making them highly relevant for local governance. Thus, this research plays a critical role in guiding local governments to align their policies with national carbon goals, contributing to both regional and national efforts to achieve low-carbon development.
This study aligns closely with Ecological Modernization Theory, which emphasizes the possibility of decoupling economic growth from environmental degradation through technological innovation and policy reform. By integrating advanced prediction models such as Long Short-Term Memory (LSTM) with the Kaya and LMDI models, our research offers practical tools for predicting and managing carbon emissions while promoting economic modernization. The model developed in this study provides a framework for urban planners and policymakers to create effective carbon reduction strategies without compromising economic development, a key tenet of Ecological Modernization Theory. This research contributes to the theory by demonstrating how technological advancements in AI and machine learning can be applied to achieve sustainable development goals, offering empirical support to the idea that economic growth and environmental protection can be pursued simultaneously. In relation to Low-Carbon Development Theory, which advocates minimizing carbon emissions through sustainable energy use and innovation, our study offers a novel approach for cities and regions to achieve low-carbon goals. Combining the Kaya and LMDI models with LSTM improves carbon forecasting, providing a data-driven method to support low-carbon policies. The model proposed in this research provides actionable insights for urban planning, industrial upgrading, and energy transformation, all of which are essential elements in advancing low-carbon development. They offer a more nuanced approach to quantifying and managing carbon emissions, facilitating the practical implementation of low-carbon policies at both regional and national levels. Consequently, this study not only advances theoretical understanding but also has substantial implications for the practical transition to low-carbon economies.
Based on the above considerations, the innovations of this paper are outlined as follows: The theoretical innovations of this study lie in its contributions to Ecological Modernization Theory and Low-Carbon Development Theory. By integrating Long Short-Term Memory (LSTM) networks with the Kaya and LMDI decomposition models, the study demonstrates how technological advancements can decouple economic growth from environmental degradation, providing empirical support for the idea that economic development and carbon reduction can be pursued simultaneously in line with Ecological Modernization Theory. Furthermore, the research enriches Low-Carbon Development Theory by offering a more precise, data-driven approach to quantifying and managing carbon emissions, facilitating the practical implementation of low-carbon policies.
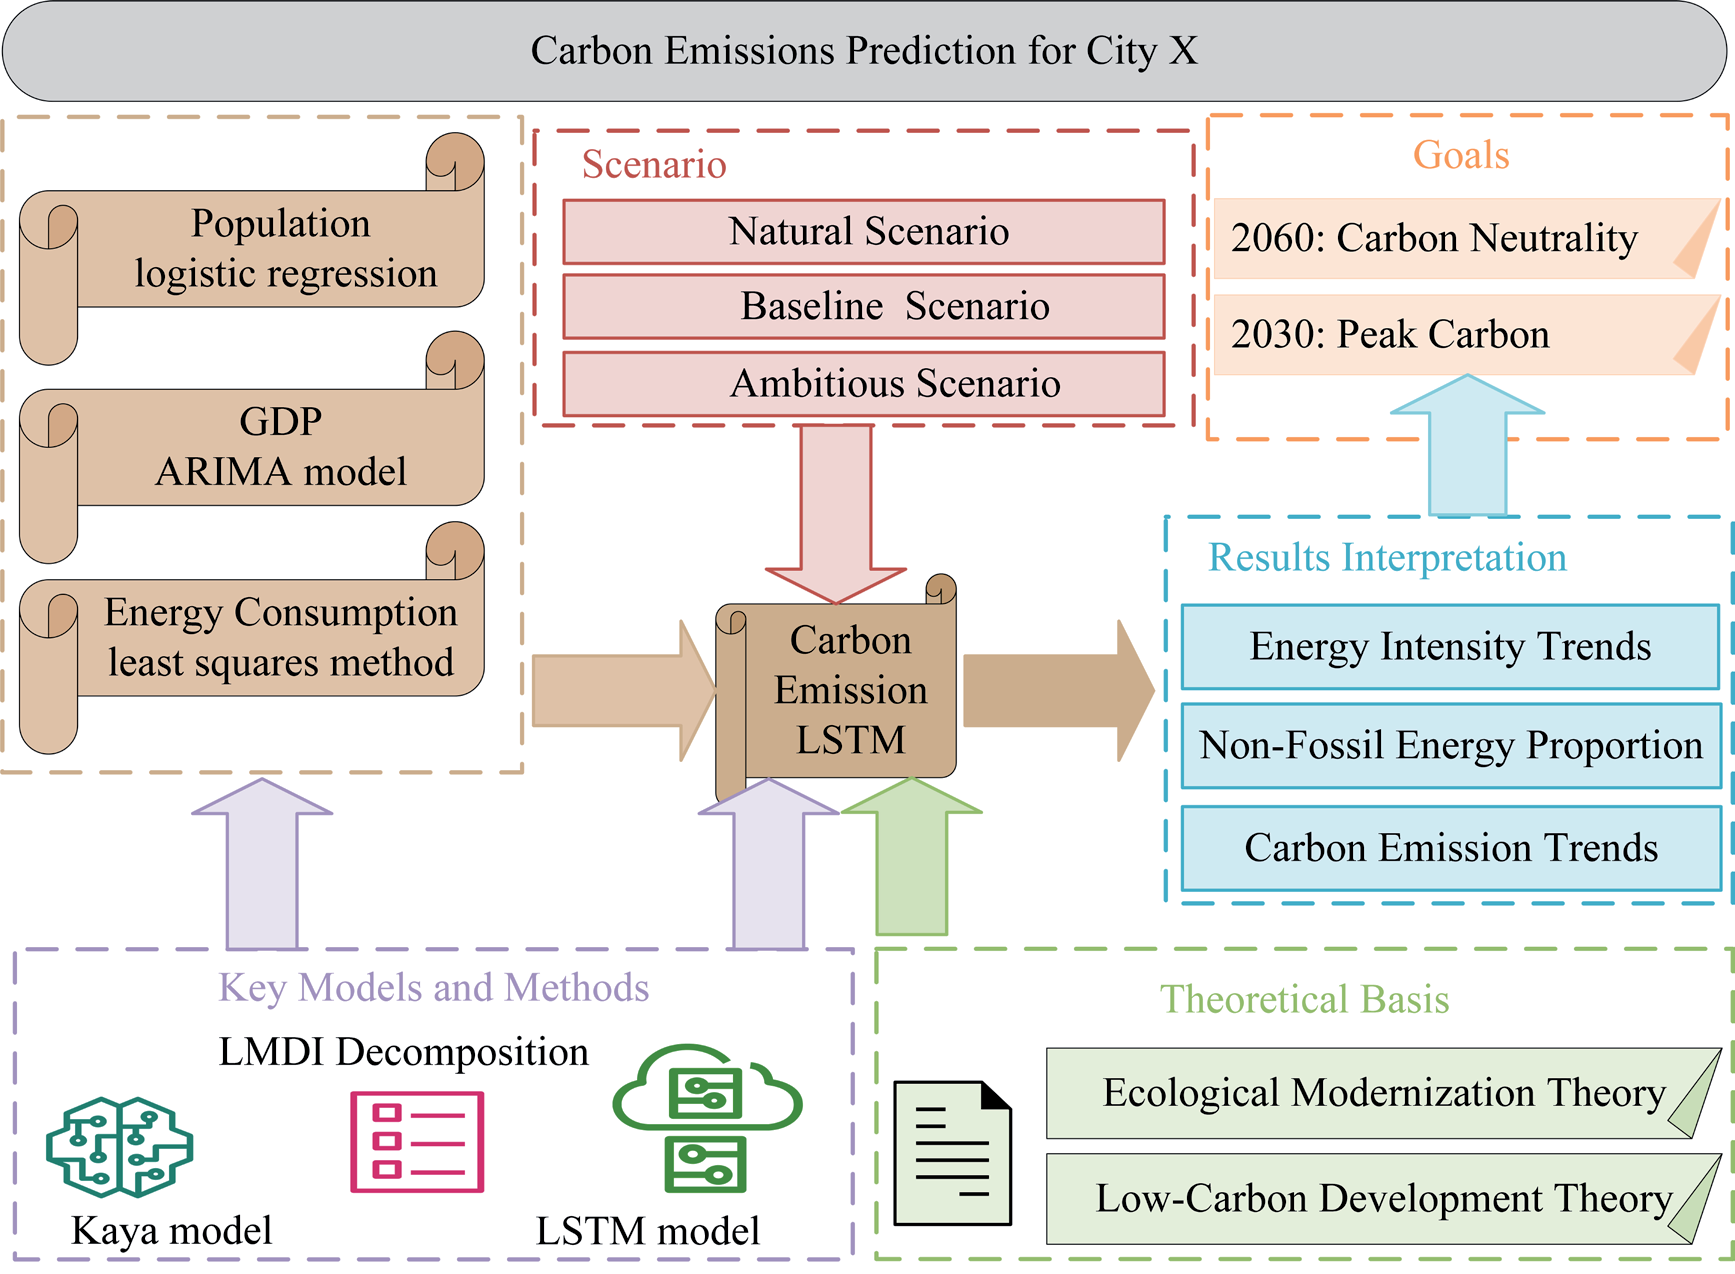
In terms of practical innovations, the study significantly improves carbon emission forecasting accuracy by combining LSTM with the Kaya and LMDI models, overcoming the limitations of relying on single-method predictions. This approach provides more precise tools for forecasting GDP, population growth, and various emission types. Additionally, the study offers three carbon emission scenarios (natural, baseline, and ambitious), giving policymakers flexible pathways to achieve carbon peaking and neutrality goals. The research also provides specific policy recommendations for City X on industry upgrading, energy decarbonization, and electrification, serving as a valuable resource for local governments aiming to align with national carbon targets. The framework for predicting carbon emissions in City X is shown in Fig. 1.
This paper is organized as follows: Section 2 provides an overview of carbon emission data sources, with a detailed analysis using the LMDI decomposition model. In Section 3, predictive models for carbon emissions in X city are constructed, incorporating population growth, economic development, and energy consumption. Section 4 introduces three dual carbon projection scenarios and discusses the implications of these scenarios for dual carbon path planning. Finally, Section 5 concludes with the paper’s key contributions and findings.
Materials and Methods
Data and Sources
Our data is sourced from the government’s official statistical bureau, covering 2010 to 2020. The compiled data is presented in Appendix IV. The data sources, the composition of indicators utilized in the subsequent analysis, and their symbolic meanings are summarized in Appendix I. In this section, we employ the Logarithmic Mean Divisia Index (LMDI) decomposition technique to determine the main drivers of carbon emissions as well as their respective contributions. Furthermore, we create scatter plots and analyze the variation trend of indicators using the Kaya model. In addition to the revisions made to the manuscript, the data referenced in the paper has been made publicly available for transparency and reproducibility. All relevant datasets included in Appendices I-IV have been uploaded to GitHub and can be accessed via the following link: https://github.com/HongWu-122/Prediction-and-Path-Planning-Framework.
Analysis of Carbon Emission Status
The primary factors influencing carbon emissions are identified using the LMDI. We assume a change in the rate of carbon emissions from the base year of 2010, denoted as v0 = 0. The carbon emission change rate is calculated as follows:
According to the data, the general pattern of carbon emissions over the 12th Five-Year Plan period indicated an initial increase followed by a fall. The carbon emission change rate was positive, indicating that the carbon emissions during the reporting period increased compared to the base year. Conversely, during the 13th Five-Year Plan period, the overall trend of carbon emissions was relatively stable. From 2016 to 2019, carbon emissions exceeded the base year, and the overall change rate tended to stabilize. However, in 2020, the carbon emission change rate was -1.51%, indicating that the carbon emissions were slightly lower than the base year of 2010.
Factors Influencing Carbon Emission and Their Contributions
We employ the LMDI method, which is the logarithmic form of the Divisia index method. This method is favored for its ease of modeling and ability to eliminate residuals while satisfying factors’ reversibility. This paper utilizes the Type I additive model to analyze the factors influencing carbon emissions. We decompose the change in carbon emissions between two consecutive years: the carbon emissions in period j (reporting period) are denoted as Cj, and the carbon emissions in the base period are denoted as Cj–1. It is important to note that the base period is dynamically changing, where the carbon emissions of the previous year serve as the base period. We calculate the differences in carbon emissions and the corresponding factors between two adjacent years. Since no data was available before 2010, we commenced the calculation of carbon emission differentials from 2011 onward. According to the additive form of LMDI, the difference in carbon emissions between the reporting and base periods is expressed as: Cj – Cj–1 = ∆C = ∆p + ∆g + ∆c + ∆e. The difference ∆p in population scale effect (𝑝):
According to the additive form of the LMDI decomposition model, the decomposition of carbon emission factors for a certain region is presented annually, as shown in Appendix II. A higher numerical value in each column indicates a greater influence of that factor on carbon emissions for the corresponding year, while a lower numerical value suggests a lesser influence. Overall, the calculated results of ∆p + ∆g + ∆c + ∆e for each year align with the calculated results of Cj – Cj–1, indicating that the change in carbon emissions for each year can be fully decomposed into these four factors. Therefore, the year-by-year decomposition of carbon emission factors for a certain region based on the additive form of the LMDI model is effective and feasible. Specifically, population scale and economic development exhibit positive effects, while energy consumption and structure intensity demonstrate significant negative effects.
We analyze the relationships between various indicators based on the Kaya and STIRPAT models. The Kaya model is often used to analyze the relationship between regional carbon emissions and factors such as population, socio-economic development level, energy efficiency, and carbon emission factors [34]. Its expression is:
Table 1.
The change rate of China’s carbon emissions from 2011 to 2020.
The Kaya model can be simplified as follows: by taking the logarithm of both sides and taking the first-order partial derivative with respect to time, we obtain: carbon emission growth rate = population growth rate + per capita GDP growth rate + unit GDP energy consumption growth rate + unit energy consumption carbon emission growth rate.
To explore the changes in regional carbon emissions and various indicators related to economy, population, and energy consumption, we first perform logarithmic differencing on the data of regional carbon emissions, population, per capita GDP, energy efficiency, and carbon emission factors of energy consumption to enhance data stationarity. The data show that carbon emissions and unit energy consumption trends have been largely consistent in recent years, especially peaking in 2013, indicating extensive use of non-fossil energy sources. However, they have gradually declined with the advancement of low-carbon policies and technological progress. The population and per capita GDP changes show similar downward trends. However, per capita GDP and energy consumption intensity exhibit opposite trends, indicating a close correlation between economic growth and energy utilization efficiency. Improving energy utilization efficiency can decouple economic growth from energy consumption, laying the foundation for sustainable economic development.
Models and Predictions
In this section, we employ various models to forecast the future trends of population, regional economy (GDP), and energy consumption. Specifically, we use a logistic model to predict future population trends, apply the Autoregressive Integrated Moving Average (ARIMA) time series forecasting method to forecast the future trend of the regional economy, construct a multiple linear regression model based on the least squares method to predict energy consumption, and utilize Long Short-Term Memory (LSTM) neural networks to forecast regional carbon emissions based on the predicted indicators influencing carbon emissions.
Population Growth Forecasting Model
Given that City X is situated in China’s eastern coastal region, where natural resources and environmental factors notably influence population growth, traditional exponential growth models may not be appropriate. Due to the extended timeframe of this forecast and the key milestones for China’s modernization in 2035 and 2050, the logistic model has become the preferred method in academia for projecting future population trends.
Logistic regression is a machine learning algorithm used for classification or prediction tasks. It predicts the probability of a discrete target variable by fitting a logistic function (also known as the sigmoid function). The logistic model assumes that population growth has a maximum value xm and an intrinsic growth rate r0. Let x denote the population size, and x0 denote the initial population size. When the population x grows close to xm, the population will maintain this level without significant changes. The formula for the logistic distribution is as follows:
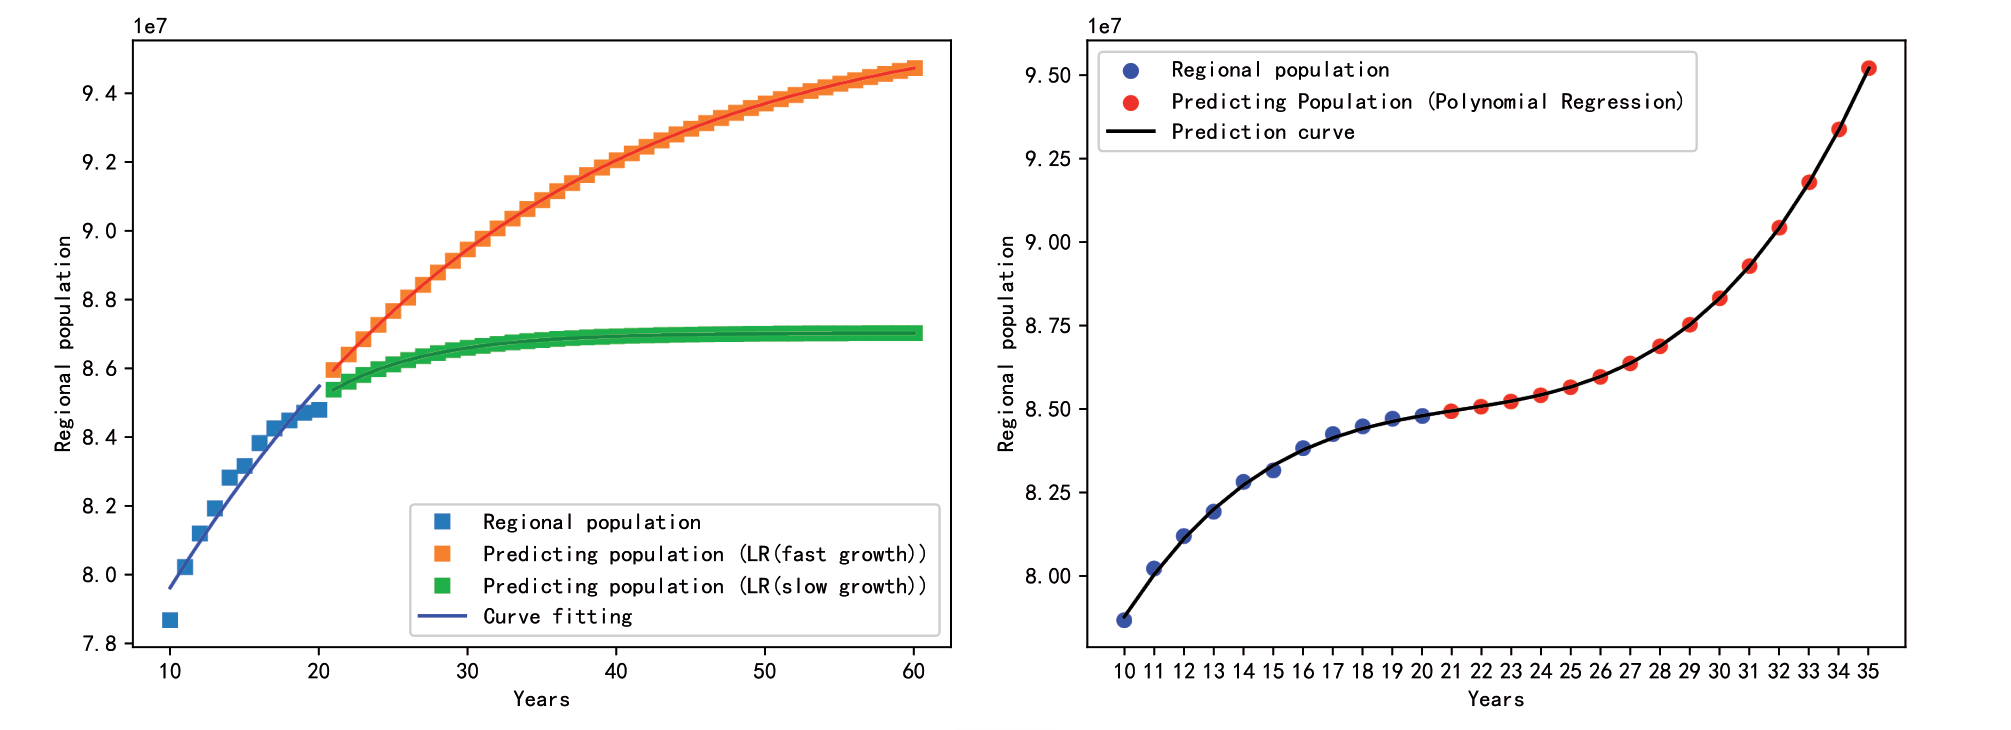
In addition, we compare the fitting results of logistic regression with polynomial regression. As shown in Fig. 2, it is evident that logistic regression fits better, avoiding the continuous growth pattern seen in population exponential models. On the other hand, polynomial regression results in continuous population growth, which clearly does not align with the actual situation in China. According to the logistic model, when population growth approaches the maximum value xm, the population will stabilize at this level without significant changes, which conforms to China’s future population development trend. The forecasting results are presented in Appendix II.
Economic Forecasting Model
ARIMA is a commonly used approach for forecasting regional GDP based on time series data. We define a function for the Augmented Dickey-Fuller (ADF) unit root test, and the test results on the original series indicate that when differencing at the first order, the t-test value is far below the 1% critical value, and the P-value is also far below 1%. Therefore, we can consider the series to be stationary. The result shows the lag order (lag order) on the x-axis and the autocorrelation coefficient or partial autocorrelation coefficient on the y-axis. By observing the sample autocorrelation function (ACF) and partial autocorrelation function (PACF), we select the optimal order of the model as (0,1,0), compute the coefficients of each autoregressive term and moving average term, and further perform ARIMA model testing.
Based on the ARIMA model (0,1,0) test, the residual degrees of freedom were found to be 9, with a sample size of 11. The Q statistic (Q6) value was 0.282, with a corresponding p-value of 0.596, suggesting no significance at the 5% level. The model’s information criteria showed an Akaike Information Criterion (AIC) of 159.27 and a Bayesian Information Criterion (BIC) of 159.875. The goodness of fit, represented by R², was calculated at 0.998, reflecting excellent model performance. Based on the AIC information criteria for automatic parameter selection, the model result is presented in the ARIMA Model (0,1,0). Analyzing the results of the Q statistic, Q6 does not show significance at the 5% level, indicating that we cannot reject the hypothesis that the model’s residuals are white noise series. Additionally, the goodness of fit R² is 0.998, indicating excellent model performance. The GDP forecast values for 2021 to 2060 are presented in Appendix III.
Energy Consumption Forecasting Model
Linear regression models can effectively handle linear relationships, fit historical data, and predict future trends. In this paper, we use a linear regression model to predict energy consumption based on changes in population and economy. We first use data from 2010 to 2020 as the training set to predict population and economic (GDP) changes from 2021 to 2025. We establish a multiple linear regression model with population and GDP as explanatory variables and energy consumption as the response variable. The model can be represented as: E(t) = α + β1 × G(t) + β2 × P(t) + ϵ. Where t represents the year, α is the intercept, β1 and β2 are coefficients, and ϵ ϵ is the error term. Based on the forecasted population and GDP for 2021 to 2025, we then conduct a linear regression prediction for energy consumption. Considering the two-time nodes (2035 and 2050) of China’s modernization, we further predict changes in population, economy (GDP), and energy consumption for the Fourteenth Five-Year Plan (2021- 2025) to the Twenty-First Five-Year Plan (2056-2060). The forecasted total energy consumption results are presented in Appendix III.
Regional Carbon Emission Forecasting Model
Long Short-Term Memory (LSTM) is a special structure that addresses the vanishing gradient and exploding gradient problems in Recurrent Neural Networks (RNNs). LSTM networks utilize gated mechanisms for retaining and forgetting information, enabling them to exhibit strong memory capabilities when processing long-term dependencies. In this paper, as carbon emissions are correlated with population, GDP, and energy consumption forecasts, we apply LSTM neural networks. This enables the model to effectively capture long-term dependencies (such as the relationship between carbon emissions, population, GDP, and energy consumption in various sectors) and achieve good fitting results.
The dimensions of the training and test sets were as follows: from 2010 to 2017, the input data consisted of 8 samples with 23 features each, while the output data had 23 samples corresponding to 8 features. From 2018 to 2020, the input data comprised 3 samples with 23 features each, and the output data included 23 samples with 3 features. During the training process, the loss function is the mean squared error (MSE) function, defined as: MSG = (yi – y͂ i)2. Where yi represents the true carbon emission value, and y͂ i represents the predicted carbon emission value. Using a grid search, the optimal hyperparameters suitable for carbon emission prediction were found to be 6 layers for the network, a learning rate of 0.001, a batch size of 1, and 100 iterations. The data is then fitted using the optimal model.
Appendix III contains the results of carbon emission prediction from 2021 to 2060 using the LSTM model. Combined with population, economy, and energy consumption predictions, carbon emission predictions based on the LSTM model exhibit a close correlation with population, economy, and energy consumption.
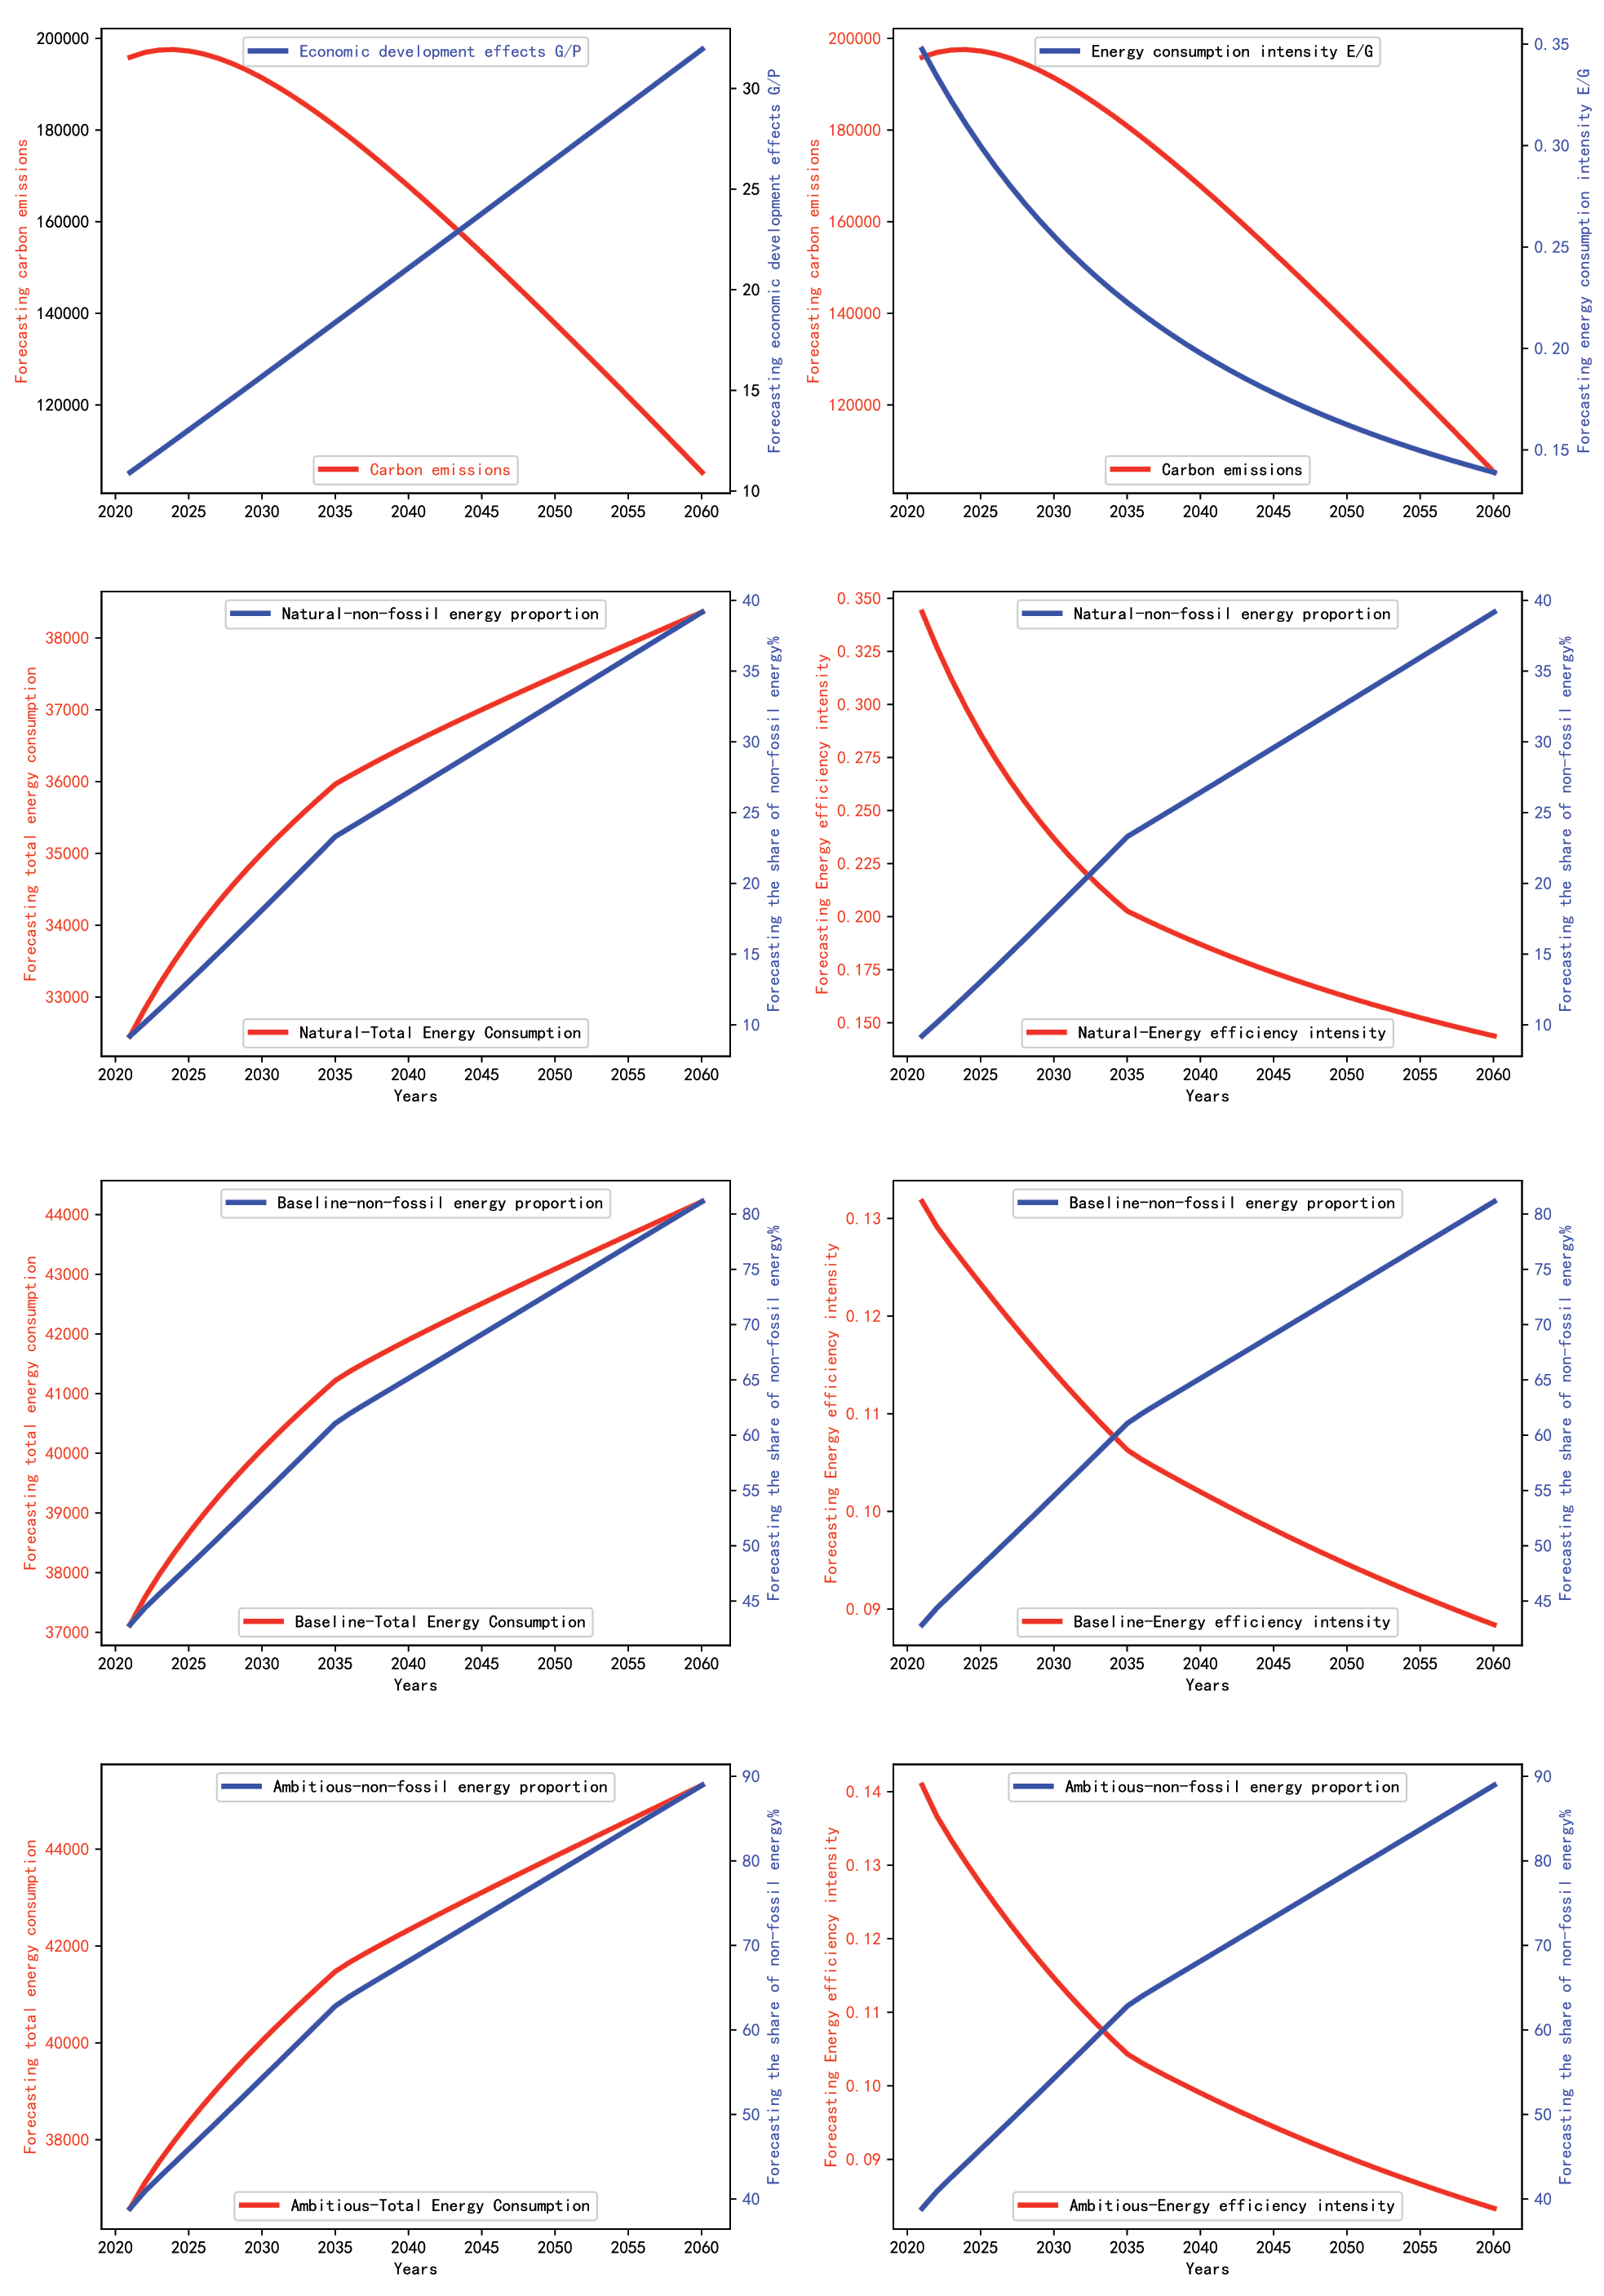
In the following graph, the x-axis represents the predictions for the forty years from 2021 to 2060. Energy consumption intensity is a crucial indicator of energy utilization efficiency in the region. As shown in the graph, energy consumption intensity gradually decreases, indicating an improvement in energy utilization efficiency and a gradual reduction in carbon emissions. Without further intervention, as the economy develops, carbon emissions decrease, indicating the effective implementation of national green and low-carbon policies.
Dual Carbon Targets
In this section, we design scenarios for achieving regional dual carbon targets and path planning without human intervention, according to the natural scenario, on-time peak carbon and carbon neutrality baseline scenarios, and ambitious scenarios for leading in peak carbon and carbon neutrality.
Natural Scenario without Human Intervention
In this scenario, we assume that achieving regional dual carbon targets relies entirely on natural processes and the self-regulation of ecosystems. We focus on methods such as improving energy efficiency, developing renewable energy, and protecting and restoring ecosystems to achieve peak carbon and carbon neutrality. Based on the LSTM model from Section 4, we simulate the natural state of carbon emissions in this scenario. The left graph below illustrates an increasing trend in the proportion of non-fossil energy and total energy consumption. The right graph illustrates a gradual decrease in energy intensity, indicating an increase in energy utilization efficiency, while the proportion of non-fossil energy also gradually increases.
Baseline Scenario for On-Time Peak Carbon and Carbon Neutrality
In this scenario, we adhere to the government-set targets of peak carbon emissions by 2030 and carbon neutrality by 2060, requiring the region to achieve these goals within the specified timeframe. This implies that governments and enterprises need to take more proactive measures to reduce carbon emissions, including enhancing the variety of energy consumption in various sectors (increasing the proportion of non-fossil energy consumption) and improving energy efficiency. In the baseline scenario, we consider the timelines set by the government for peak carbon emissions by 2030 and carbon neutrality by 2060, ensuring that these targets are achieved within the specified timeframes. In the baseline scenario, from 2021 to 2060, as shown in Fig. 3, the proportion of non-fossil energy gradually increases, reaching over 80% by 2060, and energy utilization efficiency also gradually improves.
Ambitious Scenario for Leading in Peak Carbon and Carbon Neutrality
In this scenario, we set a higher target for the region to lead in achieving China’s peak carbon emissions and carbon neutrality goals, placing it at the forefront of the nation’s dual carbon efforts. This implies that governments and enterprises need to achieve greater breakthroughs in the variety of energy consumption and energy efficiency improvements in various energy-consuming sectors. In the ambitious scenario, from 2021 to 2060, as shown in the right graph above, the proportion of non-fossil energy gradually increases, reaching close to 90% by 2060, and energy intensity shows a significant downward trend, indicating a decrease in energy consumption per unit of GDP and continuous improvement in energy utilization efficiency.
Results and Discussion
Carbon Emission Accounting under Multiple Scenarios
We have the following basic assumptions [35, 36]:
Assumption 1: GDP in 2035 doubles that of the base period (2020), and in 2060, it quadruples.
Assumption 2: The carbon sequestration capacity of ecological carbon sinks in 2060 is 10% of the base period carbon emissions.
Assumption 3: The carbon sequestration capacity of engineering carbon sinks or carbon trading in 2060 is 10% of the base period carbon emissions.
According to Assumption 1, our time series forecasting data cannot guarantee that the GDP in 2035 will double that of the base period (2020) and exceed 17,736,642 billion yuan. We set a fixed GDP growth rate of 6.67% for the periods 2020-2035 and 2035-2060 based on the lowest GDP to meet the requirements of Assumption 1, as shown in Table 2 below.
In the baseline scenario, we consider the carbon emissions situation. Based on the basic formula of the Kaya model
Fig. 3.
Comprehensive carbon emission predictions under different scenarios: natural, baseline, and ambitious, highlighting the impact of population, economic growth, and energy consumption trends.
We consider policy-mandated timelines for carbon peaking and neutrality, along with a gradually increasing energy efficiency and the proportion of non-fossil energy consumption scheme. Based on the population and energy consumption values calculated under the baseline scenario, we compute the average growth rate, advance the years, and determine the population and energy consumption for 2035/2060. Then, we calculate the carbon emissions for each year based on the carbon emission factors. Leveraging the LSTM model and focusing on improving energy efficiency and increasing the proportion of non-fossil energy, we adjust the parameters to implement progressive energy efficiency improvements and increase the proportion of non-fossil energy consumption annually during the period of carbon peaking and neutrality (from 2030 to 2050). Finally, we predicted the carbon emissions under the scenarios of natural, baseline, and ambitious designs and plotted the carbon emission trends from 2010 to 2060, as shown in the following Fig. 4. The data for 2010-2020 are plotted based on available data; hence, the carbon emission trends under the three scenarios are identical. It is worth noting that due to the lack of data on the carbon emission factors of sectoral energy consumption in 2012, the carbon emissions for that year cannot be accurately calculated, resulting in a dip in the trend.
Table 2.
Accounting under multiple scenarios.
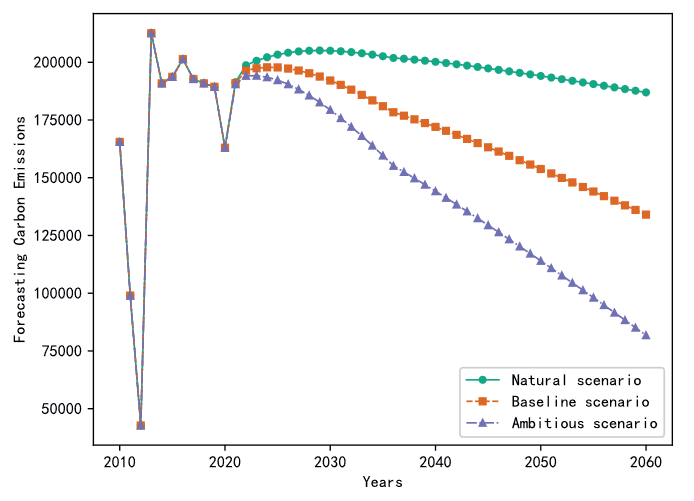
Table 3.
Determination of dual carbon (peak carbon and carbon neutrality) targets and paths.
The carbon emission trends from 2021 to 2060 are predicted based on the three scenarios using the LSTM model. From the graph, it is evident that the predicted trends closely align with the expected development of carbon emissions under corresponding policies. All three scenarios show carbon peaking, but considering the timing, the ambitious scenario precedes the baseline scenario, which, in turn, precedes the natural scenario. This indicates that carbon peaking can be achieved earlier under proactive policy frameworks.
Dual Carbon Path Planning
Based on the predicted results in this paper, we have determined the target values for GDP, population, energy consumption, energy efficiency, and the proportion of non-fossil energy consumption as follows (for the years 2025, 2030, 2035, 2050, and 2060).
Energy efficiency improvement: According to Table 3 above, energy efficiency improvement is specifically reflected in reducing energy consumption per unit of GDP. The lower the energy consumption per unit of GDP, the higher the energy efficiency improvement. From Table 3, the energy consumption per unit of GDP gradually decreases from 0.293468472 in 2025 to 0.183623471 in 2060, indicating that energy efficiency improvement has played a positive role in ensuring the achievement of the carbon peak and carbon neutrality on time or ahead of schedule [39].
Industrial upgrading: During economic development, industrial upgrading can manifest itself in the development of low-carbon industries. The increase in the proportion of low-carbon industries will help the government achieve carbon peak and carbon neutrality on time or ahead of schedule. The government can achieve this by formulating related preferential policies and increasing support for low-carbon industries from the source of industrial emissions reduction [40, 41].
Decarbonization of energy: Decarbonization of energy refers to using technologies to produce fewer carbon products during the release of equivalent energy from fuels [42, 43]. This helps to reduce carbon emissions while ensuring GDP growth. From Table 3, although the GDP in 2060 (375832.859 billion yuan) is nearly double that of 2025 (123244.486 billion yuan), the energy consumption per unit of GDP continuously decreases throughout the process. This indicates that the effect of energy conservation and emission reduction achieved through technological upgrades is significant.
Electrification of energy consumption: Electrification refers to the widespread use of electricity in industrial, agricultural, and urban and rural residents’ daily lives [43]. Electrification mainly relies on clean energy as the main power source, which can be reflected by non-fossil energy consumption in Table 3. The proportion of non-fossil energy consumption increased from 20.98% in 2025 to 90.34% in 2060, indicating a significant increase in the proportion of non-fossil energy consumption. By increasing the use of non-fossil energy, carbon dioxide emissions can be reduced, and the final effect is significant, making a significant contribution to achieving carbon peak and carbon neutrality ahead of schedule.
In conclusion, to achieve carbon peak and carbon neutrality on time or ahead of schedule, it is necessary to promote industrial upgrading, optimize related technologies to reduce carbon dioxide emissions in industrial production processes, and promote the electrification of energy consumption. This involves gradually increasing the proportion of non-fossil energy consumption and reducing energy consumption per unit of GDP through various proactive policies. The research findings align with similar findings by Li et al. [39-41, 44, 45].
Conclusions
This paper systematically reviews the current status of carbon emission prediction and proposes a carbon emission prediction and accounting framework for City X based on the LMDI and Kaya models. The prediction models utilized in this framework include logistic regression, ARIMA, the least squares method, and LSTM neural networks. Finally, the paper presents a pathway plan for City X to achieve its dual carbon goals under three scenarios.
This paper’s contributions are as follows: First, it analyzes the carbon emissions and variables influencing them in City X from 2010 to 2020 using the LMDI decomposition and Kaya models. Second, the study develops a population prediction model using logistic regression, an ARIMA-based GDP prediction model, a least squares method-based energy consumption prediction model, and an LSTM neural network-based carbon emission prediction model. Third, the study creates three scenarios: the standard scenario, which calls for no action; the aggressive scenario, which calls for reaching carbon peak and carbon neutrality earlier than expected; and the baseline scenario, which calls for neither intervention nor delay. In these scenarios, different approaches to optimizing energy consumption patterns and boosting energy efficiency across sectors are suggested in order to meet the government’s 2030 and 2060 carbon peak and carbon neutrality targets. Fourth, this study provides valuable guidance for City X’s green dual-carbon policy, serving as a reference point for other cities globally in their pursuit of sustainable, low-carbon development. The adaptable LSTM model framework demonstrates its potential to be applied in diverse economic and environmental contexts, offering tailored insights that can inform region-specific carbon reduction strategies. Furthermore, the framework’s flexibility allows for cross-sectoral applications, particularly in the industrial and energy domains, where precise emissions forecasts are crucial for sustainable planning and policy adjustment. These extended capabilities highlight the framework’s versatility across various contexts and industries, making it a powerful tool for broad implementation. The findings of this study also hold practical significance for China’s dual-carbon objectives – achieving a carbon peak by 2030 and carbon neutrality by 2060. By examining carbon emission dynamics and establishing robust predictive models, this research provides policymakers with actionable insights to accelerate progress toward these critical environmental goals. The study’s methodological innovations and scenario analyses present essential tools for decision-makers, supporting the balance between economic growth and sustainability and emphasizing the importance of timely intervention in achieving China’s ambitious carbon targets.
Due to limitations in sample size, this study employs various prediction models to better capture key variables such as population, economic indicators, energy consumption, and carbon emissions. However, potential random errors may still arise when analyzing real-world issues [46]. We acknowledge the value of accounting for external uncertainties, such as policy changes and technological advancements, which could impact the robustness of our predictions. Therefore, to improve the precision and applicability of predictions, future research should aim to acquire more comprehensive data for upcoming years and explore carbon emission predictions under additional scenarios to offer supplemental solutions. Future studies will integrate both uncertainty [23, 47-49] and sensitivity analyses to enhance model robustness and applicability. Specifically, probabilistic methods like Monte Carlo simulations will be employed to evaluate potential outcomes under varying external conditions, including policy and economic dynamics shifts.
Additionally, we can consider utilizing approaches based on system dynamics [50] and the “scenario-response” paradigm [51] to predict carbon emissions under unforeseen events, making the predictions more scientifically sound. Subsequently, validating the effectiveness of these new models in practical applications will be essential.

