

Introduction
Background and Significance
The intensification of the global greenhouse effect will bring disastrous consequences to human society. In order to actively respond to global climate change, China put forward the “dual carbon” target in 2019, making a solemn commitment to respond to global climate change [1-4]. Shanxi is an important energy and heavy chemical industry base in China, as well as a pilot of the comprehensive reform of the national energy revolution, and it occupies a key position in the national energy security and carbon peak carbon neutral action [5, 6]. By carrying out the carbon emission prediction research in Shanxi Province, combined with economic development, technological progress, and other factors, this paper studied and predicted the carbon emission of energy consumption in the future and proposed carbon reduction measures. The research results can provide a theoretical basis and work ideas for the competent authorities in Shanxi Province to carry out relevant work.
Review of Related Research
In recent years, there have been more and more studies on climate change and carbon emissions [7-12]. Relevant studies on “dual carbon” mainly focus on carbon emission accounting [13-17], driving factors [13, 15, 17-21], and simulation prediction [14, 18, 19, 21]. In terms of carbon emissions projections, common prediction methods mainly include Back Propagation (BP) [22], Grey model (GM) [23], LEAP model [24], Novel support vector machine (NSVM) [25], K-nearest neighbor (KNN) [26], Theil-Sen’s trend analysis [27], STIRPAT Model [28], System Dynamics model (SD) [29], etc. Among them, SD is a method and modeling technology based on feedback control theory and computer simulation technology to study the structure, behavior, and function of complex systems, which can well reflect the interaction of internal elements of the system [29]. This method was first used in the industrial field. At present, it has also been well applied in a series of nonlinear, complex, large-scale systems such as low-carbon energy ecology. Long [30] analyzed the energy consumption of the main production logistics system and auxiliary production system in MSBICM using the SD method. Wang [31] simulated the impact of jobs-housing relationship adjustment policies on CO2 emissions from urban transport using SD method.
To sum up, although many scholars have made prediction analyses on carbon emissions, there are few relevant studies on Shanxi’s carbon emissions at present. Carbon emissions research is a complex, systematic study involving various aspects such as energy, economy, population, technology, etc. Therefore, this study comprehensively considers the nonlinear and multi-feedback complex interaction between various influencing factors. Based on the main influencing factors of carbon emission in Shanxi Province, the SD model was established to study the causal relationship between various factors within the system and carbon emission, and then the scenario prediction of carbon emission in Shanxi Province was made, and emission reduction measures were proposed, in order to provide ideas for energy conservation and emission reduction in Shanxi Province.
Materials and Methods
Methods
This study adopts the SD method and, based on the analysis results of driving factors of carbon emission in Shanxi Province [13], studies and analyzes the interaction and mechanism of various driving factors. Based on relevant plans and measures for the social economy, energy, environment, etc., in Shanxi Province, different scenarios were designed to carry out simulations in order to explore the best carbon emission reduction measures for energy consumption.
Data
This study mainly uses the relevant data of Shanxi Province from 2010 to 2021 to construct and verify the model and, on this basis, simulates and predicts the relevant index data from 2022 to 2035. The method of obtaining the required parameters in the model is as follows:
Statistical data. The basic parameters of this study during 2010-2021 were mainly obtained from or calculated from basic statistical data such as the Shanxi Provincial Statistical Yearbook and China Energy Statistical Yearbook. They included GDP growth rate, number of enterprises, birth rate, death rate, energy consumption, proportion of non-fossil energy consumption, proportion of coal consumption, proportion of natural gas consumption, proportion of oil consumption, etc.
Department data. Part of the data in this study came from the plans, programs, or annual government work reports formulated by the departments, such as the reduction rate of energy consumption per unit of GDP, the GDP growth rate in 2020-2025, and the proportion of non-fossil energy consumption in 2025.
Model training value. For the relevant indicators and correlation relationships for which reference data cannot be directly obtained, the possible reasonable values are first calculated according to expert experience, and then the parameters are repeatedly adjusted by comparing the simulation results with historical data to obtain reasonable empirical values, such as the impact factors of population change on GDP growth rate and the impact factors of industrial enterprises on GDP growth rate.
Model Building and Testing
Model Boundary
This study intends to analyze the impact of energy and economic development on carbon emissions in Shanxi Province under different development modes and build a complex dynamic model that can reflect the relationship between energy, economic development, and carbon emissions. Referring to other similar literature [29, 30], the geographical boundary of the research area is usually taken as the research boundary, so the systematic boundary of this study is determined to be Shanxi Province. The system boundary is Shanxi Province, the time boundary is 2010-2035 (2010 is the base year), and the simulation step is 1 year.
Postulated Conditions
According to the principle of system dynamics modeling, on the premise of not affecting the behavior of the system in question, the simpler the model, the better. Therefore, certain assumptions should be made before modeling, specifically as follows:
There are many factors affecting carbon emissions in Shanxi Province, including gross regional product (GDP), energy consumption structure, energy consumption intensity, scientific and technological progress, urbanization rate, etc. According to the research result of Zhao [13], carbon emission of energy consumption in Shanxi Province is mainly affected by gross regional product (GDP), energy consumption structure, and energy consumption intensity. Therefore, this study assumes that carbon emissions from energy consumption in Shanxi Province are mainly affected by relevant indicators such as gross domestic product (GDP), energy consumption structure, and energy consumption intensity.
It is assumed that the energy consumption structure is mainly affected by energy policies in addition to its own inertia adjustment. The reasons are as follows: Shanxi is a big coal province, promoting the proportion of zero-carbon and low-carbon energy such as non-fossil energy and natural gas to increase mainly due to the influence of policies, which will promote the development of new energy technology and further promote the adjustment of energy structure. Therefore, policies are the original driving force for the adjustment of energy structure. At the same time, considering the modeling principle that the simpler the model, the better, the impact of energy policies is given priority.
It is assumed that the energy intensity per unit GDP is mainly affected by industrial energy in addition to the national reduction target. The reasons are as follows: Energy consumption in Shanxi Province mainly comes from industrial energy consumption. According to statistics, industrial energy consumption in 2021 accounted for about 89% of the total energy consumption in the province, so the focus is on the impact of industrial energy consumption.
It is assumed that gross regional product (GDP) growth is mainly affected by population changes and the number of industrial enterprises. The reasons are as follows: population and enterprises are the driving force and source of economic development, the larger the population, especially the working population, the greater the growth of regional gross domestic product (GDP), and the number of enterprises represents the industrial development, so this study focuses on the population and the number of enterprises.
It is assumed that the economy continues to grow steadily without large fluctuations or hyperinflation.
Model Causality
Clarifying the causality of different indicators is the premise and basis of establishing the system dynamics model. This study focuses on the impact of gross regional product (GDP), energy consumption structure, and energy consumption intensity on carbon emissions. Therefore, based on systematic analysis and expert consultation, the causality relationship is constructed, as shown in Fig. 1. As can be seen from the figure, the main positive feedback loops are:
Positive feedback loop one: GDP → + energy consumption → + CO2 emissions → + energy policy → + energy consumption structure → + GDP.
The mechanism of action is as follows: the increase of GDP will promote the increase of energy consumption, and then promote the increase of carbon emissions, and the increase of carbon emissions will lead to the increase of the effect of energy policy, and then promote the adjustment of energy consumption structure, and the adjustment of energy consumption structure is conducive to the increase of GDP.
Positive feedback loop two: Population policy → + population → + GDP→ + energy consumption → + CO2 emissions → + energy policy → + energy consumption structure → + population policy.
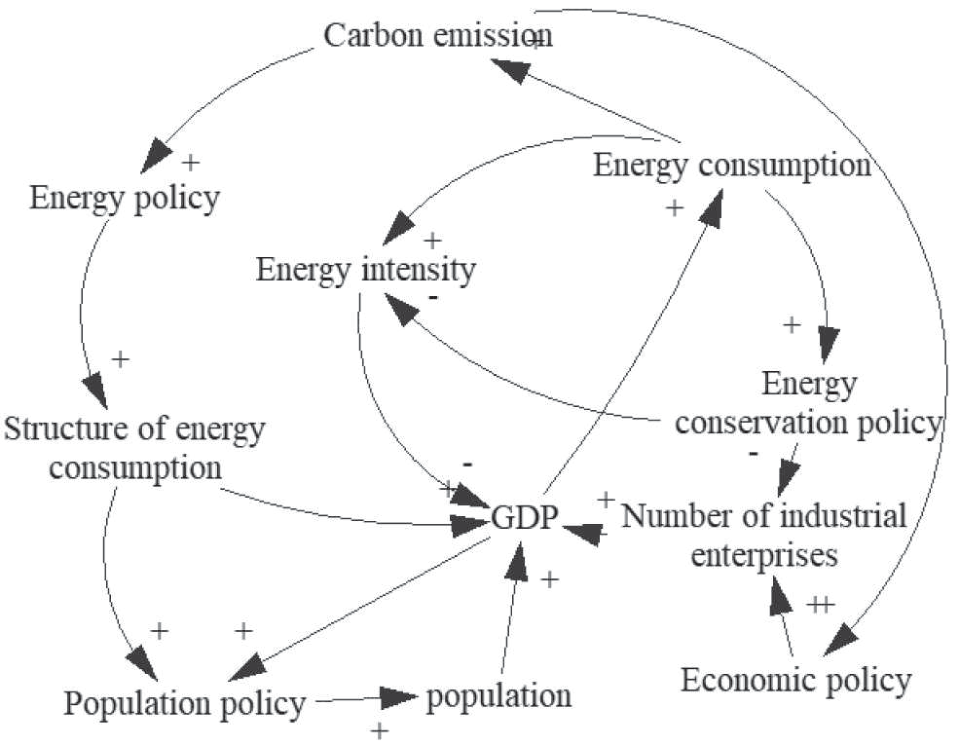
The mechanism of action is as follows: the strengthening of population policy will lead to the increase of population in Shanxi, which will further promote the increase of GDP, energy consumption and carbon emissions, and the increase of carbon emissions will lead to the increase of the effect of energy policy, which will further promote the adjustment of energy consumption structure, while the adjustment of energy consumption structure and the improvement of environment are conducive to the increase of population policy.
Positive feedback loop three: Population policy → + population → + GDP → + population policy. The mechanism of action is as follows: the strengthening of population policy will lead to the increase of Shanxi’s population, which will further promote the increase of GDP, and the increase of GDP will further promote the strengthening of population policy.
The main negative feedback loops are:
Negative feedback loop one: GDP → + energy consumption → + energy-saving policy → -energy consumption intensity → + GDP.
The mechanism of action is as follows: the increase of GDP will promote the increase of energy consumption, the increase of energy consumption will lead to the increase of energy conservation policies, and then reduce the energy consumption intensity, and the decrease of energy consumption intensity will promote the increase of GDP.
Negative feedback loop two: GDP → + energy consumption → + energy-saving policy → -number of industries on the rule → + GDP.
The mechanism of action is as follows: the increase of GDP will promote the increase of energy consumption, the increase of energy consumption will lead to the increase of energy conservation policies, the increase of energy conservation policies will reduce the number of industrial enterprises on the scale, and the decrease of the number of industrial enterprises on the scale will lead to the decrease of GDP.
Negative feedback loop three: GDP → + energy consumption → + energy consumption intensity → -GDP.
The mechanism of action is: the increase of GDP leads to the increase of energy consumption, which leads to the increase of energy consumption intensity, and the increase of energy consumption intensity will lead to the decrease of GDP.
System Flow
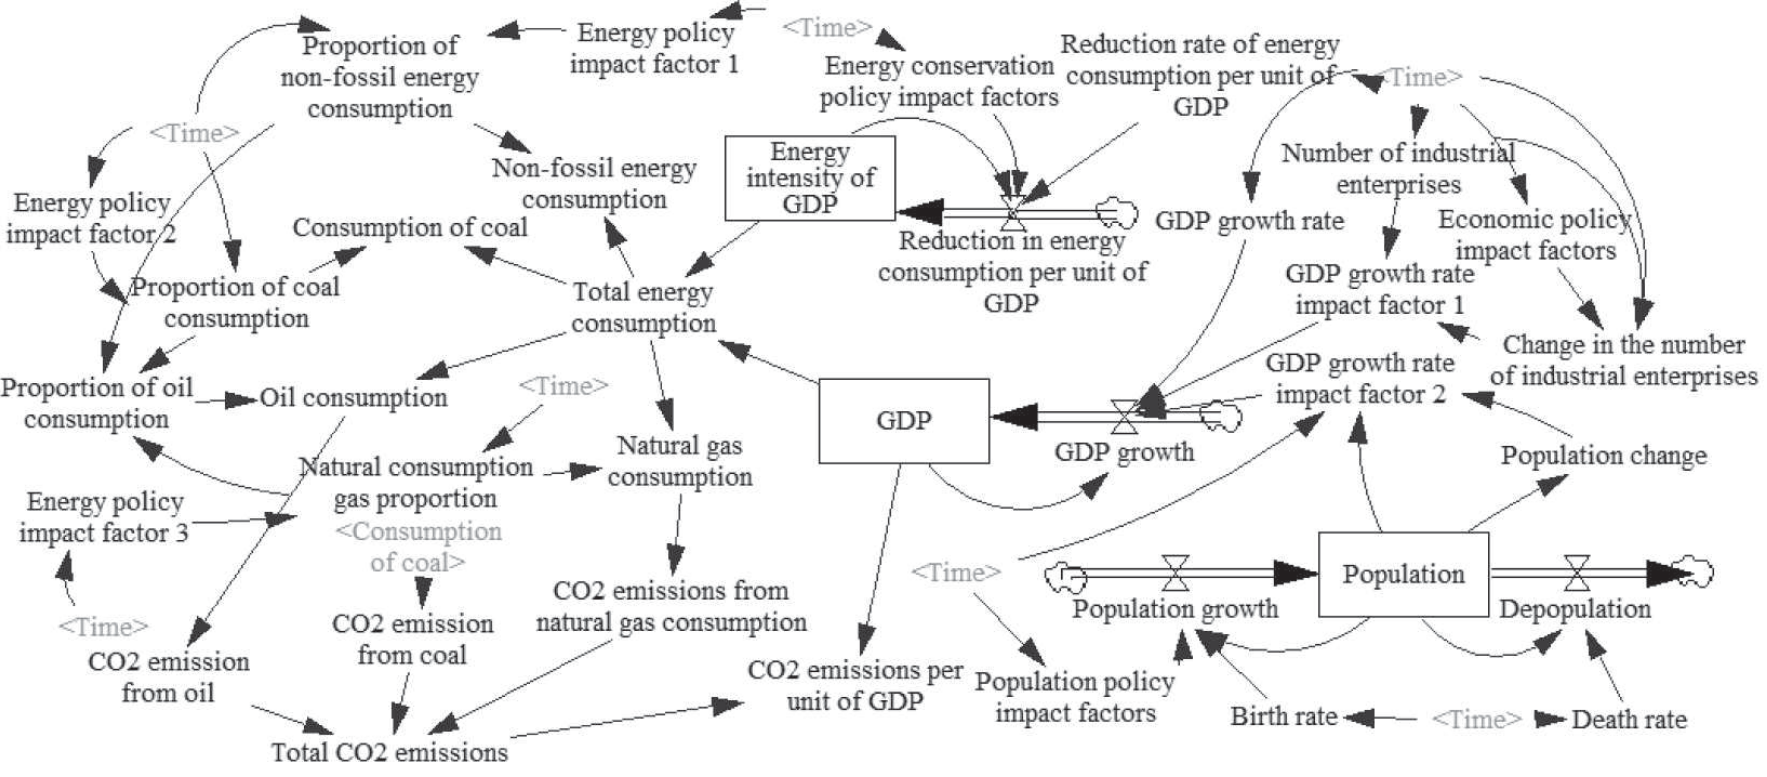
The system flow diagram is constructed on the basis of a causality diagram, in which population, GDP, and energy intensity per unit GDP are horizontal variables, reflecting the accumulation effect in energy and economic system, which is mainly affected by rate variables. Population growth, decrease, GDP growth, energy consumption intensity change, are rate variables, which directly affect the change of level variables, in which population growth is mainly affected by birth rate and population policy influence factors, population policy impact is mainly to study the impact of regional population introduction policies (such as talent policy) on population; The rate of population decrease is mainly affected by the natural mortality rate of the population. GDP growth is affected by inertia growth, the number of enterprises, and population changes. The number of enterprises mainly studies the influence of industry on the GDP. In addition to natural birth rate and death rate, population change mainly studies the impact of talent import and outflow on regional GDP. The change in energy consumption intensity is mainly affected by national energy conservation targets and tasks and industrial energy consumption. The change in the amount of non-fossil energy is mainly affected by the inertial growth rate and energy policy, and the impact of energy policy is the impact of the research policy on the proportion of non-fossil energy in primary energy consumption after the further strengthening of the existing policy. Other variables are auxiliary variables and constants, as shown in Fig. 2. Based on the interaction and action principle of each variable, the main parameters and equations of the model are shown in Table 1.
Model Validity Test
The model validity test compares the simulation data simulated by the model with the real-world data to check whether it can accurately reflect the real situation of the real world. In this study, simulation data and historical data of four indicators (gross regional product (GDP), total energy consumption, energy intensity per unit GDP, and population) were selected to test the effectiveness of the model. For details, see Table 2. As can be seen from Table 2, the simulation model of energy and economy on carbon emissions built in this research has a high degree of fitting with the real world, and the error between the simulation value and the actual value is controlled within 5%, which can be used in simulation experiments.
Scenario Design
According to the analysis of driving factors of carbon emission in Shanxi Province [13], the main driving factors of total carbon emission in Shanxi Province include economic growth, energy consumption intensity, energy consumption structure and population, etc. Therefore, population policy, economic policy, energy-saving policy, and energy structure adjustment policy are selected as the main influencing factors of carbon emission in this paper, and six different scenarios are designed through targeted combination. They are the base scenario, population policy impact, economic policy impact scenario, energy conservation policy impact scenario, energy structure adjustment policy impact scenario, and “economy-energy-saving - energy structure - population” balanced development scenario. Among them, the baseline scenario is mainly a continuation of the existing development model, while the other scenarios are policy optimization scenarios, which respectively represent the impact of different economic, social, energy, and other priorities on carbon emissions in Shanxi Province.
Base Scenario (QJ0)
The baseline scenario refers to the continuation of the existing development model, in which the 2022-2025 parameter Settings are mainly from the “14th Five-Year Plan of National Economic Development in Shanxi Province”, “Shanxi 14th Five-Year Plan for Energy Conservation Implementation”, “Shanxi Carbon Peak Implementation Plan” and other planning scheme data; the parameters of 2026-2035 are mainly estimated on the basis of 2025 in combination with the national medium and long-term planning, the actual situation of Shanxi Province and expert judgment. The specific indicators are shown in Table 3.
Policy Optimization Scenario
In order to study the impact of population policies, economic policies, energy conservation policies, and energy structure adjustment policies on carbon emissions in Shanxi Province, the parameter setting mode was changed from 2022 in the policy optimization scenario, so as to change the effects of the above policies on carbon emissions in Shanxi Province.
Scenario 1 is the impact scenario of population policy, which focuses on the study of the impact of population increase on carbon emissions. The intensity of population policy is increased by 5%; that is, the negative population growth rate is optimized by 5% compared with the baseline scenario through measures such as increasing the birth rate and introducing talents.
Scenario 2 is the economic policy impact scenario, which focuses on the pursuit of economic development and the promotion of economic development momentum through technological innovation and the introduction of investment; that is, the GDP growth rate will be increased by 5% on the current basis.
Table 1.
Main parameters and equations of the model.
Table 2.
Main variable simulation data check.
Scenario 3 is the impact scenario of energy conservation policies, which focuses on vigorously promoting energy conservation policies in the province and improving energy utilization efficiency; that is, energy utilization increases by 5% under the baseline scenario.
Scenario 4 is the energy structure adjustment scenario, which focuses on optimizing the energy structure, that is, reducing the proportion of coal consumption and increasing the proportion of natural gas and renewable energy, that is, optimizing the proportion of coal by 5% under the baseline scenario.
Scenario 5 is a balanced development scenario in which all influencing factors are 5% better than the baseline scenario. The specific parameter design is shown in Table 4.
Results and Discussion
Results
Analysis of Total Carbon Emissions
It can be seen from the simulation results that the trend of Shanxi’s carbon emissions generally increases first and then decreases and is expected to reach its peak around 2031. The peak annual carbon emission under different scenarios is as follows: The peak annual carbon emissions of the economic policy impact scenario (QJ2) were 628 million tons, that of the population scenario (QJ1) was 609 million tons, that of the base scenario (QJ0) was 609 million tons, and that of the energy conservation policy impact scenario (QJ3) was 595 million tons. The peak annual carbon emissions of the energy structure adjustment scenario (QJ4) and the equilibrium development scenario (QJ5) are 582 million tons and 575 million tons, respectively. According to the results of the peak annual carbon emissions, the economic policy impact scenario (QJ2) has the largest carbon emissions when it reaches its peak, followed by the population scenario (QJ1) and the base scenario (QJ0). Emissions are relatively small in the energy conservation policy impact scenario (QJ3), energy structure adjustment scenario (QJ4) and balanced development scenario (QJ5), indicating that economic development is the main factor affecting the increase of carbon emissions, but the balanced development scenario (QJ5) has the smallest carbon emissions, indicating that even if the economic development accelerates and the population size increases, However, if energy conservation policies and energy structure policies are strengthened simultaneously, carbon emission reduction can also be achieved. See Fig. 3 for details.
Table 3.
Parameters of the main indicators in the baseline scenario.
From the perspective of the carbon emission growth rate, the growth rate of carbon emission in 2022-2026 is relatively large, and the annual growth rate of different scenarios is between 2.39% and 3.85%. Among them, the economic policy is the fastest growing, with an average annual growth rate of 3.85%, followed by the base population scenario (QJ0), population scenario (QJ1), and energy-saving scenario (QJ3). The growth rate is about 3.47%, and the equilibrium scenario and the energy structure adjustment scenario are relatively slow, with an average annual growth rate of 2.39% and 2.66%, respectively. Combined with the actual situation of Shanxi, the rapid growth rate in this period is mainly due to: on the one hand, considering that the economic level of Shanxi is still relatively backward compared with other developed areas in the country, there is still a large development demand and development space for economic development, and combined with the requirements of the Outline of the “14th Five-Year Plan” of National Economic and Social Development of Shanxi Province, the economic development speed of this period is set at 8% rapid growth during the simulation; on the other hand, energy intensity and energy structure in this period were optimized to some extent. However, due to the relatively high absolute value of energy intensity and energy structure in this period, according to the normal optimization speed, the contribution to the reduction of carbon emissions in this period was lower than that of economic development, indicating that carbon emissions in this period were mainly affected by economic development, and economic growth and carbon emissions were not separated.
In the period from 2027 to 2031, the growth rate of Shanxi’s carbon emissions gradually slowed down, and the annual growth rate of different scenarios ranged from 0.69-0.94%. The growth rate of carbon emissions in the economic policy impact scenario (QJ2) was 0.93%, in the population scenario (QJ1) was 0.69%, in the base scenario (QJ0) was 0.69%, and in the energy conservation policy impact scenario (QJ3) was 0.69%. The carbon emission growth rate is 0.93% in the energy structure adjustment scenario (QJ4) and 0.94% in the balanced development scenario (QJ5). The main reasons for the gradual slowdown of the growth rate of carbon emissions in this period are: on the one hand, the economic development in this period gradually slowed down. Combined with the actual economic development of other developed regions, the economic growth rate gradually slowed down with the increase of the economic aggregate after economic growth to a certain extent, so the GDP growth rate in the baseline scenario dropped from 8% in the previous period to 5%; on the other hand, although energy consumption intensity and energy structure adjustment increased compared with the previous period, their contribution to the reduction of carbon emissions was still smaller than the promotion effect of economic growth on carbon emissions. Therefore, the growth trend of carbon emissions in this period was slower than that in the previous period, but it showed a gradual upward trend under the influence of economic development.
Table 4.
Scenario design for policy optimization.
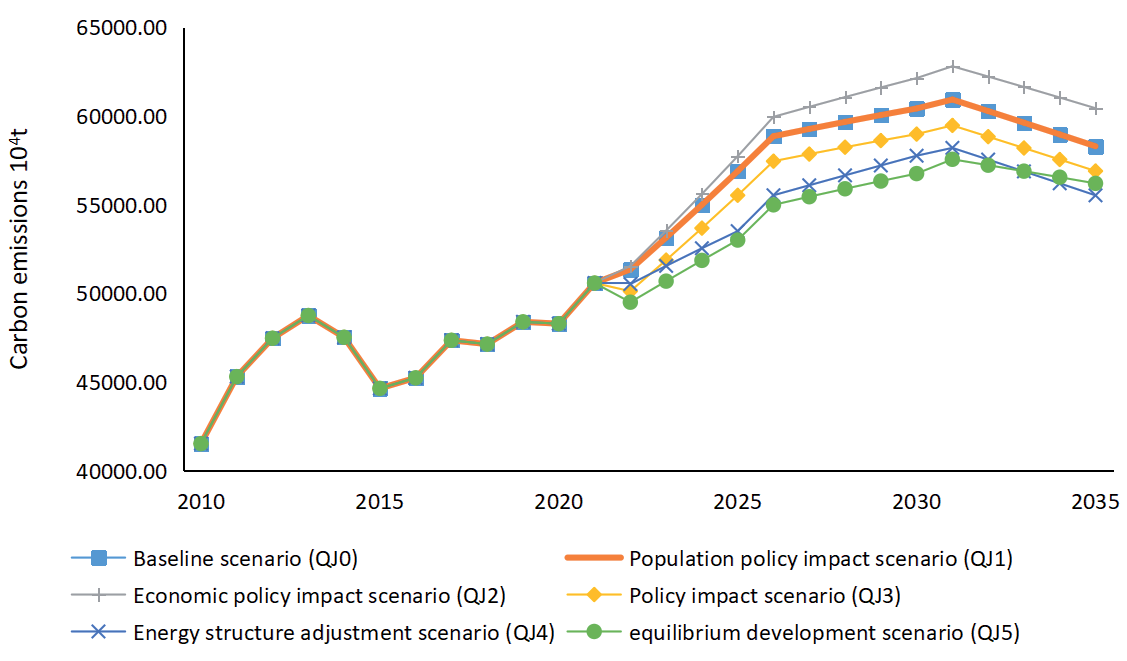
During 2032-2035, Shanxi’s carbon emissions show a downward trend, with annual decline rates ranging from 0.60-1.11% in different scenarios The carbon emission decline rate of economic policy impact scenario (QJ2) was 0.97%, that of population scenario (QJ1) was 1.11%, that of base scenario (QJ0) was 1.11%, and that of energy conservation policy impact scenario (QJ3) was 1.11%. The reduction rate of carbon emissions is 1.18% in the energy structure adjustment scenario (QJ4) and 0.6% in the balanced development scenario (QJ5). The gradual decline of carbon emissions during this period is mainly due to: on the one hand, the economic growth rate continues to slow down, and the GDP growth rate in the baseline scenario drops from 5% in the previous period to 3%; On the other hand, energy consumption intensity and the effect of energy structure adjustment gradually increased, so in this period, economic growth and carbon emissions decoupled.
Carbon Emission Intensity Analysis
The overall carbon intensity of different scenarios showed a downward trend, but after 2022, there was little difference in the decline rate of carbon intensity among different scenarios, with an average decline of 45.14%, among which the lowest value was 44.28% and the highest was 46.87%. The equilibrium development scenario (QJ5) has the largest decrease, from 2.77 tons / 10,000 yuan in 2021 to 1.44 tons / 10,000 yuan in 2035, a decrease of 46.87%, while the baseline scenario (QJ0), population policy impact scenario (QJ1) and economic policy impact scenario (QJ2) have the smallest decrease. From 2.77 tons/yuan in 2021 to 1.54 tons/yuan in 2035, a decrease of 44.28%. The main reason is that the carbon emission intensity is affected by both carbon emission and GDP. Population growth and economic development promote the growth of carbon emissions, but they also promote the growth of GDP.
Analysis of Influencing Factors of Carbon Emission
In order to study the influence of different influencing factors on carbon emissions, this study adopted the control variable method, carried out policy experiments in the system dynamics model, and investigated the impact of single variable changes on total carbon emissions under the baseline scenario. See Fig. 4 for details.
The first scenario is the impact scenario of population policy, focusing on the impact of a 5% increase in population policy on carbon emissions. It can be seen from the simulation results that after the enhancement of the population policy, the carbon emission pair will increase slightly compared with the baseline scenario after 2025, but the overall effect of the increase is small, among which the highest is 36,000 tons in 2035. The small contribution of population policy to carbon emissions may be due to the fact that population policy indirectly affects carbon emissions by driving GDP growth. Due to the low birth rate and population loss in Shanxi in recent years, the population of Shanxi has a negative growth trend. Although the increase of population policy has a certain promoting effect, it has no obvious effect on economic growth and thus has no obvious contribution to carbon emissions.
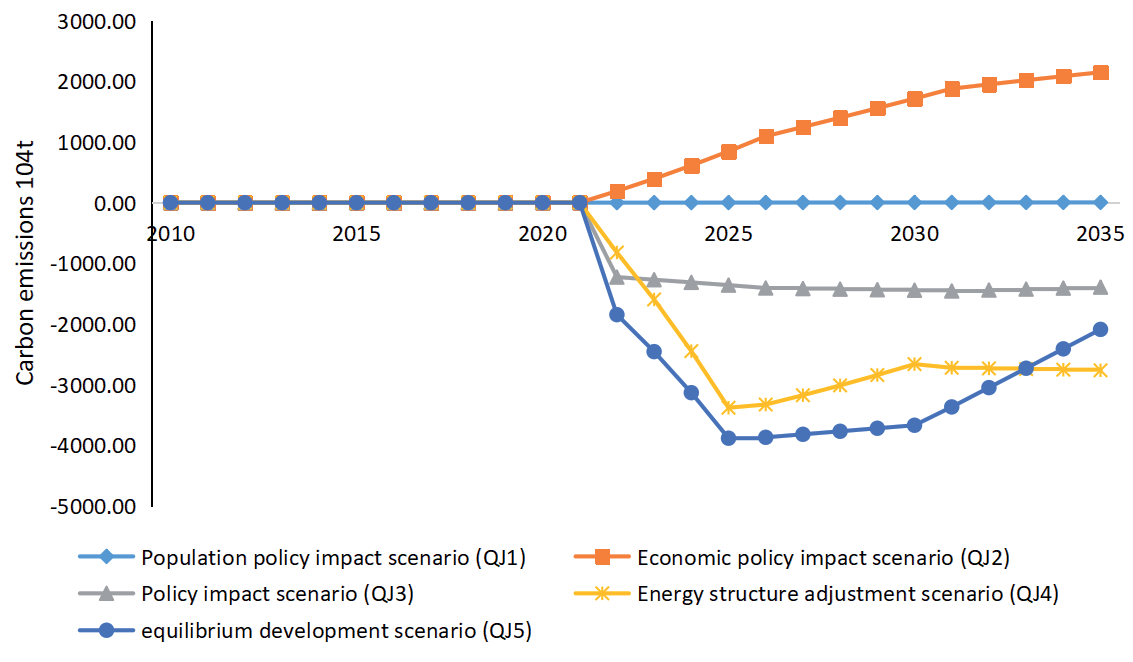
The second scenario is the economic policy impact scenario, focusing on the impact of 5% economic growth on Shanxi’s carbon emissions. According to the simulation results, after the strengthening of economic policies, the increasing effect on carbon emissions should gradually increase, and the increasing effect on carbon emissions increases from 1.9 million tons in 2022 to 21.47 million tons in 2035 compared with the baseline scenario, indicating that economic growth is one of the main influencing factors of Shanxi’s carbon emissions, mainly due to the fact that Shanxi’s economy is dominated by energy, heavy chemical industry. The energy consumption per unit GDP is much higher than the national average, which leads to the rapid increase of carbon emissions corresponding to economic growth. Therefore, one of the main measures for Shanxi to gradually decouple economic growth from carbon emissions is to develop a low-carbon economy, adjust the industrial structure, and reduce energy consumption and carbon emissions corresponding to economic growth.
The third scenario is the impact scenario of energy conservation policy, focusing on the impact of increasing energy conservation policy by 5% on Shanxi’s carbon emissions. As can be seen from the simulation results, the promoting effect on carbon emissions after the strengthening of energy-saving policies gradually increases, but the overall change is relatively flat, and the promoting effect on carbon emissions increases from 12.27 million tons in 2022 to 13.92 million tons in 2035 compared with the baseline scenario. On the one hand, the energy consumption per unit GDP of Shanxi is much higher than the national average level, and there is still a large space for energy conservation and carbon emission reduction, so it makes a relatively large contribution to carbon emission reduction. On the other hand, the energy saving potential will gradually narrow with the improvement of energy efficiency, so the change of carbon emission reduction effect is relatively flat.
The fourth scenario is the impact of energy structure adjustment policies, focusing on the impact of energy structure adjustment policies increased by 5% on Shanxi’s carbon emissions. The simulation results show that the promoting effect on carbon emissions after the strengthening of the energy structure adjustment policy increases rapidly from 2022 to 2026, and the promoting effect on carbon emissions increases from 1.17 million tons in 2022 to 33.78 million tons in 2026 compared with the base scenario. The reduction effect gradually decreases after 2026, reaching 27.62 million tons in 2035. The main reason is that the primary energy consumption structure of Shanxi Province is dominated by coal. In the initial stage of policy strengthening, the proportion of coal in primary energy consumption decreases rapidly, resulting in a rapid increase in the promoting effect on carbon emissions. After 2026, due to the gradual narrowing of the adjustment space of energy structure, the promoting effect gradually slows down. However, compared with energy-saving policies, energy structure adjustment policies have significantly higher promoting and reducing effects on carbon emissions, so strengthening relevant policies on energy structure adjustment is the main measure to rapidly reduce carbon emissions.
Table 5.
Change of carbon emission intensity in different scenarios.
| Years | QJ0 | QJ1 | QJ2 | QJ3 | QJ4 | QJ5 |
|---|---|---|---|---|---|---|
| 2010 | 4.67 | 4.67 | 4.67 | 4.67 | 4.67 | 4.67 |
| 2021 | 2.78 | 2.78 | 2.78 | 2.78 | 2.78 | 2.77 |
| 2025 | 2.34 | 2.34 | 2.34 | 2.28 | 2.20 | 2.15 |
| 2030 | 1.82 | 1.82 | 1.82 | 1.77 | 1.73 | 1.66 |
| 2035 | 1.54 | 1.54 | 1.54 | 1.511 | 1.47 | 1.44 |
Scenario 5 is the scenario in which all policies are strengthened by 5%. According to the simulation results, compared with the baseline scenario, all policies strengthened have an overall promoting effect on carbon emissions, especially in the initial stage of policy strengthening. Due to the dual effects of energy conservation and energy structure adjustment, the promoting effect on carbon emissions is obvious. The reduction in carbon emissions compared to the base scenario increases from 12.32 million tonnes in 2022 to 38.8 million tonnes in 2025. Subsequently, with the space for energy conservation and adjustment of energy structure gradually narrowed, the promoting effect gradually decreased.
Discussion
Based on the above research results, economy, energy conservation and energy structure are the main factors affecting Shanxi’s carbon emissions, and economic development will promote the increase of Shanxi’s carbon emissions, mainly because Shanxi’s economy is mainly dominated by high-carbon economy such as electricity, coal, steel and coke, and its economic development mode is dominated by energy heavy chemical industry, resulting in economic development becoming the main source of Shanxi’s carbon emissions. Therefore, combined with the existing research results and the existing policy suggestions in Shanxi, the following carbon emission reduction policies should be carried out: First, it is necessary to strengthen scientific and technological innovation, carry out basic, cutting-edge and subversive technology research in combination with Shanxi’s industrial characteristics, and promote the transformation and upgrading of existing industries in Shanxi Province; Second, seize the major opportunities to promote the rise of the central region, optimize the business environment, innovate the support system, and accelerate the construction of a modern industrial system in Shanxi Province.
The adjustment of energy structure will reduce carbon emissions, mainly because Shanxi’s energy consumption is dominated by coal, and coal accounts for a much higher proportion of primary energy consumption than the national average. Reducing the proportion of coal consumption can greatly reduce carbon emissions and has great potential for carbon emission reduction. Therefore, combined with the existing research results and the existing policy suggestions in Shanxi, the following carbon emission reduction policies should be carried out: first, increase the development and utilization of new energy and renewable energy, combined with the pilot policy of energy revolution in Shanxi Province, promote the large-scale development of wind power and photovoltaic, and accelerate the development and utilization of high-quality energy such as geothermal energy and hydrogen energy; the second is to accelerate the development and utilization of unconventional natural gas in combination with Shanxi’s resource advantages.
Improving energy use efficiency will also reduce carbon emissions, mainly because the leading industry in Shanxi Province is traditional energy industries such as energy heavy chemical industry, and the energy use efficiency is relatively low, resulting in relatively revised carbon emissions. Therefore, it is suggested to further improve energy use efficiency, and specific measures include: First, strictly control the “two high”, eliminate backward, and promote the iron and steel, chemical, building materials, coking, nonferrous metals and other five high-energy-consuming traditional industries carbon emission peak as soon as possible; the second is to promote the upgrading of energy-saving and low-carbon process technology and equipment, strengthen the intelligent control of energy conservation, and promote the deep integration of digital intelligence and energy.
Conclusions
Based on the system dynamics method and the main factors influencing carbon emission in Shanxi Province, this paper systematically analyzes the causal relationship and mechanism of each factor and builds a complex system model of economy, energy, and carbon emission in Shanxi Province. On this basis, five scenarios with different pertinence are designed, and simulation analysis is carried out. The main conclusions are as follows:
From 2022 to 2035, the trend of carbon emissions in Shanxi Province generally increased first and then decreased. It will peak around 2031, with the highest carbon emissions of about 628 million tons in the economic policy scenario (QJ2) and the lowest carbon emissions of about 576 million tons in the equilibrium scenario (QJ5). The growth rate of carbon emissions in 2022-2026 is relatively large, and the annual growth rate of different scenarios is between 2.39% and 3.85%. The growth rate of Shanxi’s carbon emissions in 2026-2031 gradually slows down, and the annual growth rate is between 0.69-0.94% under different scenarios. From 2032 to 2035, carbon emissions in Shanxi Province showed a downward trend, and the annual decline rate was between 0.60-1.11% under different scenarios. The overall carbon emission intensity showed a downward trend, with an average decrease of 45.14% in different scenarios after 2022, among which the lowest value was 44.28% and the highest value was 46.87%, with little difference among different scenarios (Table 5).
Strengthening energy structure adjustment policies and energy conservation policies is the main way to reduce total carbon emissions, and the carbon emission reduction space of energy structure adjustment policies is better than that of energy conservation policies. The strengthening of economic development policies and population policies will lead to the increase of carbon emissions. Among them, economic development policies have a significant effect on the increase of carbon emissions, mainly because Shanxi’s economy is related to the energy heavy chemical industry structure, while population policies have a small effect on the increase of carbon emissions.

