

Introduction
Water, energy, and food are indispensable for human survival and social and economic development. Complex interactive relationships exist among the three resources, and the production and supply of any of them depends on the other two resources [1-3]. Many studies have proven that the disconnected development strategy for single-sector resource management may cause unpredictable and severe harm to other resource sectors [4, 5]. Water, energy, and food resource sectors have recently faced growing demands and challenges due to urbanization, population increase, and climate change. Issues such as unbalanced food supply and demand, water scarcity, and energy crisis have become increasingly severe. Currently, the water-energy-food nexus is facing the risk of complex climate change impacts. Climate change, mainly characterized by warming, has led to frequent extreme weather events, resulting in extreme hydrological conditions that greatly endanger the stability and security of water resources [6]. At the same time, reports indicate that most events influencing food production are tied to extreme weather occurrences, with high temperatures, droughts, and extreme precipitation being the leading causes of agricultural production losses. In addition, extreme weather has exacerbated the instability of the energy system. On the supply side, extreme weather impairs hydroelectric and wind power availability, resulting in power shortages. On the demand side, extreme weather, such as extremely high temperatures, exacerbates the demand for electricity and gas. Extreme weather poses a severe danger to the security of the water-energy-food nexus. Jiangsu Province, China's most significant economic province, has abundant water resources, is a major energy consumer, and produces a large amount of food. Due to its geographic location, the area experiences regular weather disasters. Compared to 2001-2010, the average number of rainstorm days has increased by 7%, and the average number of high-temperature days has risen by 4% in the past five years. Extreme weather events have occurred frequently, leading to issues such as hydrological changes and food production declines. These events have severely impacted the water-energy-food nexus in Jiangsu Province. Therefore, improving the collaborative security of the water-energy-food nexus in Jiangsu Province under extreme weather conditions is essential. Conducting scenario simulations and countermeasure simulations of the water-energy-food nexus in Jiangsu Province under extreme weather conditions is conducive to the sustainable utilization of resources and the sustainable development of the economy and has important theoretical and practical significance.
Since the Water-Energy-Food Nexus Security Conference in 2011, the notion of the “water-energy-food” nexus has constantly expanded, and research into it has progressed. The research focus has also evolved from the interaction of two elements to the coordinated balance and sustainable development of three elements, as well as the extension of the nexus. Two-element research focuses on water-energy, water-food, and energy-food systems. In terms of the water-energy system, the TIMES-Water model [7] and a reliability assessment model for micro water-energy networks based on a sequential Monte Carlo simulation (MCS) process [8] have been used to couple the energy system with the water resource system. These models have analyzed China’s future water resource demand and the reliability of water and power supply systems, respectively. Furthermore, a water-energy connection framework for water distribution networks [9] has been used to evaluate the potential for energy recovery utilizing micro-hydropower in water distribution networks. In terms of the water-food system, researchers mostly employ the Agro-Ecological Zones model [10], Life Cycle Assessment [11], Water Footprint method [11- 13], and Virtual Water method [14-16] to systematically analyze the relationship between regional water resource utilization and food production. Regarding the energy-food nexus, the Cobb-Douglas production function is used to analyze the relationship between national energy and food security [17]. Additionally, the Computable General Equilibrium (CGE) model [18] and the CoVaR-Copula model [19] are also applied to study the interdependencies and trade-offs between energy and food. Three-element research primarily focuses on utilizing various quantitative methods to assess the internal state characteristics of the water-energy-food nexus. Among them, the PSR model, the ESS coordination model, and the method based on the Modified Water Stress Index are used to assess the collaborative security of the nexus [20-22]. The coupling coordination degree and super-efficiency SBM models are employed to measure the nexus’ coupling coordination degree and coupling efficiency [23-26]. Moreover, Data Envelopment Analysis and the Water Footprint method are frequently used to calculate the input-output efficiency of the water-energy-food nexus system [27-29]. In addition, many scholars have expanded the water-energy-food nexus, and elements such as land [30, 31], ecology [32-35], and forest [36] have been added to the water-energy-food nexus. These studies have broadened the research perspective of the water-energy-food nexus and have certain reference significance.
As a complex system, the complexity of the water-energy-food nexus lies not only in its internally intricate feedback and interconnected relationships but also in the numerous external factors that influence it. Scholars have researched the external factors affecting the water-energy-food nexus from various perspectives, primarily encompassing socioeconomic and natural factors. In terms of socioeconomic factors, research endeavors predominantly revolve around factors such as population density, economic growth, industrial structure, and government policies [37-39]. In terms of natural factors, the research focus encompasses annual mean temperature, annual precipitation levels, environmental carrying capacities, vegetation indices [38, 40, 41], and so on. In addition, some scholars have analyzed the prominent issues of water resources, energy, and food pressure from the perspective of extreme weather [42]. Under the influence of these external factors, the water-energy-food nexus has become increasingly complex. To better comprehend the nexus, system dynamics has become an effective tool for studying and addressing the nexus. Based on the theoretical foundation of systems thinking, system dynamics incorporates computer simulation models to elucidate the tight interdependencies within the system according to the feedback characteristics of the mutually causal elements within the system [43]. This approach has yielded substantial results in the study of complex systems and is suitable for investigating the water-energy-food nexus. In existing research on the nexus using system dynamics, scholars mostly establish a W-E-F sustainable development framework from the economic, social, and environmental dimensions and construct a W-E-F Nexus causality network to simulate the water-energy-food nexus and predict future development trends of various resources [44-47]. Some scholars also take a policy perspective, depicting the processes of transmission and interaction of information flow, material flow, and policy flow between subsystems, and conduct policy simulations to explore the impact of different policies on the nexus [48-50].
Nowadays, system dynamics methodology has yielded abundant achievements in the research of the water-energy-food nexus, demonstrating its applicability and effectiveness in studying the nexus. These studies have facilitated a deeper understanding of the intricate interconnections within the water-energy-food nexus and aided relevant managers in recognizing the risks they confront. While useful, these studies have mostly focused on the impacts of social, economic, environmental, and policy factors on the nexus. Although some scholars have analyzed the impact mechanisms of extreme weather on the water-energy-food nexus and proposed corresponding governance pathways, further quantitative analysis and countermeasure simulations are still needed to better understand the effects of different extreme weather events on the nexus and to adopt effective countermeasures. This paper researches the water-energy-food nexus from the perspective of extreme weather. Firstly, it constructs a system dynamics model encompassing water, energy, food, extreme weather, the economy, and population, capturing the interaction processes among subsystems under extreme weather conditions. Secondly, it examines the collaborative security of the water-energy-food nexus from the perspective of sustainable supply and demand. Leveraging the advantages of scenario analysis of system dynamics, it conducts simulations under baseline scenarios and extreme weather scenarios for the collaborative security of the water-energy-food nexus in Jiangsu Province, quantifying the impact of extreme weather on the collaborative security of the nexus. Finally, countermeasure simulations are conducted under different extreme weather scenarios to quantify the effectiveness of various countermeasures in enhancing the collaborative security of the nexus in Jiangsu Province, and their effectiveness is ranked, which facilitates relevant departments in taking targeted measures to respond to extreme weather.
Materials and Methods
Overview of the Study Area
Jiangsu Province is located in the eastern coastal area of mainland China, bordered by 30°45′N to 35°20′N and 116°18′E to 121°57′E, with a total area of 107,200 Km2. Regarding water resources, Jiangsu Province spans the two major river systems, the Yangtze River and Huai River, with a dense river network and abundant water resources. Jiangsu Province’s average annual precipitation ranges from 782 to 1150 mm and decreases from southeast to northwest, with more precipitation in the southern part than in the northern part and more along the coast than inland. In terms of energy, Jiangsu Province is a significant energy consumer, with industrial energy consumption accounting for approximately 75% of the total energy consumption. However, the province severely lacks energy resources, with a small total energy production volume and relying primarily on external inputs, resulting in prominent contradictions between energy supply and demand. Concerning food, Jiangsu Province is a major grain producer, renowned as the “land of rivers and mountains, the hometown of fish and rice.” The total food production has remained stable at over 35 million tons, and the ability to ensure food security has continuously strengthened. With only 3.2% of the country’s cultivated land, Jiangsu produces 5.5% of the country’s total food. For climate, Jiangsu Province belongs to the East Asian monsoon climate zone, located in the transition zone between the subtropical and warm temperate climates. It is influenced by weather systems from the westerlies, subtropics, and low-latitude easterlies, resulting in frequent extreme weather events with a wide range of impacts. The main types of extreme weather include heavy rain, typhoons, floods, droughts, cold surges, and high temperatures. Meanwhile, the impacts and losses caused by extreme weather events are severe due to the province’s economic prosperity and dense population.
System Dynamics
The water-energy-food nexus is an interactive dynamic system formed by combining multiple factors, and the system dynamics method is an effective solution for studying such complex systems [51]. The system dynamics model studies the feedback systems’ structure and dynamic change processes [52]. It can present the logical relationship of resource flows, analyze the dynamic impact relationship between variables, and then study the nature of variables through system flowcharts. Selecting different scenario analysis variables allows us to clearly observe the impact of a variable’s change on other variables in the system flowchart [43]. Therefore, this paper uses system dynamics to construct a model of the water-energy-food nexus under extreme weather conditions, analyzes the collaborative security of the nexus system from the perspective of sustainable supply and demand, and carries out simulations of extreme weather scenarios and countermeasure simulations under extreme weather conditions.
System Boundaries
This paper’s system dynamics model of the water-energy-food nexus includes six key elements: water, energy, food, economy, population, and extreme weather. The spatial boundary of the system is Jiangsu Province, and the temporal boundary spans from 2002 to 2030 with a time step of one year. Considering data availability, 2021 is the final year to obtain complete data. As a result, the time for model operation and validation against real conditions is set from 2002 to 2021, with the prediction horizon set from 2022 to 2030.
System Structure Analysis
There are complex feedback relationships among the three resources in the water-energy-food nexus. Meanwhile, economic development and population changes are the main factors leading to dynamic changes in the nexus. Additionally, uncontrollable external factors, such as extreme weather, significantly affect the security of the nexus by altering the demand and supply of resources. Mitigating the contradictions between supply and demand for water, energy, and food and improving the level of supply and demand for these three resources are important ways to ensure the collaborative security of the water-energy-food nexus and achieve its sustainable development. Therefore, from the perspective of sustainable supply and demand, a system dynamics model of the water-energy-food nexus under extreme weather conditions is constructed.
In the nexus, the water subsystem is primarily composed of total water consumption and total water supply and is connected to the energy subsystem and food subsystem through industrial water use and agricultural water use, respectively. The energy subsystem mainly consists of energy supply and total energy consumption, and it is linked to the food subsystem through agricultural energy consumption. The food subsystem primarily comprises total food production and total food consumption. The supply and consumption of resources in each subsystem are connected through the supply-demand index. Meanwhile, economic development and population growth increase resource consumption and change the resource supply and demand situation. Economic development also affects research and development investment, thereby influencing reclaimed water supply and grain yield per unit area, further altering resource supply and demand. Additionally, extreme weather events in the system include extreme high temperatures, extreme precipitation, and extreme drought. The relevant variables are annual precipitation, the number of high-temperature days, the number of heavy rain days, and the number of drought days. Among them, extremely high temperatures increase the demand for cooling, resulting in a rise in household energy consumption and, as a result, total energy consumption, which impacts the supply and demand of the energy subsystem. Furthermore, extremely high temperatures may lower grain yields, impacting the supply and demand of the food system. Extreme precipitation may impact the amount of water resources available, affecting the supply and demand of the water system. The intensification of extreme precipitation will also negatively impact grain output, altering the supply and demand level of the food system. Extreme drought also impacts the amount of water resources, resulting in decreased available water supply and increased water consumption in agricultural production, affecting both the supply and demand of the water subsystem. Furthermore, dryness is one of the causes of lower grain output, which has a substantial impact on food supply and demand.
Results and Discussion
Simulation Prediction of Collaborative Security of Nexus under Extreme Weather Conditions
Data Source
The research data in this paper mainly come from the Jiangsu Statistical Yearbook, Jiangsu Water Resources Bulletin, China Energy Statistical Yearbook, China Light Industry Yearbook, and China Food Industry Yearbook from 2003 to 2022. Meteorological data are from the National Centers for Environmental Information (NCEI) under the National Oceanic and Atmospheric Administration (NOAA). All data has been calculated and organized.
Stock-and-Flow Diagram and Dynamic Equation
This paper uses the system dynamics software Vensim PLE to draw the stock-and-flow diagram of the model (Fig. 1). The model contains 58 variables, including 2 level variables, 2 rate variables, and 54 auxiliary variables. The main variables of the model are shown in Table 1.
This study adopts three methods to determine the dynamic equations of the model, which are:
(1) determining the equations based on the logical relationships between variables; (2) using linear regression and curve-fitting methods to determine the functional relationships between variables; and (3) referring to existing research [53, 54] to determine the equations. Table 2 lists the main dynamic equations of the model. It should be noted that when generating the resource supply-demand index, we drew on the research of other scholars [53], and after expert discussions, we believe that the three components in the water-energy-food nexus are equally important. Therefore, the weight of each component is set to 1/3.
Model Validation
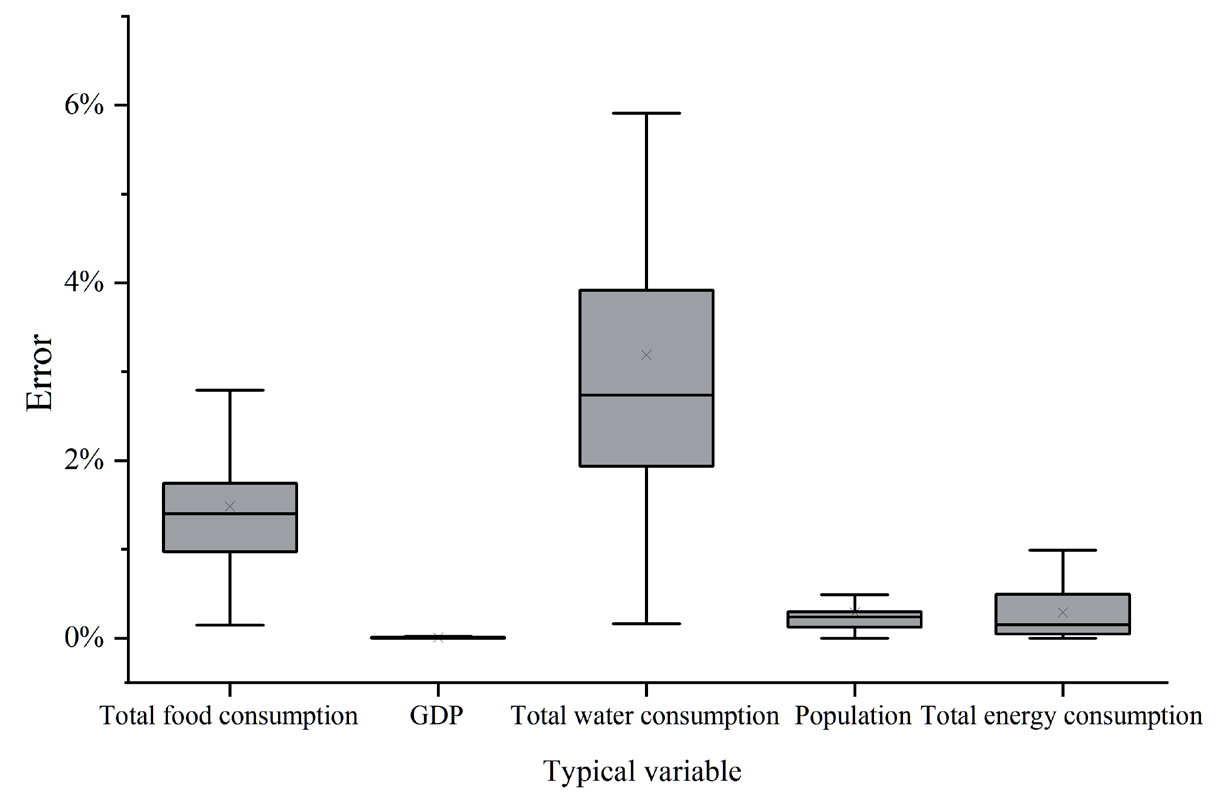
To ensure the validity of the system dynamics model established in this study, historical data from 2002 to 2021 were selected as a control group, and five typical variables, including total food consumption, total water consumption, total energy consumption, GDP, and population, were selected for historical data validation in this paper. The simulated values of the variables were compared with the actual values to calculate the error. The error calculation method is as follows: θ = |x̂ – x|/x × 100%, where θ is the model error, x̂ is the simulated value, and x is the actual value. The validation results are presented in a box plot, as shown in Fig. 2.
As shown in Fig. 2, except for the total water consumption error exceeding 5%, the errors of the other variables are all less than 3%. GDP and population have the best fitting effect, with errors within 1% for each year. Although the fitting effect of total water consumption is not as good as the other four variables, its average error is 3.19%, and the overall average error is within 3.5%. According to the research by Li et al. [44], when the error is around 5%, the model’s accuracy is considered good, and the model passes the validation.
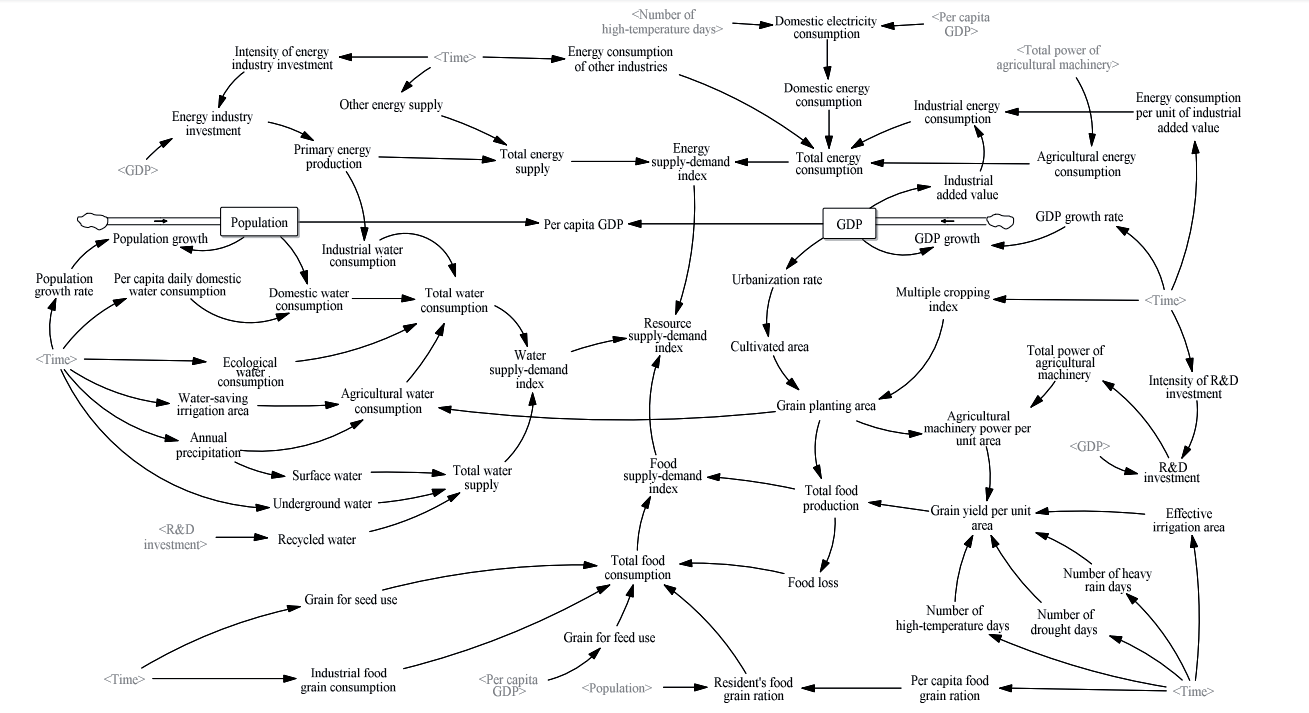
Table 1.
Model variables.
Table 2.
Main dynamic equations of the model.
Analysis of the Water-Energy-Food Nexus in Jiangsu Province from 2002 to 2021
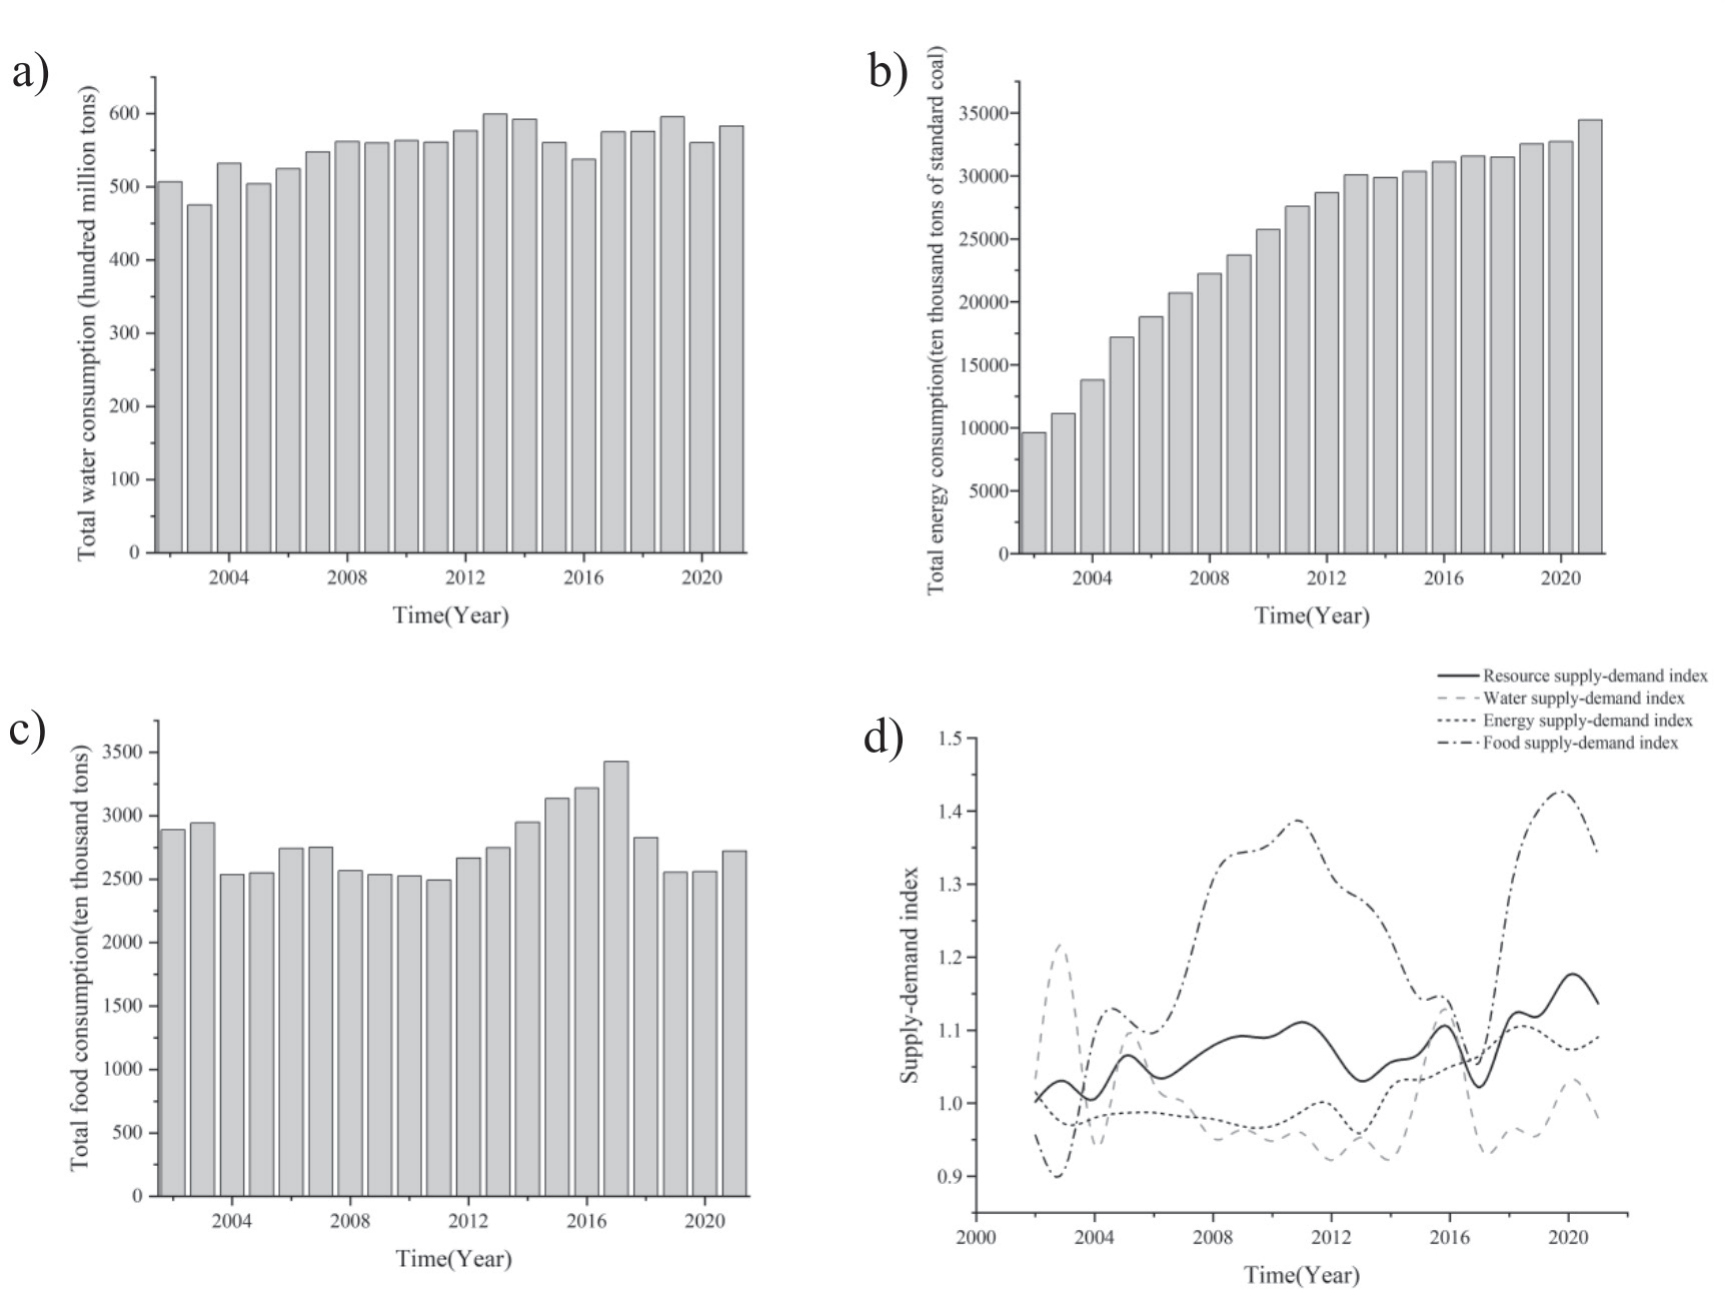
Using the system dynamics model constructed above, we analyzed the changing trends of the water-energy-food nexus in Jiangsu Province from 2002 to 2021 based on simulation results. As shown in Fig. 3, the total water consumption in Jiangsu Province remained stable between 47 and 60 billion tons from 2002 to 2021. Total energy consumption continued to increase, growing from 96.19 million tons of standard coal to 344.49 million tons of standard coal, with an average annual growth rate of 6.94%. The total food consumption fluctuated significantly, showing an overall trend of increasing and decreasing. This analysis indicates that the fluctuation in industrial food grain consumption, which is greatly influenced by policy, has become the main factor affecting the change in total food consumption. This finding is consistent with the conclusions of existing research [54]. From 2002 to 2021, the resource supply-demand index of the water-energy-food nexus in Jiangsu Province showed a fluctuating upward trend, rising from 1 to 1.14, indicating that supply gradually exceeded demand. Among them, the water supply-demand index fluctuated significantly, mainly due to rainfall, but the supply and demand of water resources basically maintained a balance. The energy supply-demand index rose from 0.95 to 1.1, maintaining a balance between supply and demand. The food supply-demand index was less than 1 in 2002- 2003, gradually rising to 1.34 afterward, indicating that Jiangsu Province currently enjoys good food security, which is consistent with the actual situation in Jiangsu.
Simulation of Extreme Weather Scenarios
Parameter Setting for Extreme Weather Scenarios
To explore the impact of three types of extreme weather on the collaborative security of the water-energy-food nexus in Jiangsu Province, this study established four weather scenarios: the baseline scenario, extreme high-temperature scenario, extreme precipitation scenario, and extreme drought scenario. Under these four scenarios, changes in the water-energy-food nexus in Jiangsu Province were observed. The specific parameter settings are shown in Table 3, and the scenarios are described as follows: (1) Baseline scenario: This study takes 2021 as the base year. According to the climate change trend in the “14th Five-Year Plan for Coping with Climate Change in Jiangsu Province”, the annual precipitation is projected to increase by 22.5 mm every ten years on average based on climate change trends. The annual precipitation in 2030 is estimated to be 1291.3 mm. Other parameters remain unchanged, serving as a comparison for the other scenarios; (2) Extreme high-temperature scenario: Climate warming accelerates, leading to frequent extreme high temperatures and an increase in the number of high-temperature days; (3) Extreme precipitation scenario: Annual precipitation increases, accompanied by more extreme precipitation events and an increase in the number of days with heavy rain;
(4) Extreme drought scenario: Drought conditions worsen, gradually reaching severe drought levels. Annual precipitation decreases, and the number of drought days increases. It should be noted that when setting the parameters for the relevant variables in this study, we referred to the Chinese standard GB/T 20481-2017 for meteorological drought classification. According to this standard, a drought is classified as severe when the annual precipitation is below 60% of the long-term average precipitation. Additionally, due to the uncertainty in the frequency of extreme weather events, the maximum values observed in historical years were selected when setting parameters to represent the intensification of extreme weather.
Table 3.
Parameter settings for relevant variables.
Analysis of Simulation Results for the Four Weather Scenarios
The simulation of extreme weather scenarios shows that different extreme weather conditions have varying degrees and aspects of impact on the security of the water-energy-food nexus in Jiangsu Province. The simulation results are shown in Fig. 4.
Under the baseline scenario, the resource supply-demand index of Jiangsu’s water-energy-food nexus is projected to show a downward trend from 2022 to 2030, indicating a gradual imbalance between supply and demand. Among them, the water supply-demand index remains relatively stable, ranging from 0.98 to 0.99, with demand slightly exceeding supply but basically maintaining a balance. The energy supply-demand index also exhibits a downward trend. In the first two years, the index is greater than 1, indicating that supply slightly exceeds consumption, but subsequently, a gap begins to emerge, with energy consumption far exceeding supply. Similarly, the food supply-demand index is downward but remains above 1. Although the index has declined, food supply and demand remain high, reflecting good food security.
Fig. 4.
The trend of the resource supply and demand level of the nexus in Jiangsu Province under extreme weather conditions. a) The trend of the resource supply-demand index, b) The trend of the water supply-demand index, c) The trend of the energy supply-demand index, d) The trend of the food supply-demand index.
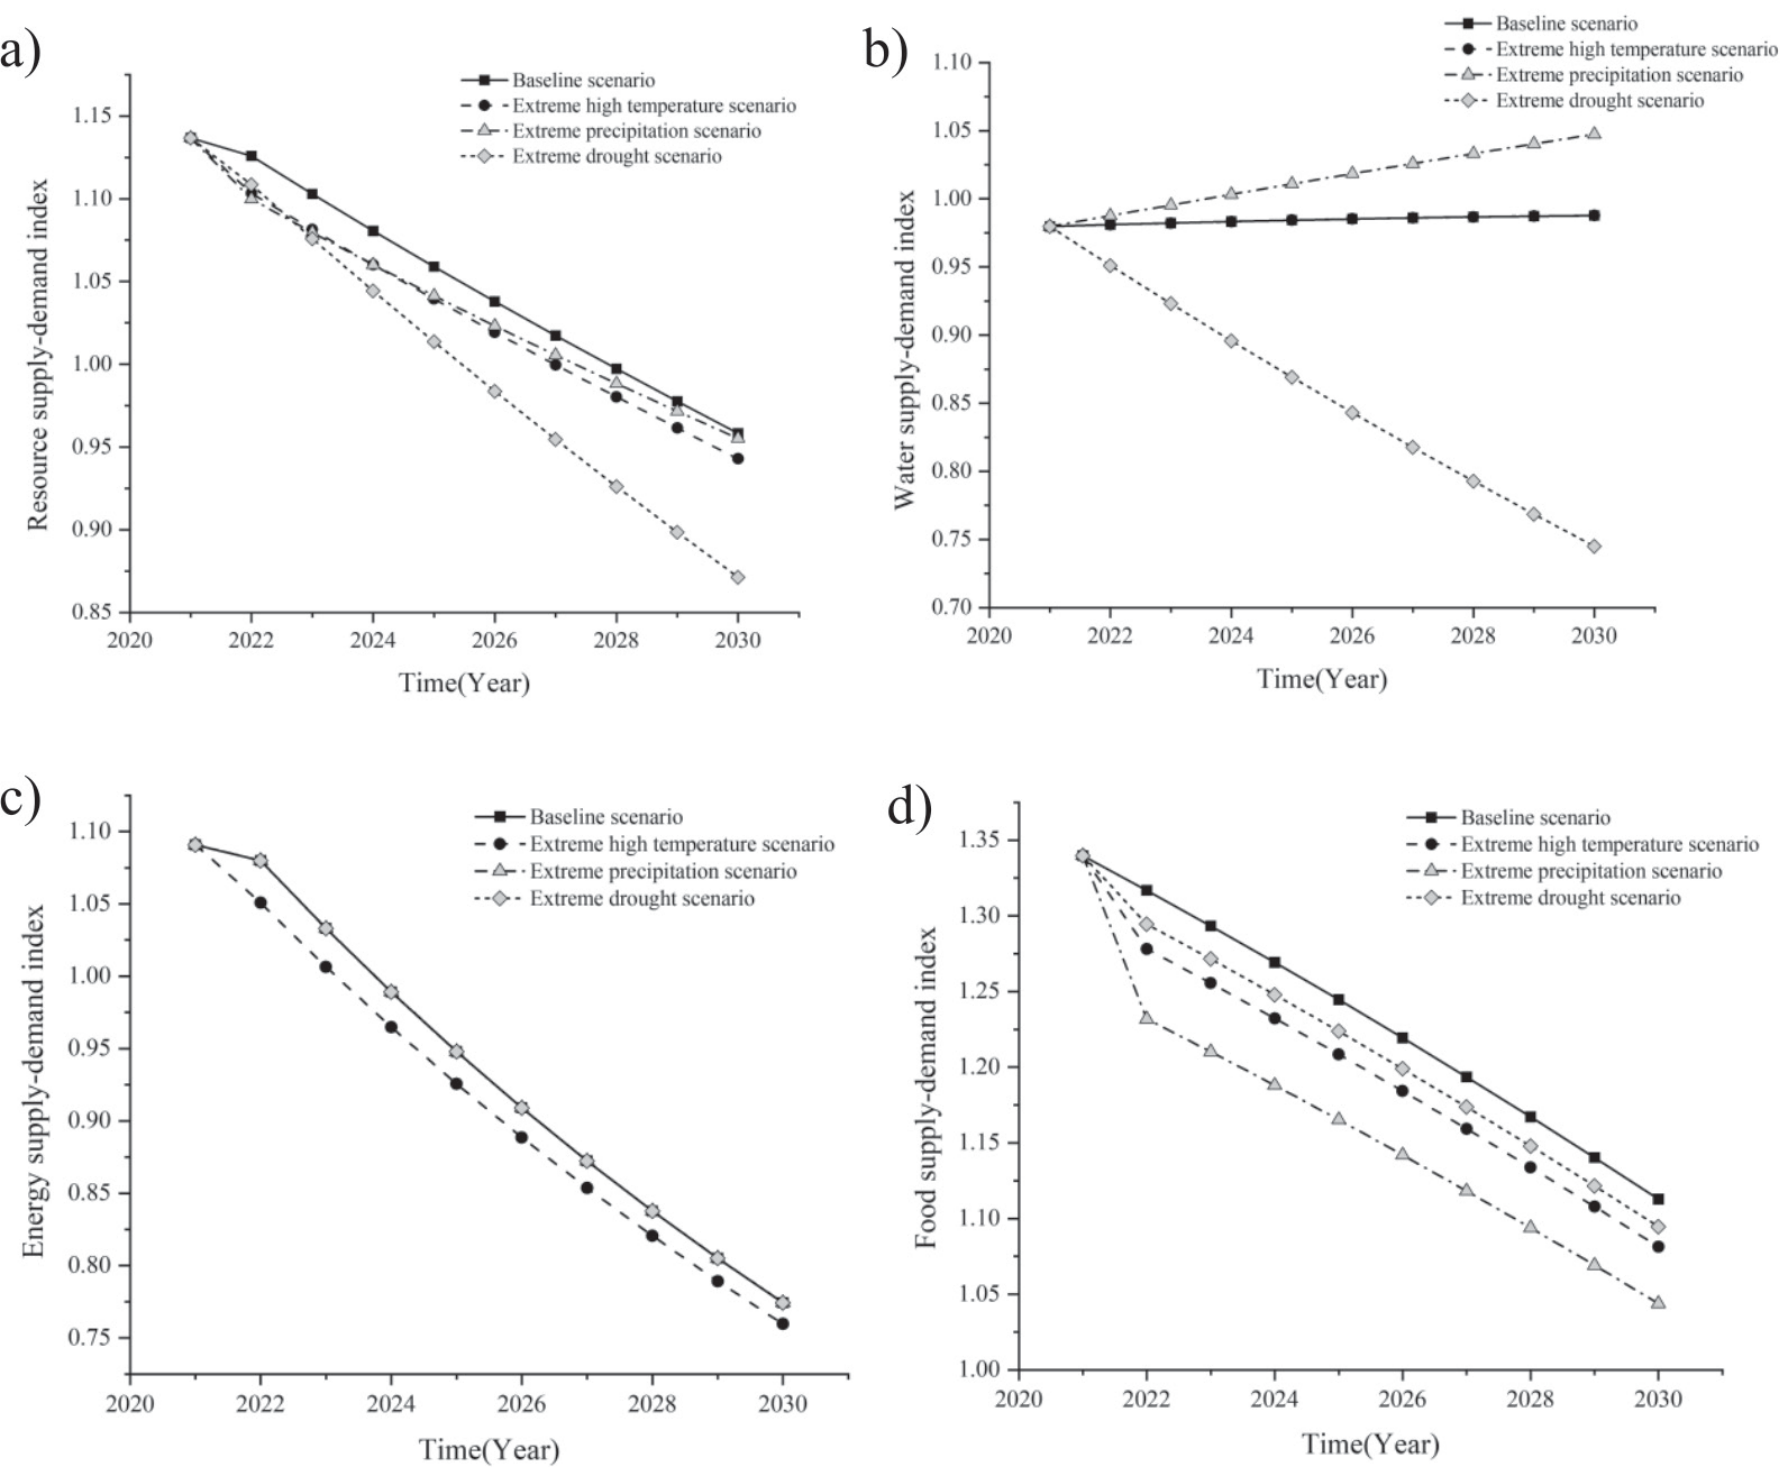
Under the extreme high-temperature scenario, the resource supply-demand index decreases by 1.60% compared to the baseline scenario. Both energy and food supply and demand are significantly affected, with the energy supply-demand index falling by 1.90% and the food supply-demand index falling by 2.82%. It is primarily attributed to the increased demand for cooling energy during high temperatures, leading to a rise in total energy consumption and a subsequent decrease in the energy supply-demand index. Simultaneously, high temperatures also impact food yields, resulting in decreased food production and a lower food supply-demand index.
Under the extreme precipitation scenario, the resource supply-demand index decreases by 0.32% compared to the baseline scenario. Significant changes are observed in water and food supply and demand. Specifically, the water supply-demand index rose by 6.04%, while the food supply-demand index fell by 6.20%. It is primarily due to the increased water supply capacity resulting from higher precipitation, which reduces agricultural water consumption and alleviates the pressure on water supply and demand. However, the increased intensity of precipitation, particularly heavy rain, significantly impacts agricultural production, decreasing food yields and reducing the food supply-demand index.
Under the extreme drought scenario, the resource supply-demand index decreases by 9.07% compared to the baseline scenario. Water and food supply and demand are significantly affected, with the water supply-demand index falling by 24.57% and the food supply-demand index falling by 1.63%. This is primarily due to severe drought conditions, where annual precipitation is only 60% of the long-term average, significantly reducing the water supply capacity. At the same time, drought leads to increased agricultural water consumption, further exacerbating the pressure on water supply and demand. Frequent droughts also result in lower food yields, decreasing the food supply-demand index.
Countermeasure Simulation under Extreme Weather Scenarios
To seek effective measures to address extreme weather conditions, this study simulated countermeasures for the security of Jiangsu’s water-energy-food nexus under three different extreme weather scenarios. The simulation focused on regulating from one or both of the supply and demand sides to design countermeasures and assess whether they improved the collaborative security of Jiangsu’s water-energy-food nexus.
Countermeasure Design
Based on the simulation of extreme weather scenarios in the previous section, extremely high temperatures significantly impact the energy and food subsystems. Therefore, countermeasures are designed specifically for these two subsystems. The countermeasure design is as follows:
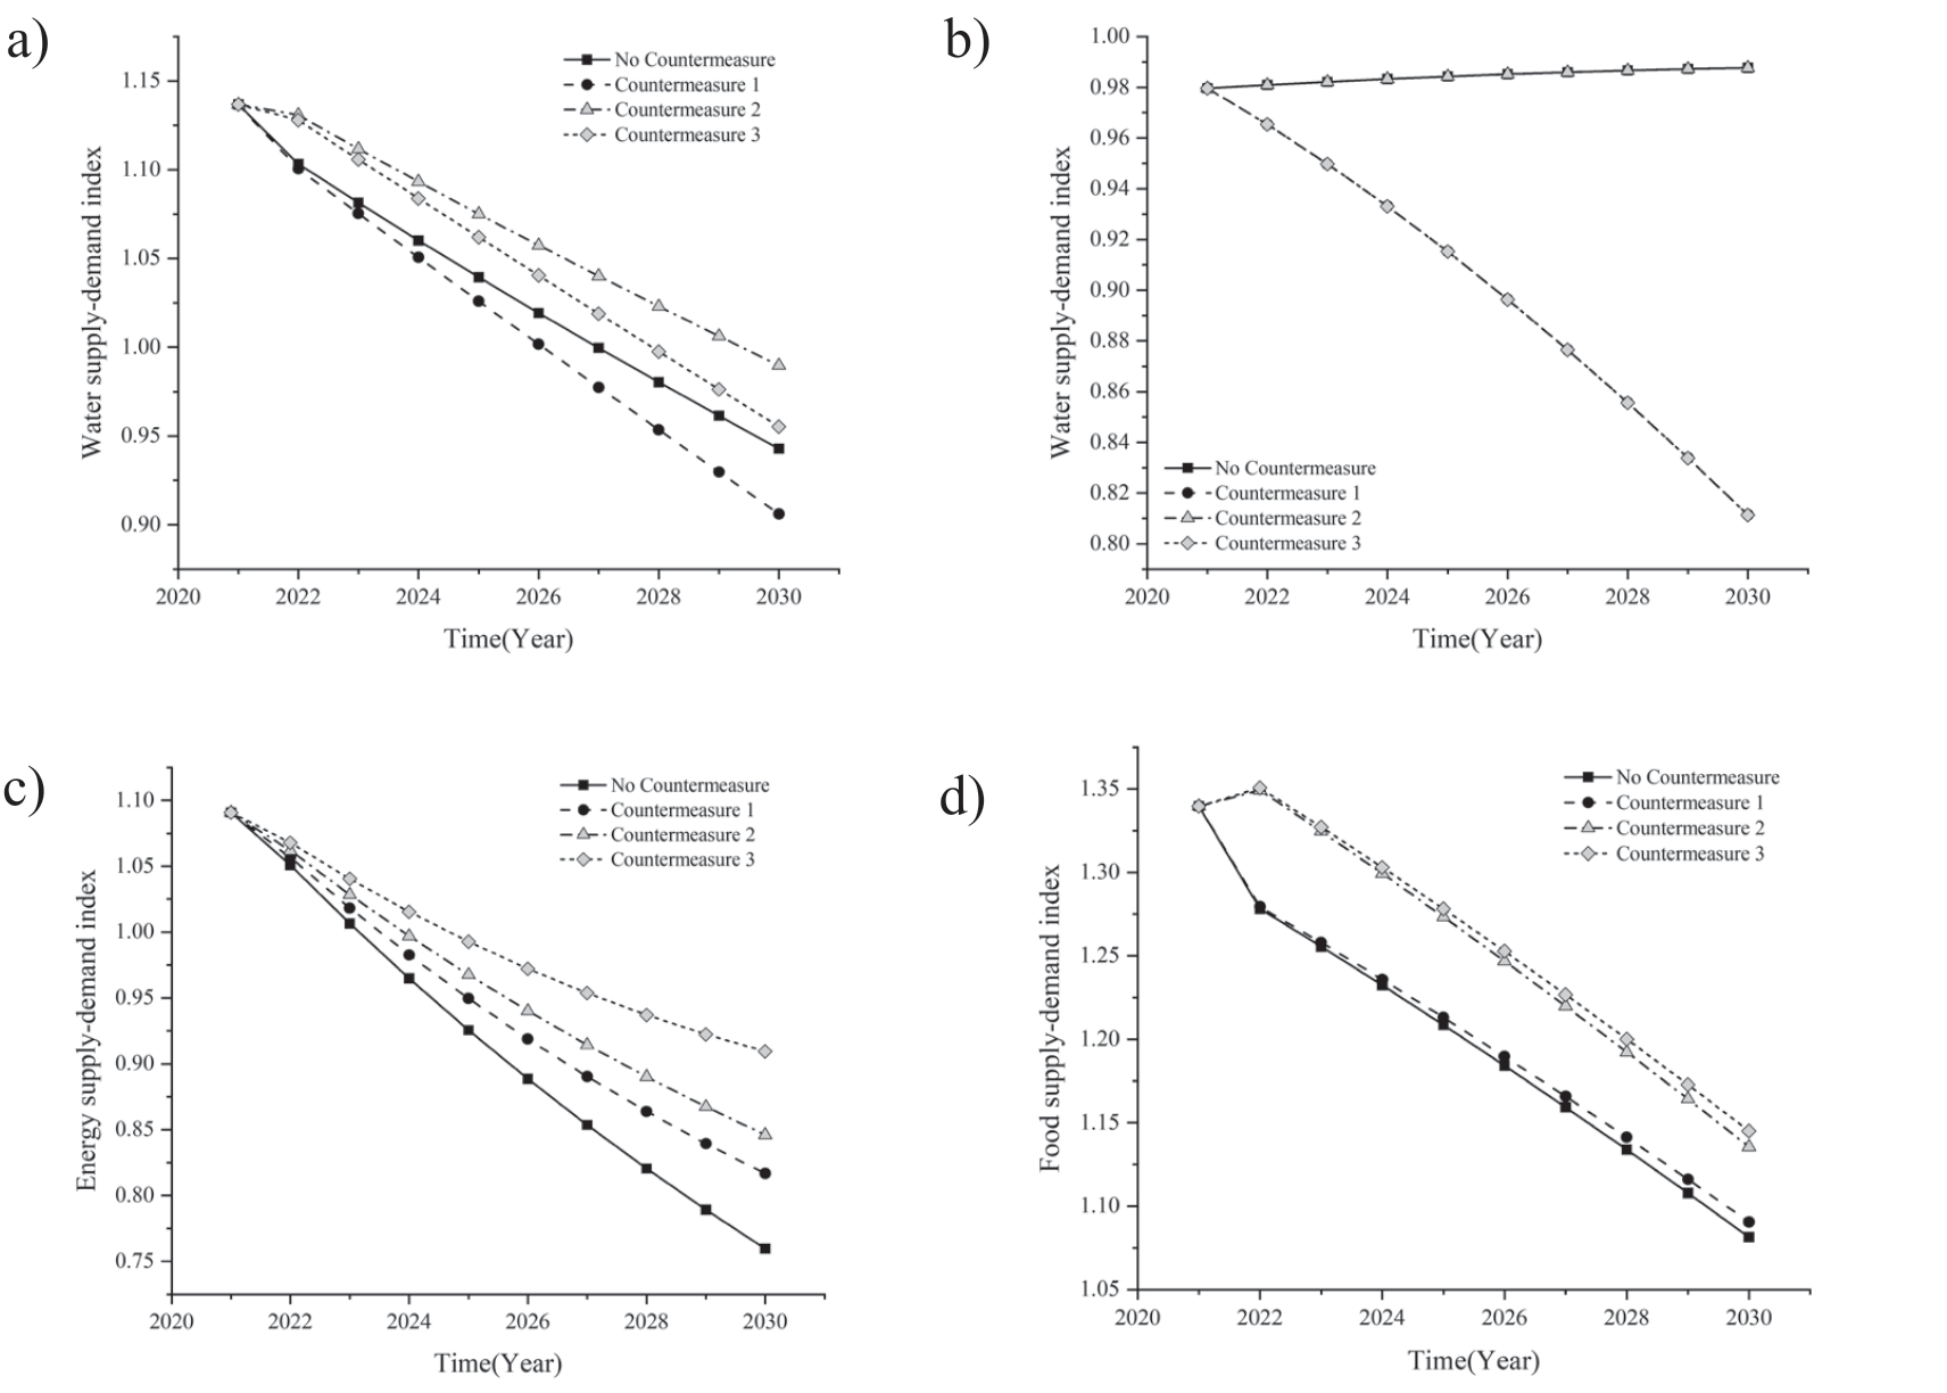
Countermeasure 1: Regulate from the supply side by increasing investment in R&D and enhancing scientific research support to improve the use of agricultural machinery, intensify equipment scheduling, and enhance food production. At the same time, investment in the energy industry should be increased to boost primary energy production. The regulatory variables are the intensity of R&D investment and the intensity of energy industry investment. The intensity of R&D investment is set to increase by an average of 0.068% annually, and the intensity of investment in the energy industry is set to reach its historical peak by 2030. When setting the parameters for this scenario, reference was made to the “14th Five-Year Plan for Scientific and Technological Innovation in Jiangsu Province”, which aims to increase R&D investment to account for 3.2% of the region’s GDP by 2025.
Countermeasure 2: Regulate from the demand side by promoting food conservation to reduce food waste rates and lowering energy consumption per unit of industrial added value to decrease overall energy consumption. The regulatory variables are per capita food grain ration and energy consumption per unit of industrial added value. The parameter for the per capita food grain ration is set to the minimum value from historical years, and energy consumption per unit of industrial added value is set to decrease by an average of 0.00815% annually. This scenario’s parameter settings are based on the “Jiangsu Province’s 14th Five-Year Plan” Implementation Opinions on Energy Conservation for the Entire Society,” which aims to reduce energy consumption per unit of industrial added value by 17% compared to 2020 levels during the “14th Five-Year Plan” period.
Countermeasure 3: Regulate from both the supply and demand sides by combining Countermeasure 1 and Countermeasure 2.
Analysis of Countermeasure Simulation Results
The results of the countermeasure simulation under extremely high temperatures are shown in Fig. 5. The ranking of the resource supply-demand index from high to low is Countermeasure 2 > Countermeasure 3 > No Countermeasure > Countermeasure 1. Among the three countermeasures, both Countermeasure 2 and Countermeasure 3 can improve the resource supply-demand index, while Countermeasure 1 reduces it. Countermeasure 3 is the most effective in increasing the supply-demand index for energy and food, but the water supply-demand index decreases significantly under this countermeasure. The main reason is that although primary energy production has increased, relieving the pressure on energy supply and demand, a large amount of water is consumed in energy production, causing considerable pressure on water supply and demand. Countermeasure 2 is less effective than Countermeasure 3 in improving the energy and the food supply-demand indexes, but it does not affect the water supply and demand. Therefore, overall, adopting Countermeasure 2 under extremely high temperatures is the most effective way to improve the resource supply and demand level of the water-energy-food nexus in Jiangsu Province.
Countermeasure Design
Based on the previous section’s analysis of extreme weather scenarios, extreme precipitation significantly impacts the food subsystem. Therefore, countermeasures are explicitly designed for the food subsystem. The countermeasures are as follows:
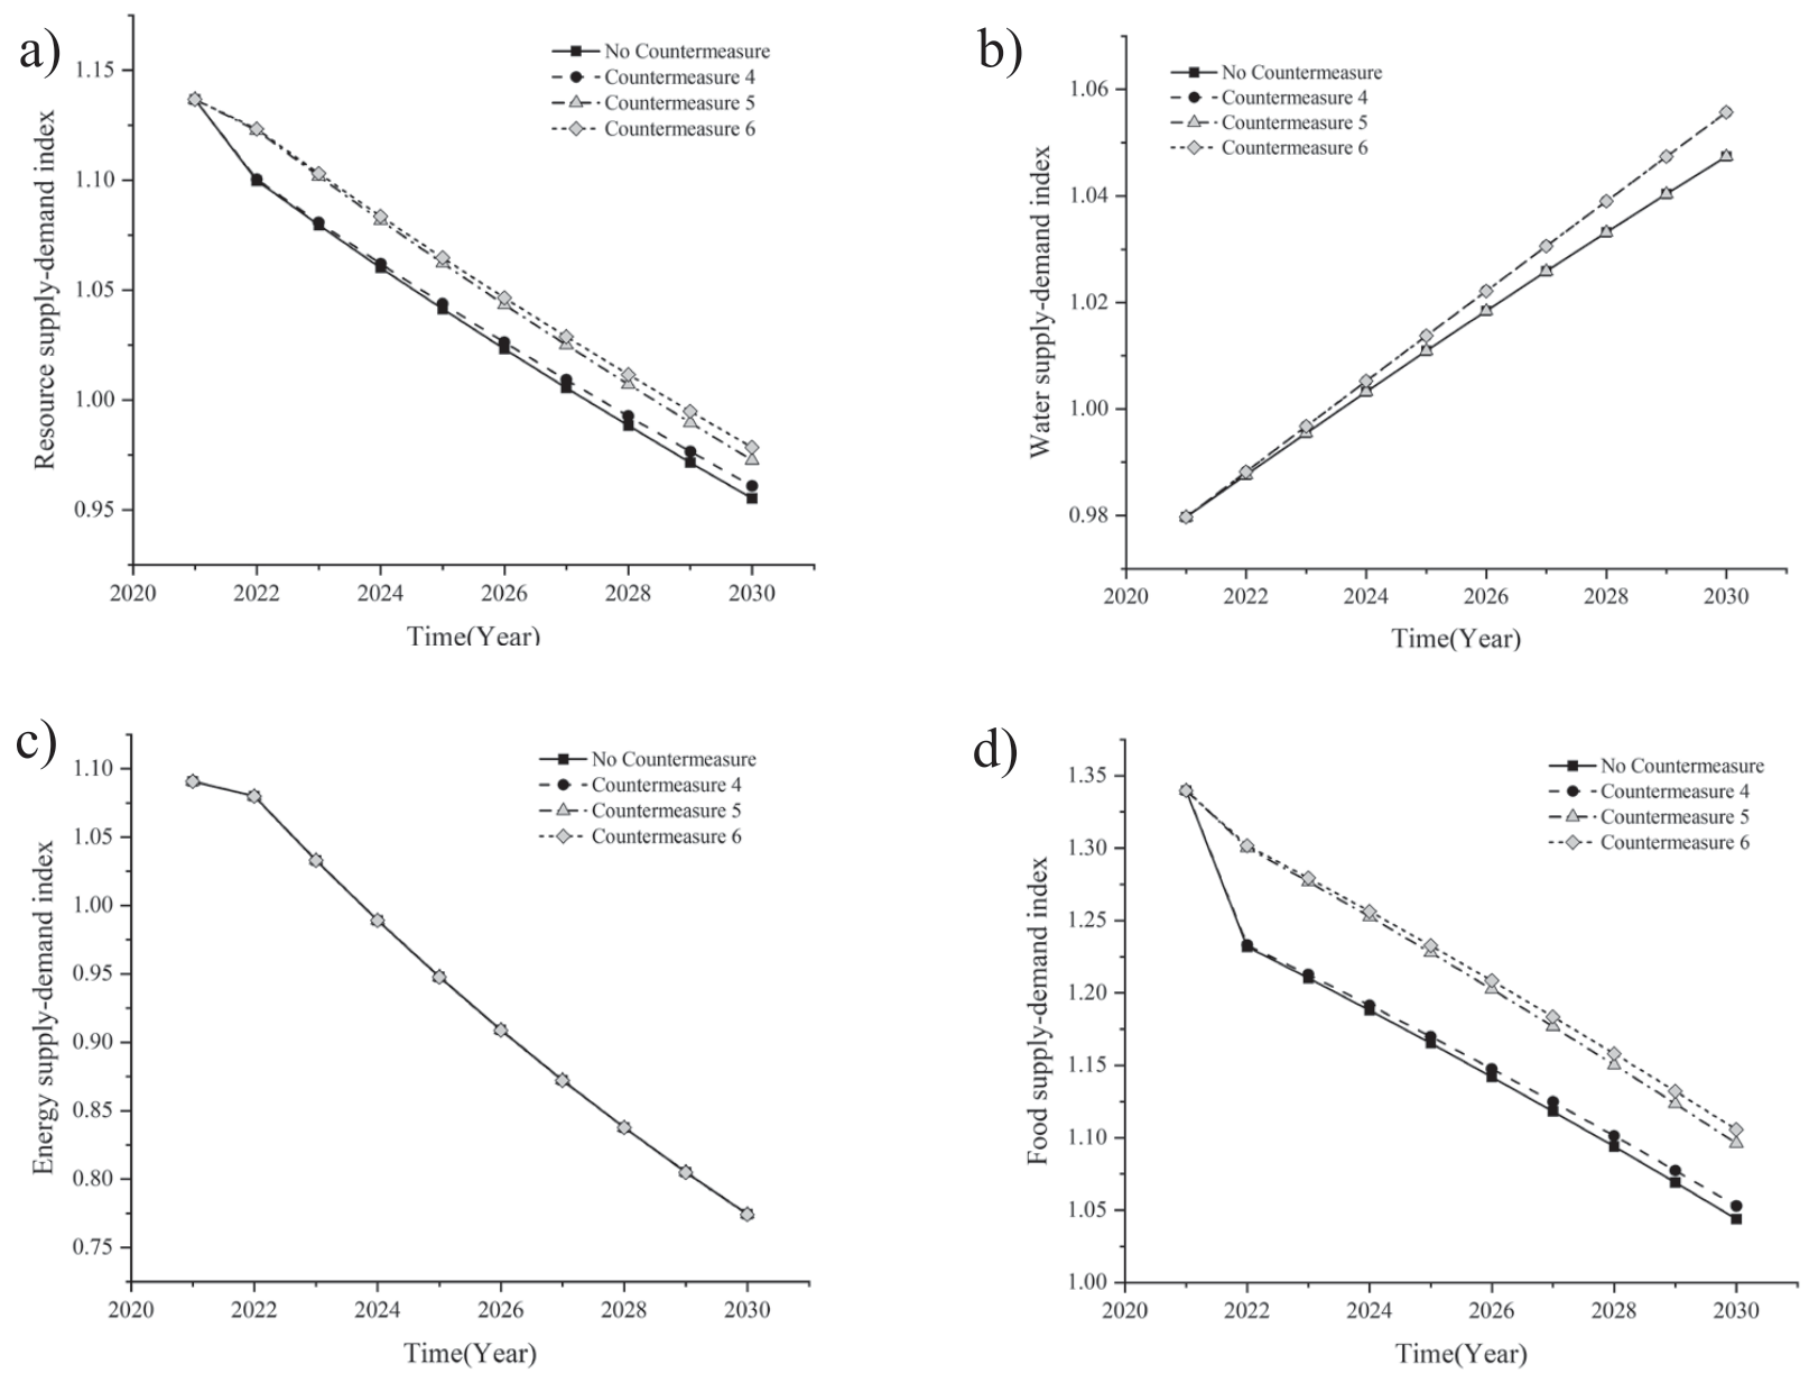
Countermeasure 4: Regulate from the supply side by increasing R&D investment, enhancing scientific research support, improving the use of agricultural machinery, especially irrigation and drainage machinery, and promptly removing waterlogging to increase grain yields per unit area. The regulatory variable is the intensity of R&D investment, which is set to increase by an average of 0.068% annually. The parameters for this scenario were set, referencing the “14th Five-Year Plan for Scientific and Technological Innovation in Jiangsu Province”.
Countermeasure 5: Regulate from the demand side by focusing on personal life, saving food, and reducing food waste rates. The regulatory variable is the per capita food grain ration, which is set to the minimum value of historical years.
Countermeasure 6: Regulate from both the supply and demand sides by combining Countermeasure 4 and Countermeasure 5.
Analysis of Countermeasure Simulation Results
The results of the countermeasure simulation under extreme precipitation are shown in Fig. 6. The ranking of the resource supply-demand index from high to low is as follows: Countermeasure 6 > Countermeasure 5 > Countermeasure 4 > No Countermeasure. All three countermeasures can improve the resource supply-demand index. Under Countermeasure 4, the water and the food supply-demand indexes increase, while the energy supply-demand index decreases slightly. The improvement in the food supply-demand index is relatively small, possibly due to the limited effectiveness of solely using agricultural machinery for waterlogging control under extreme precipitation conditions. Combining it with water conservancy projects for flood control and waterlogging elimination would be more effective. Additionally, using agricultural machinery can increase agricultural energy consumption, affecting the energy supply-demand index. However, since agricultural energy consumption accounts for a relatively low proportion of total energy consumption, this impact can be almost negligible. Under Countermeasure 5, the water and the energy supply-demand indexes remain unchanged, while the food supply-demand index improves and outperforms Countermeasure 4. Under Countermeasure 6, both the water and the food supply-demand indexes increase, outperforming the other countermeasures, and the slight decrease in the energy supply-demand index can be almost negligible. Therefore, overall, Countermeasure 6 is the most effective in improving the resource supply-demand index of the nexus under extreme precipitation conditions.
Countermeasure Design
Based on the analysis of extreme weather scenarios in the previous section, it is evident that extreme drought has a significant impact on the water resources and food subsystems. Therefore, countermeasures are designed specifically for these two subsystems. The countermeasures are outlined as follows:
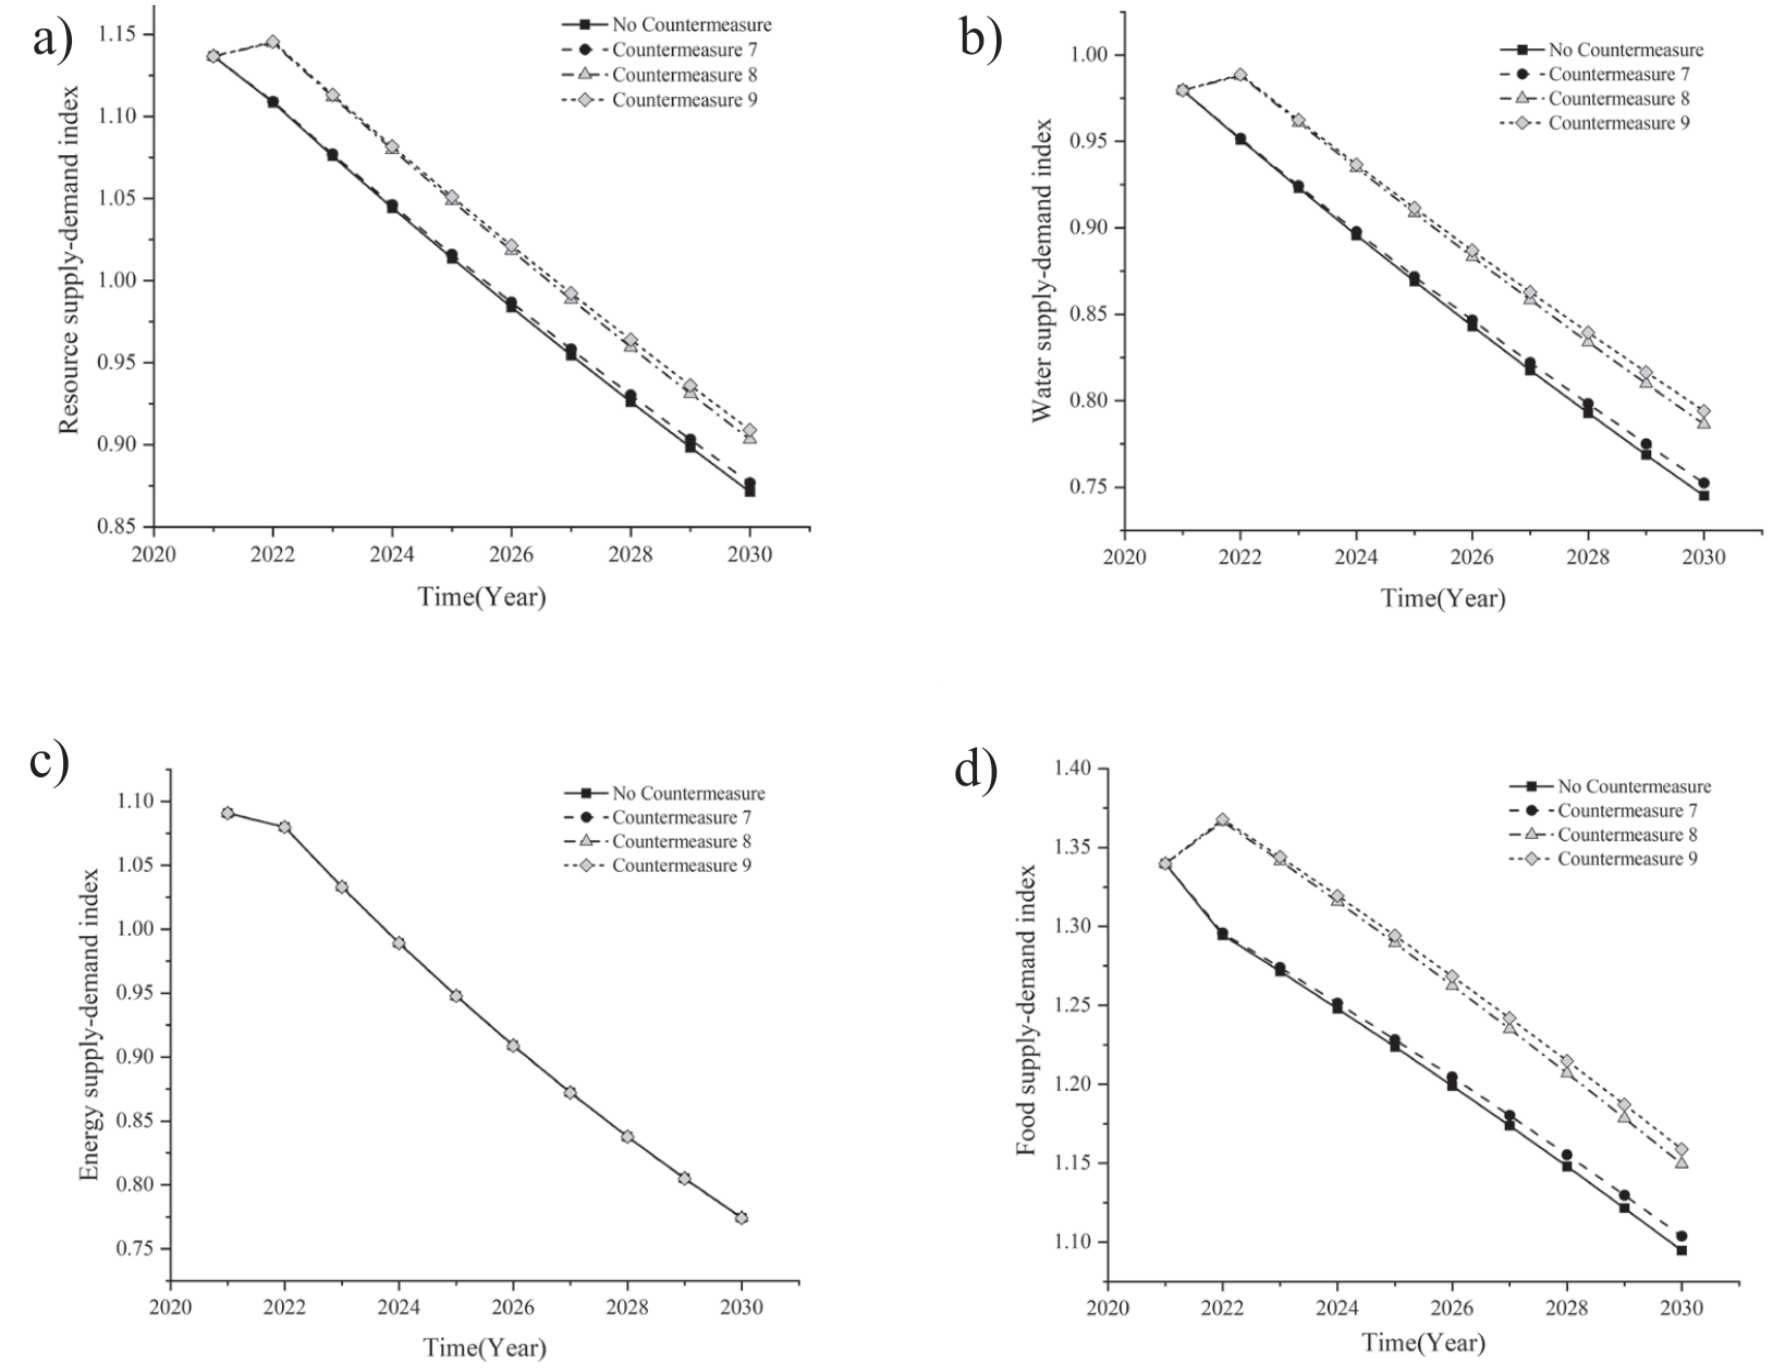
Countermeasure 7: Regulate from the supply side by increasing R&D investment to enhance the use of agricultural machinery to improve grain yields per unit area and increase the utilization of recycled water to enhance water resource utilization efficiency. The regulatory variable is the intensity of R&D investment, which is set to increase by an average of 0.068% annually. The parameters for this scenario were set, referencing the “14th Five-Year Plan for Scientific and Technological Innovation in Jiangsu Province”.
Fig. 6.
Results of countermeasure simulation under extreme precipitation scenario. a) The trend of the resource supply-demand index, b) The trend of the water supply-demand index, c) The trend of the energy supply-demand index, d) The trend of the food supply-demand index.
Countermeasure 8: Regulate from the demand side by focusing on personal lifestyle changes. Encourage water conservation and food conservation. In addition, the area of water-saving irrigation should be increased to reduce agricultural water consumption. The regulatory variables include per capita daily domestic water consumption, per capita food grain ration, and water-saving irrigation area. The parameters for per capita daily domestic water consumption and per capita food grain ration are set to their historical minima. The water-saving irrigation area is set to increase by an average of 82.3 thousand hectares annually. This scenario’s parameters were established based on Jiangsu’s “Opinions on Strengthening the Construction and Management of Rural Water Conservancy in the Province”, which aims to add 5.5 million mu (about 3.67 million hectares) of water-saving irrigation area during the “14th Five-Year Plan” period.
Countermeasure 9: Regulate from both the supply and demand sides by combining Countermeasure 7 and Countermeasure 8.
Analysis of Countermeasure Simulation Results
The results of the countermeasure simulation under extreme drought conditions are shown in Fig. 7. The ranking of the resource supply-demand index from high to low is Countermeasure 9 > Countermeasure 8 > Countermeasure 7 > No Countermeasure. All three countermeasures can improve the resource supply-demand index. Under Countermeasure 7, both the water and the food supply-demand indexes increase slightly, while the energy supply-demand index decreases slightly, but this decrease is almost negligible. The slight increase in the water and the food supply-demand indexes may be because although increasing R&D investment can enhance the utilization of reclaimed water, the supply of reclaimed water only accounts for a small proportion of the total water supply, so relying solely on it has limited effectiveness. Additionally, in extreme drought conditions, using agricultural machinery to increase food production has limited effectiveness, and it is more effective to combine it with improving irrigation methods and increasing the effective irrigated area. Under Countermeasure 8, both the water and the food supply-demand indexes improve, which is better than that of Countermeasure 7. The energy supply-demand index remains unchanged. Under Countermeasure 9, the water and the food supply-demand indexes increase significantly compared to other countermeasures, and the decrease in the energy supply-demand index is negligible. Overall, under extreme drought conditions, Countermeasure 9 is more effective in improving the level of the resource supply and demand of the nexus.
Suggestions
Extreme weather events are both sudden and catastrophic, having multifaceted impacts on the water-energy-food nexus. Different extreme weather events affect the nexus in various ways, necessitating tailored regulatory measures from various departments based on actual conditions to ensure the sustainable development of the water-energy-food nexus in Jiangsu Province.
Under extremely high temperatures, it is recommended that Jiangsu Province adopt demand-side regulatory measures. Jiangsu can mitigate the pressure on resource supply and demand by conserving resources, reducing food waste, and decreasing energy consumption per unit of industrial added value. Although supply-side regulation can also alleviate the pressure on energy and food supply and demand, this approach requires significant water resources for energy production, putting pressure on water supply and demand. Therefore, Jiangsu Province should develop energy resources appropriately and establish a reasonable relationship between energy security and water resource utilization.
Under extreme precipitation, it is recommended that both the supply and demand sides be regulated. Increasing research and development investment and conserving food can help alleviate food supply and demand pressure. Although both the supply side and the demand side regulation can improve the resource supply-demand index, relying solely on the supply side regulation, for example, using agricultural machinery to increase food production, has limited effectiveness. Cooperating with water conservancy projects for flood control and waterlogging prevention is necessary to ensure food production.
Under extreme drought, it is advisable to regulate both the supply side and the demand side. It can be achieved by increasing research and development investment, conserving water and food, and increasing the area of water-saving irrigation to alleviate the pressure on resource supply and demand. Although supply-side regulation can increase the utilization of reclaimed water, the supply of reclaimed water only accounts for a small proportion of the total water supply, limiting it in relieving the pressure on water supply and demand. Additionally, using agricultural machinery under extreme drought conditions has limited effectiveness in increasing food production, and combining it with improving irrigation methods and increasing the effective irrigated area may be more effective in boosting food production.
Finally, among the three types of extreme weather, extreme drought significantly impacts the collaborative security of the water-energy-food nexus in Jiangsu Province. Therefore, Jiangsu Province should pay more attention to this type of extreme weather when conducting monitoring and early warning, developing countermeasures, planning to ensure the collaborative security of the water-energy-food nexus, and achieving its sustainable development.
Conclusions
Compared with existing studies that focus on predicting future demand for water, energy, and food under different socioeconomic development conditions, this paper takes an extreme weather perspective. It employs system dynamics methods to construct a system dynamics model of the water-energy-food nexus under extreme weather conditions. Firstly, it analyzes the current status of the water-energy-food nexus in Jiangsu Province from 2002 to 2021. Secondly, it simulates the resource supply and demand situation of the nexus in Jiangsu Province from 2022 to 2030 under the baseline scenario and three extreme weather scenarios to predict the degree of collaborative security of the nexus and explore the impact of different extreme weather events on the security of the water-energy-food nexus in Jiangsu Province. Finally, based on this, countermeasures are designed and simulated for different extreme weather scenarios, focusing on regulation from one or both of the supply side and demand side.
The main conclusions are as follows:
(1) The three types of extreme weather have varying degrees and aspects that impact the security of the water-energy-food nexus in Jiangsu Province. Extreme drought has the most significant impact on the collaborative security of the water-energy-food nexus in Jiangsu Province, followed by extremely high temperatures, and extreme precipitation has the smallest impact. Among them, extreme high temperature mainly affects the energy and food subsystems, extreme precipitation affects the food subsystem, and extreme drought mainly affects the water and food subsystems.
(2) The most suitable countermeasures differ under different extreme weather conditions. Under extremely high temperatures, regulating from the demand side is most effective in enhancing the security of the water-energy-food nexus in Jiangsu Province. However, under extreme precipitation and extreme drought, regulating from both the supply and demand sides is more effective in improving the security of the water-energy-food nexus in Jiangsu.
Compared to existing research, this paper demonstrates a certain degree of innovation in theory and practice. In terms of theory, this paper takes an extreme weather perspective to research the water-energy-food nexus, adopts system dynamics methods, and constructs a system dynamics model of the water-energy-food nexus under extreme weather conditions. This model is then applied to Jiangsu Province to study simulations of extreme weather scenarios and countermeasure simulations under extreme weather conditions, broadening the research perspective of system dynamics in the study of the water-energy-food nexus. In terms of practice, compared to existing studies that propose countermeasures solely from a qualitative analysis perspective, this paper utilizes system dynamics to conduct countermeasure simulation studies. The effectiveness of various countermeasures in improving the collaborative security of the nexus is quantified through quantitative analysis, and the effectiveness is ranked according to the simulation results, which may provide better references for relevant departments to take targeted measures to respond to extreme weather.
In this study, we constructed a system dynamics model for the water-energy-food nexus under extreme weather conditions and simulated and predicted the changes in the collaborative security of the nexus under different extreme weather scenarios. In the future, we will focus more on monitoring extreme weather to estimate the frequency of extreme weather events with greater precision and further update our research to obtain more accurate results. Additionally, while conducting our research, we did consider compound extreme weather scenarios. However, due to the complexity of the compound extreme weather’s impact mechanisms on the nexus, the system dynamics model temporarily cannot represent them well. In the future, we will prioritize the prediction of compound scenarios in our research work and further improve our study.

