

Introduction
The CPAs is currently under development, with a system in place that focuses on national parks, supported by nature reserves and supplemented by nature parks. This approach places an increasing and should be regarded as co-first authors. ##These authors contributed equally to this work. emphasis on the positive role of ESs. ESs refer to the natural environmental conditions and utilities created and maintained by ecosystems, encompassing both direct and indirect benefits for humans derived from these ecosystems. ESs play a crucial role in the sustainable resource use and management of ecosystems [1-3]. NRs play a fundamental role in the remodeling stage of CPAs. ESs, as vital areas for ecosystem protection, should not be overlooked in the development of protective measures and land use decisions [4, 5]. The implementation of conservation policies leads to diverse changes in land-use, which in turn impacts ecosystem processes and functions. As a result, there are modifications in the supply of ESs, altering their trade-offs and synergistic relationships among them [6- 9]. Consequently, it becomes increasingly important to analyze these trade-offs or synergies among ESs when making decisions about conservation measures and land use within NRs [10]. With the gradual development of China’s ecological civilization and the establishment of CPAs, various measures for ecological protection and restoration are being implemented. These measures include converting farmland to forests, wetlands, and implementing ecological migration. The objective of these actions is to address issues associated with human activities and ecological restoration, resulting in substantial changes in land use patterns and the supply of ESs within NRs [11]. Therefore, analyzing land-use changes and the supply of ESs under various policy scenarios, as well as investigating the response of ES trade-offs and synergies, can provide scientific support and guidance in the formulation of conservation policies and spatial decision-making in China’s NRs.
Land-use changes resulting from ecological protection policies have a direct impact on ESs and their trade-offs/synergistic relationships [12]. Current research on land use and ESs primarily focuses on ES value and models. Firstly, the ESs value equivalent factor method [13] is used to analyze the characteristics of land-use changes in different regions during various historical periods, along with their effects on ESs value [14]. Additionally, researchers investigate the main influencing factors leading to these changes [15]. Secondly, various land-use models, such as the SD model [16] or CLUE-S model [17], are employed to simulate future land-use patterns in order to study changes of ESs and their trade-offs/synergies, while also analyzing the driving mechanisms behind them [18]. Discussions on spatial strategies or decision-making policies are also a focus of this research [19-21]. Studies on land-use changes and their impact on ESs values and tradeoffs are crucial and highly relevant to policy-making [22], ESs management [23], and future sustainable development [24]. These studies play a significant role in diverse ecosystems such as forest, wetland, urban areas, and coastal areas [25-28]. The requirements for ecological protection policies and governance measures in different functional zones with NRs differ from land-use objectives, resulting in various land-use scenarios, simulated based on the implementation requirements of conservation measures, and are critical for assessing the spatial decision-making impacts through evaluating changes in ESs supply and trade-offs relationships. However, despite being particularly crucial during the current adjustment phase of China’s NRs, relevant research in this area remains limited.
SJLNNR is committed to conserving habitats for rare waterfowl. It was incorporated into The Convention on Wetlands of International Importance Especially as Waterfowl Habitat (The Ramsar convention) in 2015, marking it the only internationally influential wetland in Anhui Province. Additionally, SJNNR plays a crucial role in the future “carbon-neutral” planning for Chizhou City. Its favorable environment and strategic location make it an important area for human settlement and agricultural production. Over time, the region has developed a tradition of reclaiming land from lakes, resulting in the establishment of numerous villages and farmland surrounding Shengjin Lake. As a result, a significant population resides in this area, leading to an increasing demand for ESs such as food, clean water, and ecosystem well-being. Nevertheless, this situation presents considerable challenges, as human activities vie for living space with endangered waterfowl. The challenge faced by authorities in formulating conservation and development policies lies in striking a balance between protecting habitats of rare waterfowl and meeting demands of local residents for ESs and improved quality of life. This pivotal issue is crucial for the success of policy-oriented spatial decision-making and is a prevailing concern in China’s NRs. To address this challenge, we have conducted scenario-based simulation studies on the effects of policy-driven land-use changes on ESs in SJLNNR, and employed Pearson’s correlation analysis to assess the trade-offs and relationships among ESs. The objective of this study is to provide support for future spatial decision-making regarding land use in the management of SJLNNR. Our research primarily focuses on three aspects: (1) We set baseline scenarios (BS), core protection scenarios (CPS), and FPS (extremely idealized scenarios) based on policy requirements for analyzing land use changes.
(2) We assess the extent to which these changes enhance the supply of typical ESs. (3) We also evaluate the tradeoffs associated with ESs across various scenarios and analyze the characteristics of each scenario in relation to any pair of ESs.
Methods
Study Area
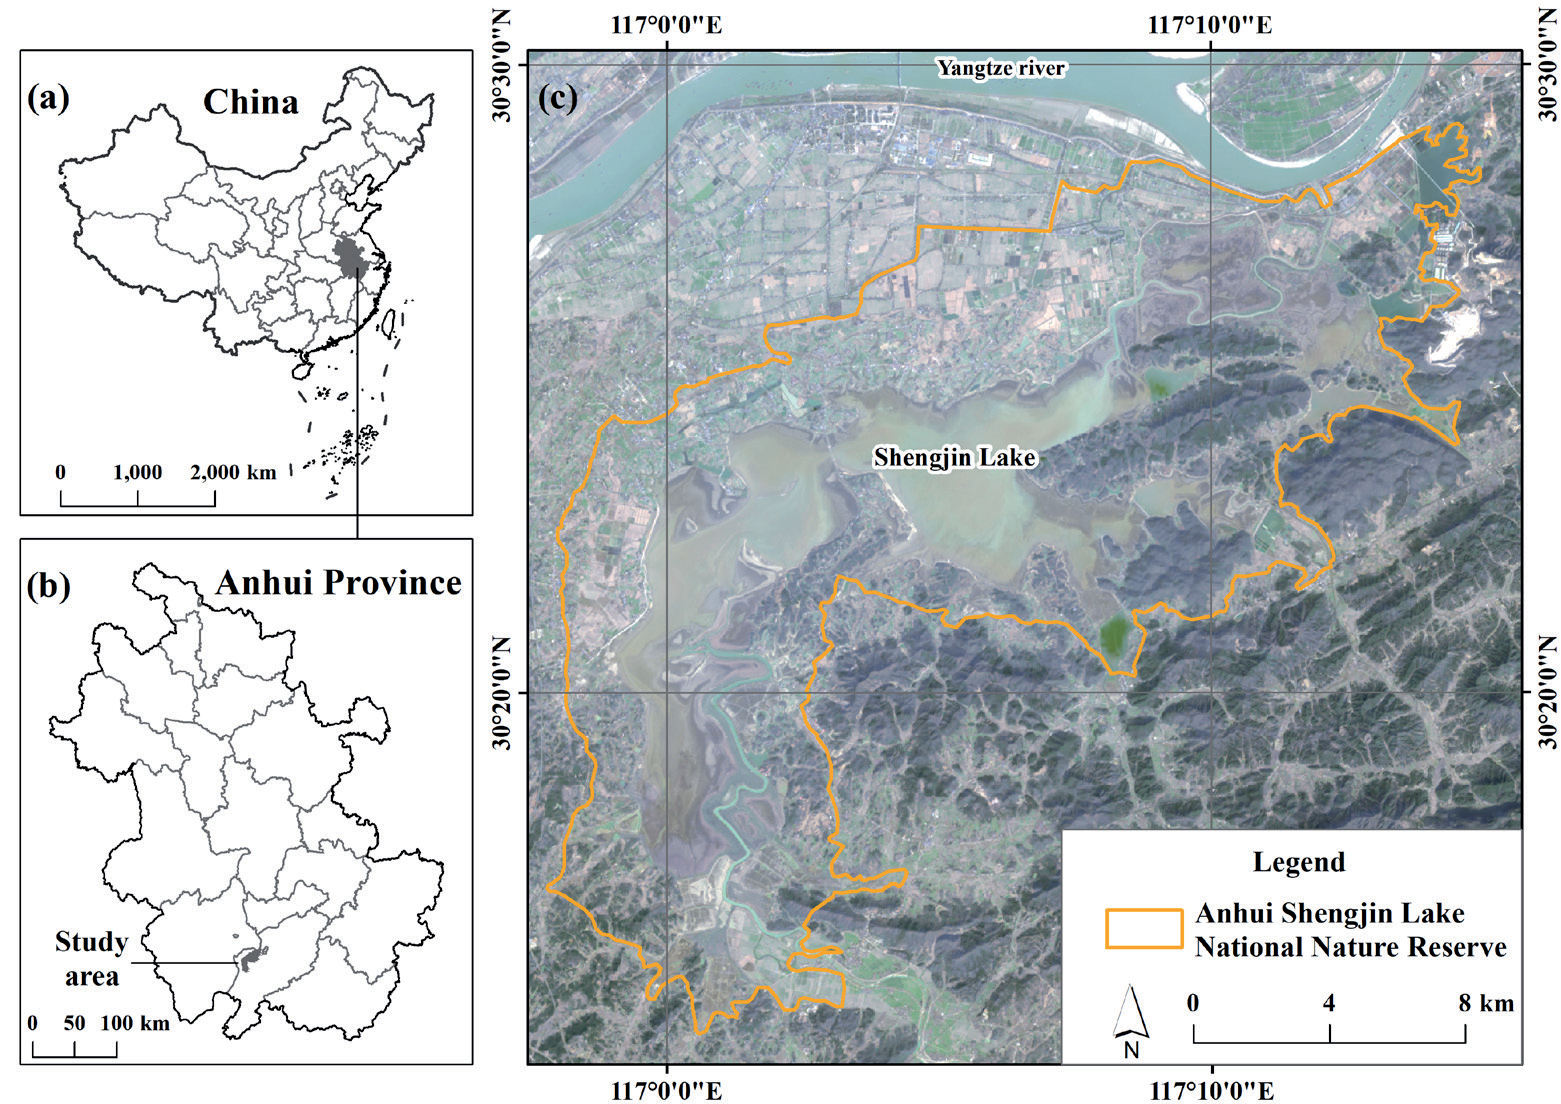
SJLNNR is situated on the southern bank of the downstream Yangtze River (Fig. 1). Approved by the Anhui Provincial Government in 1986, it was established as a national-level nature reserve in 1997. It serves as a crucial wintering ground for waterfowl within the East Asian-Australasian Flyway (EAAF), including notable populations such as Grus monacha, Ciconia boyciana, and Anser fabalis. The area consistently exceeds the 1% criterion of international importance for wetlands. Consequently, it was listed in the international roster of significant wetlands in 2015. It stands as the first wetland of international importance in Anhui Province. It encompasses the junction of Dongzhi County and Guichi District in Chizhou City, Anhui Province, accommodating approximately 60,000 residents whose primary economic activity revolves around agriculture. Moreover, Shengjin Lake boasts a long history of fisheries development, characterized by abundant aquatic resources, earning the moniker “daily fisheries profits equivalent to a liter of gold,” from which Shengjin Lake derives its name.
Framework of the Method
During the integration and optimization phase of China’s PAs, certain protection requirements were proposed for functional zoning. These existing conservation strategies place different demands on NRs during the ongoing phase of reshaping. Hence, taking into account the new requirements for land use in functional zoning resulting from diverse existing protection policies, we constructed a comprehensive methodological framework aimed at assessing the influence of conservation policies on land-use and ESs (Fig. 2).
(1) Initially, an analysis was conducted to comprehend the land-use transformation requirements in different functional zones imposed by diverse conservation strategies. Subsequently, five scenarios were formulated, comprising the baseline scenario (BS), core area protection scenario (CPS), and full protection scenario (FPS).
(2) We analyzed changes in land-use area and the supply of typical ESs, such as water conservation (WC), carbon storage (CS), food production (FP), and habitat quality (HQ).
(3) Lastly, utilizing the outcomes of Pearson correlation analysis, we evaluated the trade-offs or synergistic relationships between ESs. Additionally, a two-dimensional coordinate system was established by employing the change rates of any two ESs. This allowed us to analyze distribution characteristics of each scenario within this coordinate system, with the objective of delineating the advantages and disadvantages of each conservation approach. Detailed explanations for each step will be provided in the subsequent sections.
Data Source
In accordance with the evaluation requirements of typical ESs and data availability, we collected land-use data and meteorological data for the year of 2020. Additionally, we retrieved maximum and minimum temperature data from the government’s statistical yearbook of 2020. Furthermore, necessary carbon density data were extracted from research papers, encompassing carbon density of aboveground biomass, carbon density of belowground biomass, carbon density of dead matter, and carbon density of soil. All data were standardized to the Krasovsky_1940_Albers projection coordinates and analyzed in a 30 m×30 m grid (Table 1).
Scenarios
Conservation measures encompass various strategies, such as returning cultivated land to wetlands, returning cultivated land to forests, ecological migration, etc. These measures have a primary impact on wetlands, lakes, forests, croplands and villages. The specific requirements for implementing these policies differ across different functional areas. In the core and buffer zones, Villages need to be relocated to towns outside the reserve, while diked fields should be restored to their natural lake state. In the experimental zone, the transition of villages and cultivated land is carried out gradually, considering necessity and actual conditions. As a result, there are temporal and spatial discrepancies arising from the implementation of these policies. Additionally, it is essential to discuss the land-use transformation after village relocation (Fig. 3).
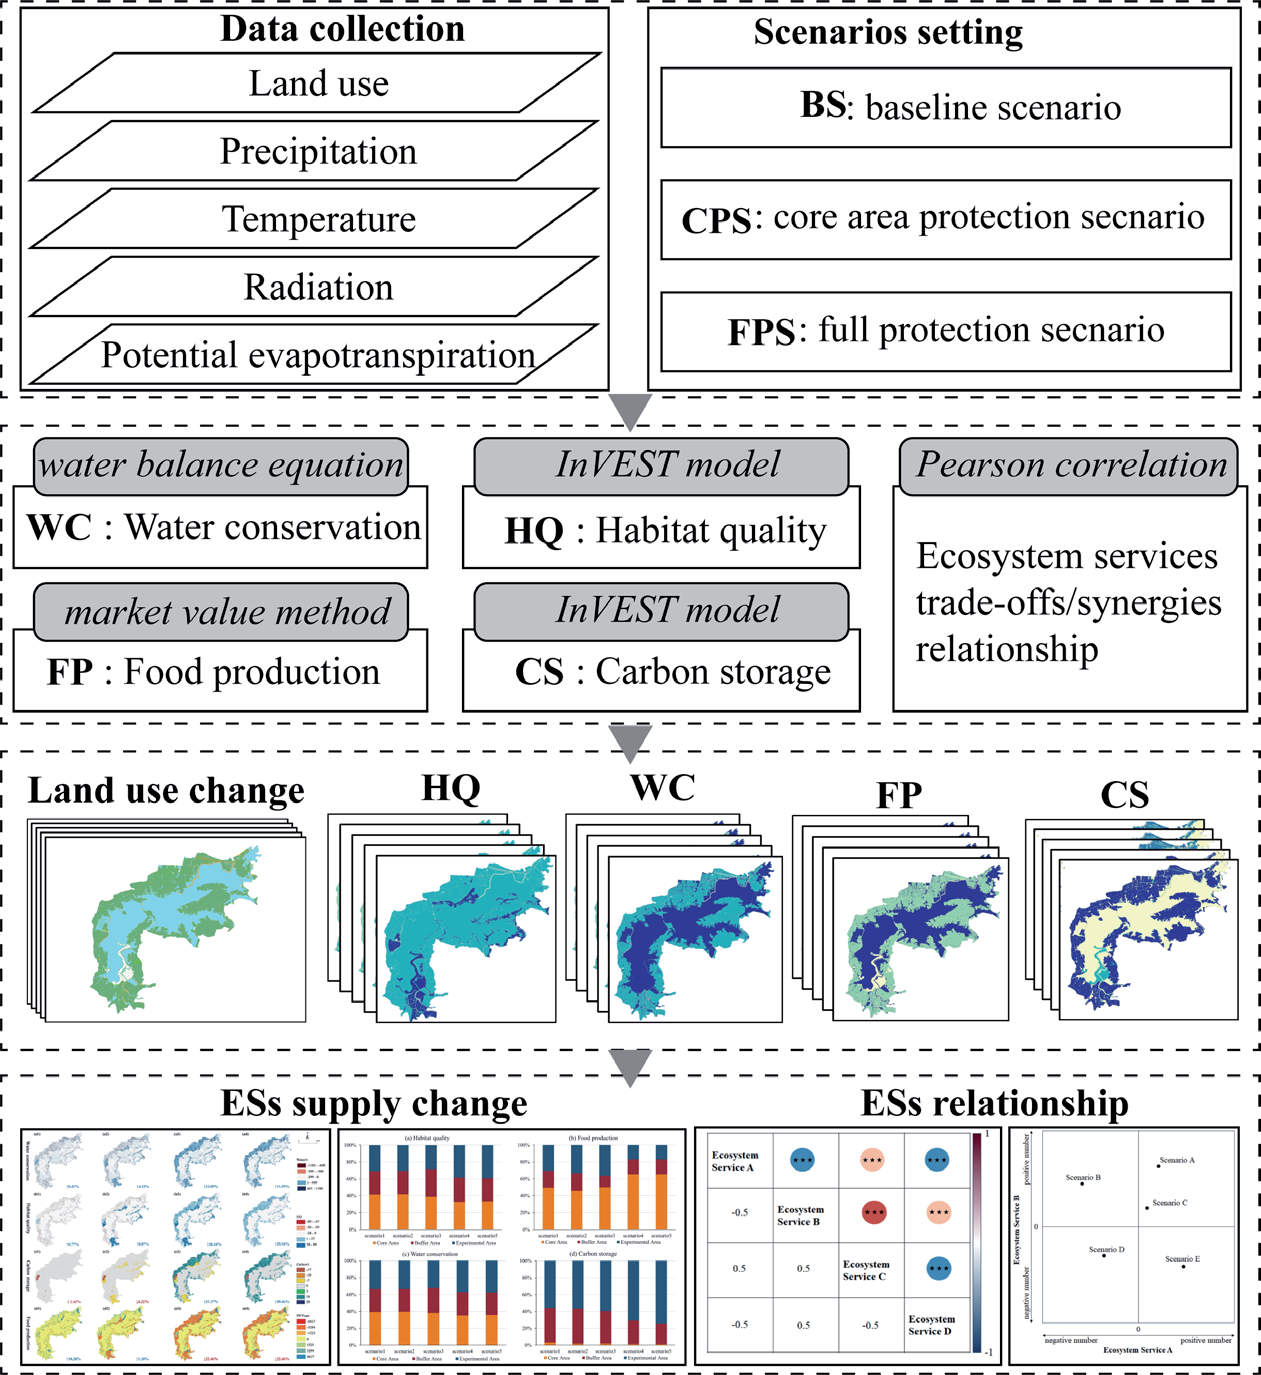
Table 1.
Data source.
Policy action programs are constrained by specific spatiotemporal conditions, typically commencing in the core zone and gradually transitioning to buffer and experimental zones over time (Table 2). Therefore, we thoroughly considered the spatiotemporal imbalance of policy implementation and categorized them into baseline scenario (scenario 1), core area protection scenarios (scenario 2 & 3) and full protection scenario (scenario 4& 5). This study utilized land use data from 2020 as the basis for scenario 1 (S1), using its analytical and evaluative outcomes as a reference benchmark for other scenarios. Scenario 2 (S2) primarily addresses the land use transition in the core zone, while scenario 3 (S3) involves the analysis of land use transitions in both the core and buffer zones. These two scenarios discuss potential directions for policy implementation in recent years. Scenario 4 (S4) and scenario 5 (S5) examine the land use transitions within the three functional zones, evaluating the possible outcomes of village and cultivated land transitions. These scenarios depict a comprehensive habitat protection scenario.
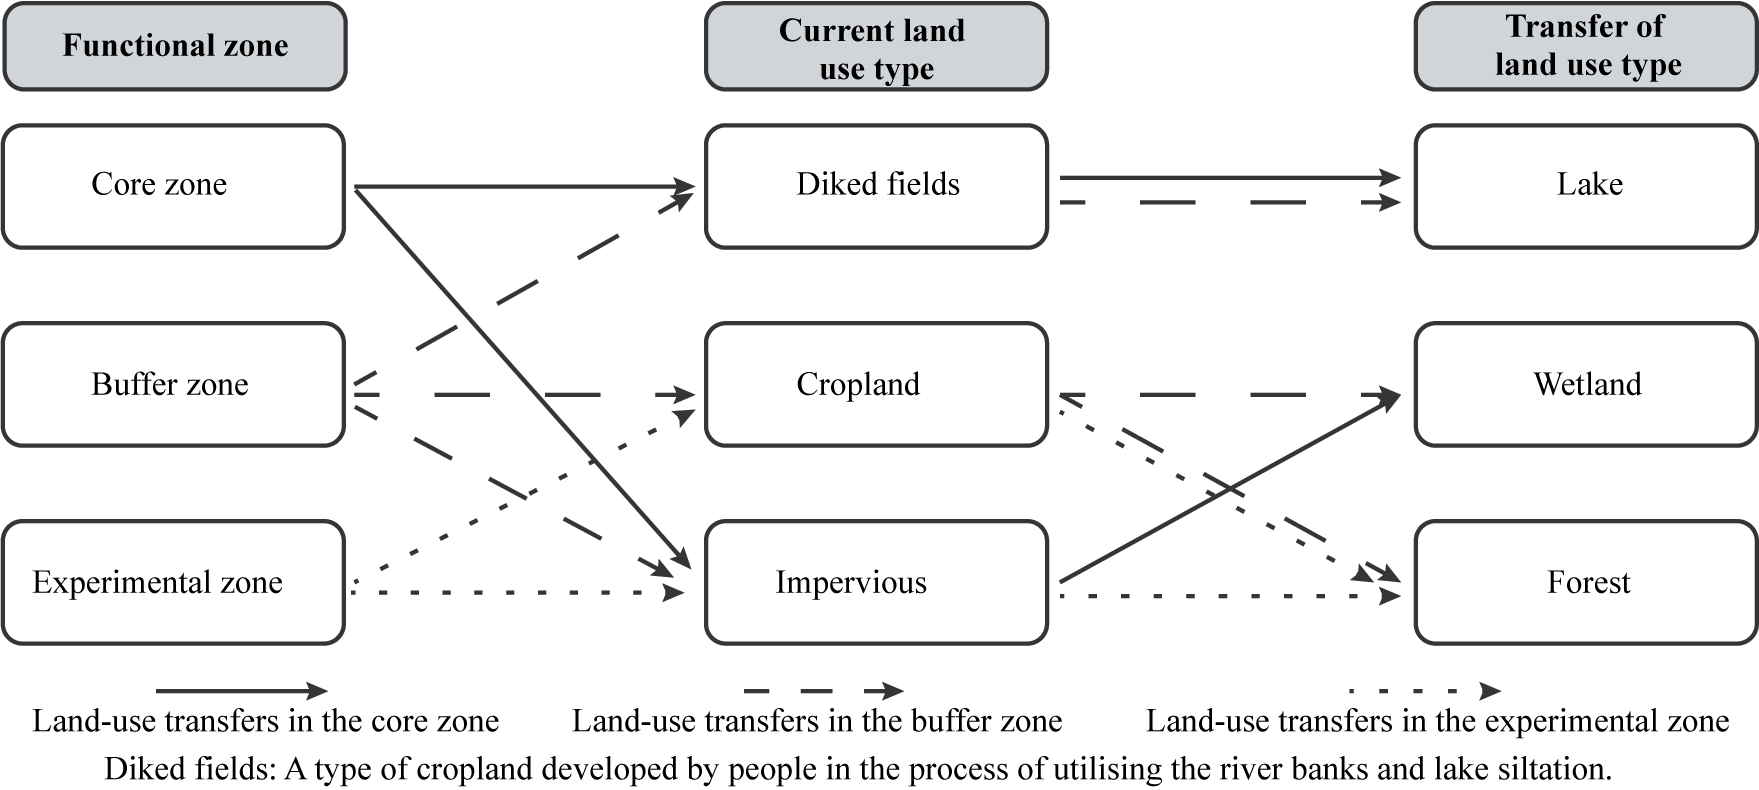
Table 2.
Scenario Setting.
Ecosystem Service Measurement
Water Conservation
The supply services of water conservation are based on the water balance equation [29]. The calculation equation is as follows.
WS is water conservation supply (t); Pi is precipitation (mm); Ai is the area of the i land use (m2); ETi is potential evapotranspiration (mm); Ri is surface runoff (mm), calculated by multiplying precipitation and surface runoff coefficient, which is described in the literature.
The daily potential evapotranspiration ETi is calculated based on the Modified -Hargreaves method with the following equation.
RA is the solar atmospheric topside radiation (MJ/(m2·d)); Tavg is the mean of the mean daily maximum temperature and the mean daily minimum temperature (ºC); TD is the difference between the mean daily maximum temperature and the mean daily minimum temperature (ºC); P is the mean daily precipitation (mm). Ri is calculated as follows.
Where α is the surface runoff coefficient, reflecting the degree of surface runoff depletion, and its value is mainly obtained based on the induction of previous studies [30-32].
Carbon Storage
The amount of carbon storage is calculated using the carbon fixation module of the InVEST model, which is based on the following equation:
Where C is carbon storage (t); Cabove is carbon density of aboveground biomass; Cbelow is carbon density of belowground biomass; Cdead is carbon density of dead matter.; Csoil is carbon density of soil. The carbon density data are derived from the relevant research results of carbon density values of land use types in China [33-38].
Food Production
For wetland products with direct commercial value such as rice, fruits, fish and other plant and animal resources, the market value method can be used to evaluate their value, which can make people intuitively feel the value of these resources [39-41]. The formula for the food production function is:
Where Vm is the value of substance production, Yi is the unit production of substance type i, and Pi is the current year market price of substance type i ($/t). The residents within the reserve primarily engage in agricultural production, with their main sources of income derived from rice cultivation and fisheries. Information gathered from publicly available publications such as the “2019 Statistical Yearbook of Chizhou City” and the “2019 Compilation of National Agricultural Cost and Revenue Data” along with surveys conducted among local residents, reveals that the average price of fish is approximately 1.4 US$ per kilogram, with a yield of about 5130.60 kg/ hm2. The average price of rice is approximately 0.20 US$ per kilogram , with a yield of around 6103.05 kg/hm2.
Habitat Quality
Habitat quality refers to the capacity of ESs to provide suitable conditions for the sustainable development of individuals and populations. It can, to some extent, reflect the status of regional biodiversity and plays a crucial role in maintaining biodiversity levels. Land-use change stands out as the most significant factor threatening habitat quality. The intensity of human activities is negatively correlated with habitat quality. The better the habitat quality, the less is disturbed by human activities, leading to higher biodiversity levels [42, 43].
The InVEST habitat quality model is a commonly utilized model for calculating habitat quality, employing a methodology that combines the sensitivity of different land-use types to threatening factors and the intensity of external threats. Villages and cultivated land are designated as threat data, with the influence range and weight data referencing previous studies [44, 45]. The sensitivity of habitat types to threatening factors is also drawn from references [45]. The calculation formula is as follows:
Where Qxj is the habitat quality of grid x in land use type j; Hxj is the habitat suitability of x in land use type j; and k is the half-saturation constant. Habitat quality values range from 0 to 1, with higher values indicating better habitat quality.
Dxj is the degree of habitat degradation of raster x in land use type j; Wr is the weight of different threat factors; ry is the intensity of threat factors; βx is the level of habitat resistance to disturbance; Sjr is the sensitivity of different habitats to different threat factors. Habitat degradation degree is between 0-1, the larger the value, the more obvious the degradation degree.
Formula (8) and (9) are the linear distance decay function and the exponential distance decay function, respectively. Where irxy is the effect of threat factor r in raster y on raster x; dxy is the linear distance between raster x and y; drmax is the maximum action distance of threat r.
Ecosystem Service Trade-Offs
Research on the trade-offs of ESs focuses on understanding and regulating the relationships between ESs, playing a crucial role in coordinating diverse objectives, maximizing human well-being, and supporting the sustainable utilization of social-ecological systems [46]. Relationships include trade-offs (negative correlations), synergies (positive correlations), and compatibility (no significant correlations). Tradeoffs refer to situations where different ESs are inversely related, while synergies refer to situations where two or more ESs are simultaneously enhanced [47-49]. We utilized Pearson’s correlation coefficient to analyze the trade-offs/synergies relationship, with positive and negative values representing synergies and trade-offs, respectively. The Pearson correlation coefficient formula is as follows:
Where ρx,y is Pearson correlation coefficient, Values ranging from -1 to 1; covX,Y is covariance; σX and σY are the standard deviations of sample X and sample Y respectively. When 0<ρx,y<1 represents a positive correlation (synergistic relationship) between ESs; When -1<ρx,y<0 represents a negative correlation (trade-off) between ESs. The greater the absolute value of the ρ-value, the stronger the correlation.
Results
Land Use Changes
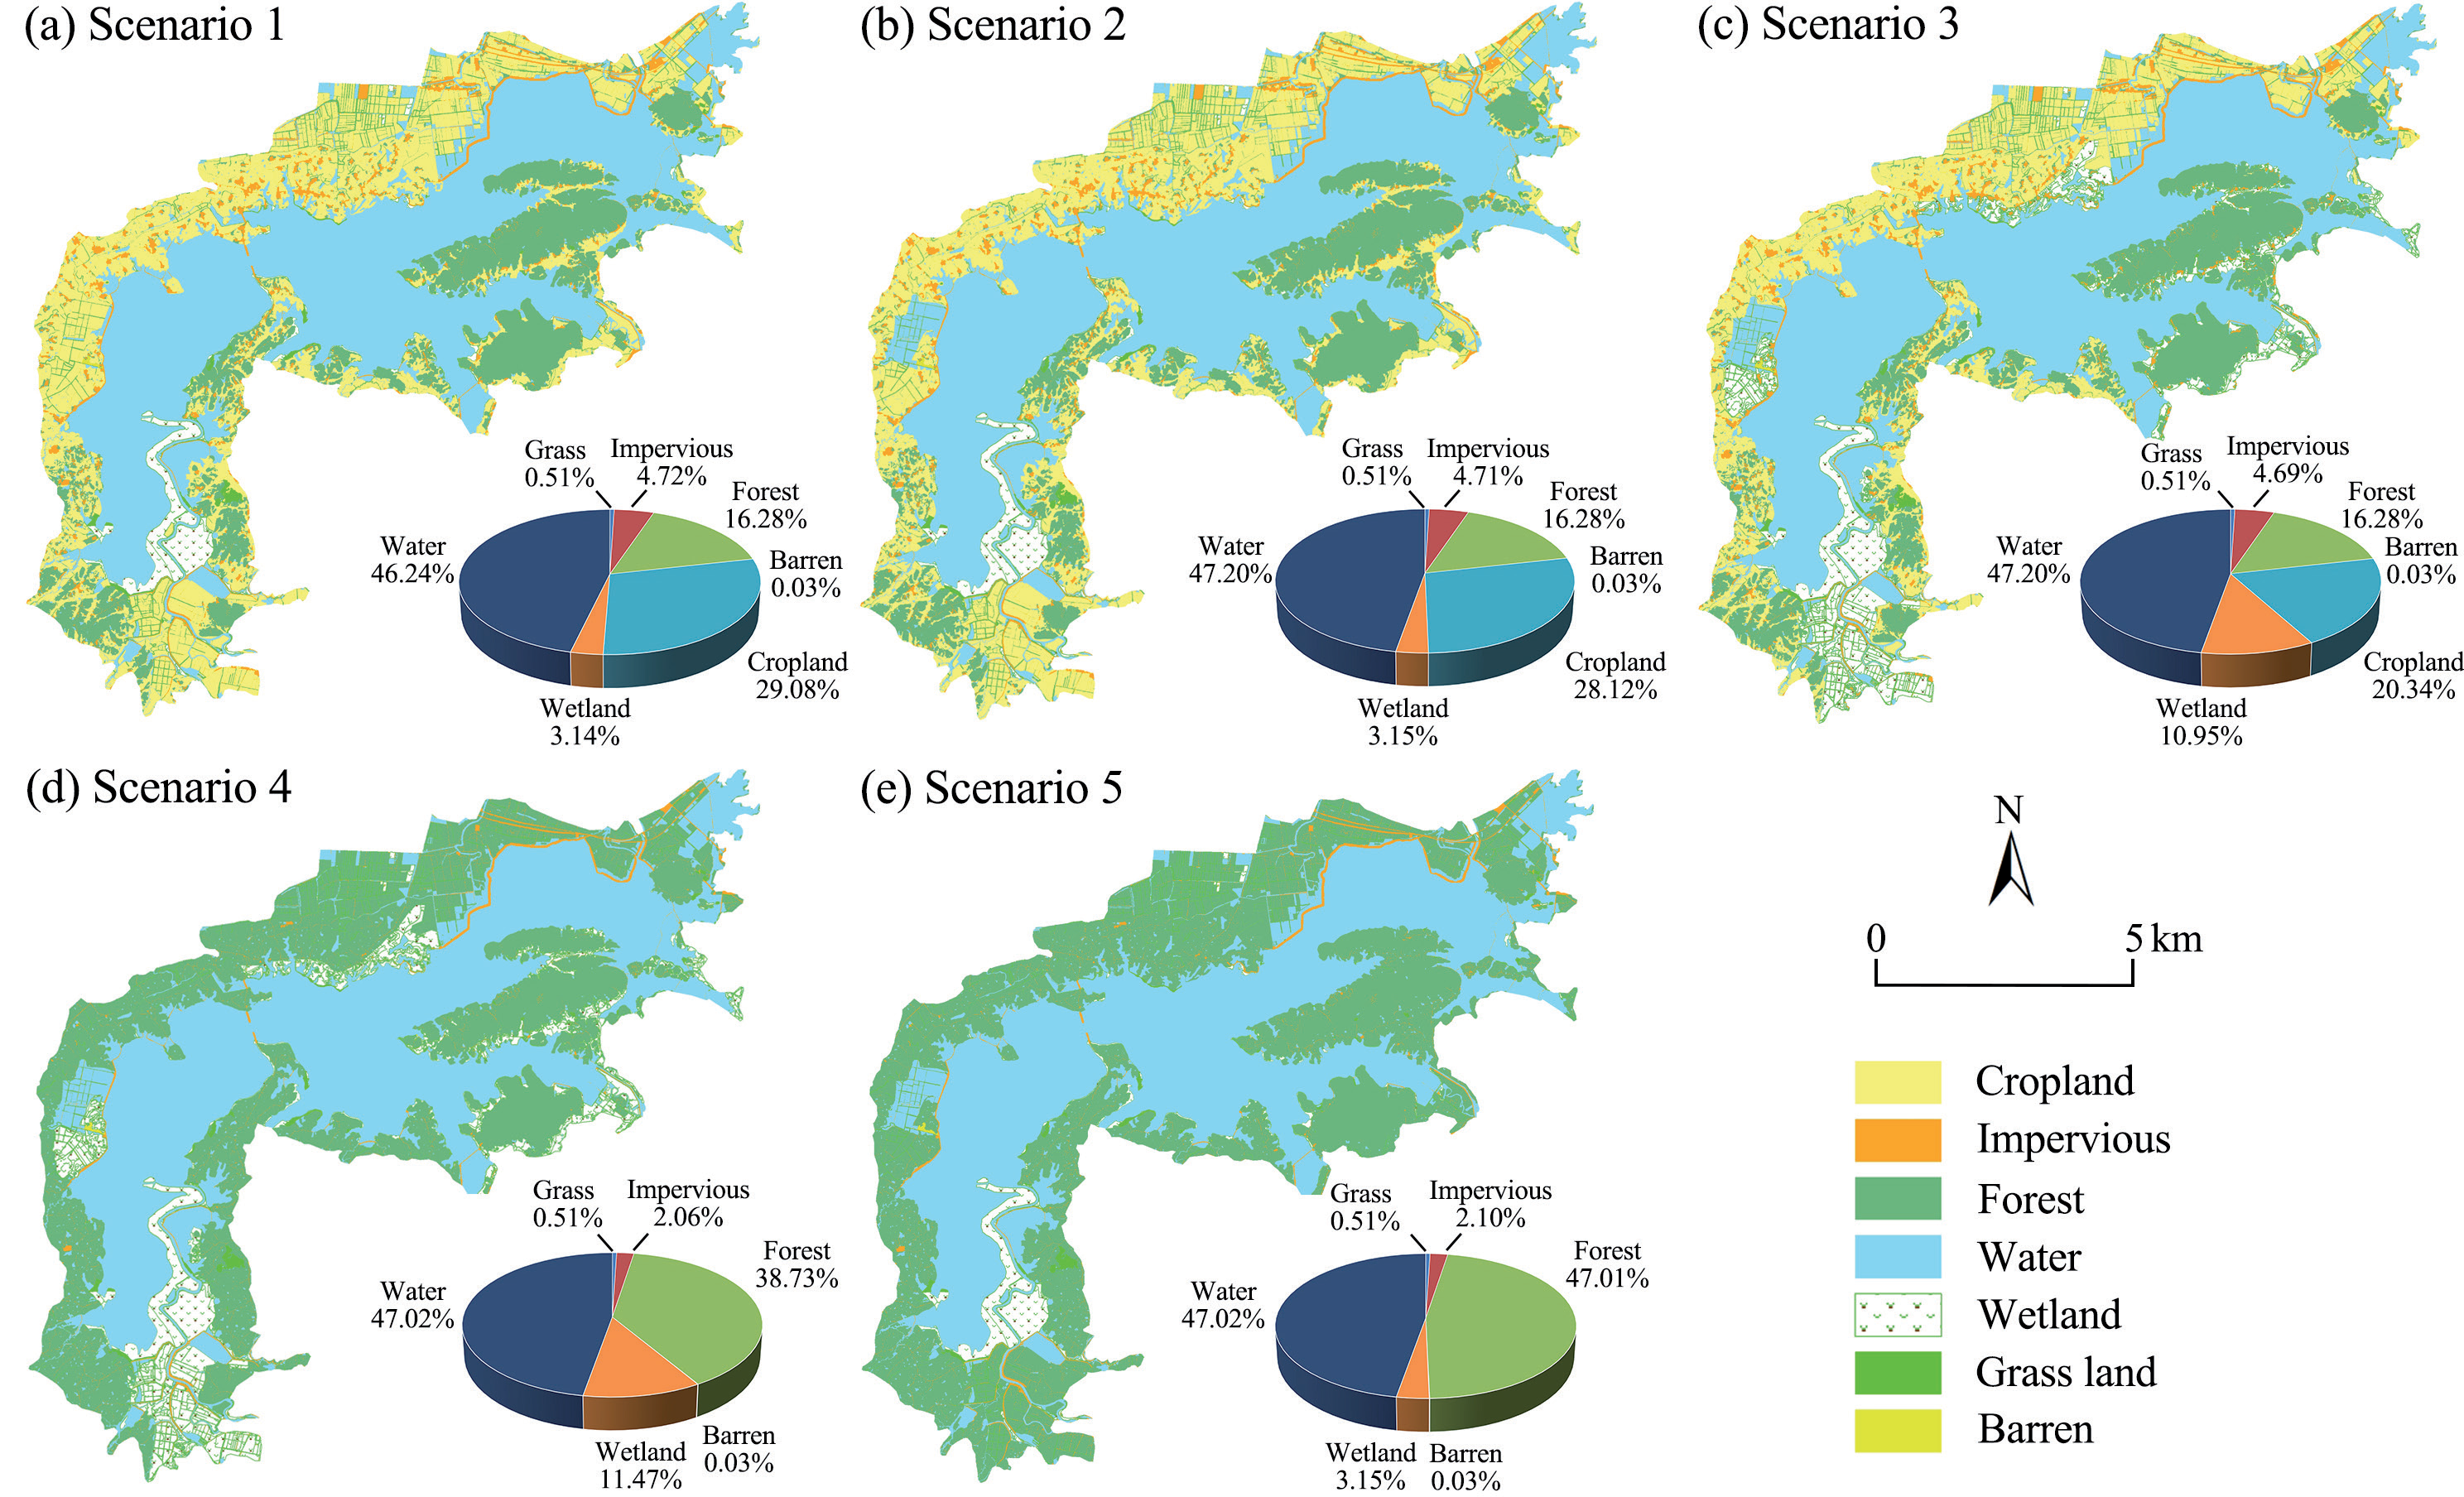
The proportion and spatial distribution changes of land-use area in various scenarios are shown in Fig. 4. Overall, the area of construction land may decrease by approximately 3~960 hm2, with CPS experiencing the highest reduction of about 11 hm2, followed by FPS with a maximum reduction of around 869 hm2. The potential range of decrease in cropland area is approximately 310~9368 hm2, with CPS showing the largest decrease of 2815 hm2, while FPS may decrease by approximately 9368 hm2, indicating a complete conversion of all cropland into other land use types. Wetland area may increase by approximately 3~2686 hm2, with CPS showing the highest potential increase of about 2516 hm2, followed by FPS with a maximum increase of approximately 2686 hm2. Both CPS and FPS exhibit an increase in lake area of approximately 310 hm2.
In S2, the area of impervious and cropland decreased by 0.01% and 0.96%, totaling 312.59 hm2, while the area of wetlands and lakes correspondingly increased. In S3, the area of impervious and cropland decreased by 0.03% (10.59 hm2) and 8.74% (2814.59 hm2), respectively. The area of wetlands and lakes increased by 7.81% (2515.67 hm2) and 0.96% (309.51 hm2), respectively. In S4, the area of impervious and cropland decreased by 2.66% (171.81 hm2) and 29.08% (9367.81 hm2), while the areas of forest land, wetlands, and lakes increased by 22.45% (7230.77 hm2), 8.34% (2685.57 hm2), and 0.96% (309.58 hm2), respectively. In S5, the percentage reduction of impervious and cropland is consistent with S4, but the difference lies in the increase of forest land and wetlands by 30.73% (999.75 hm2) and 0.01% (3.08 hm2), respectively.
ESs Supply Changes
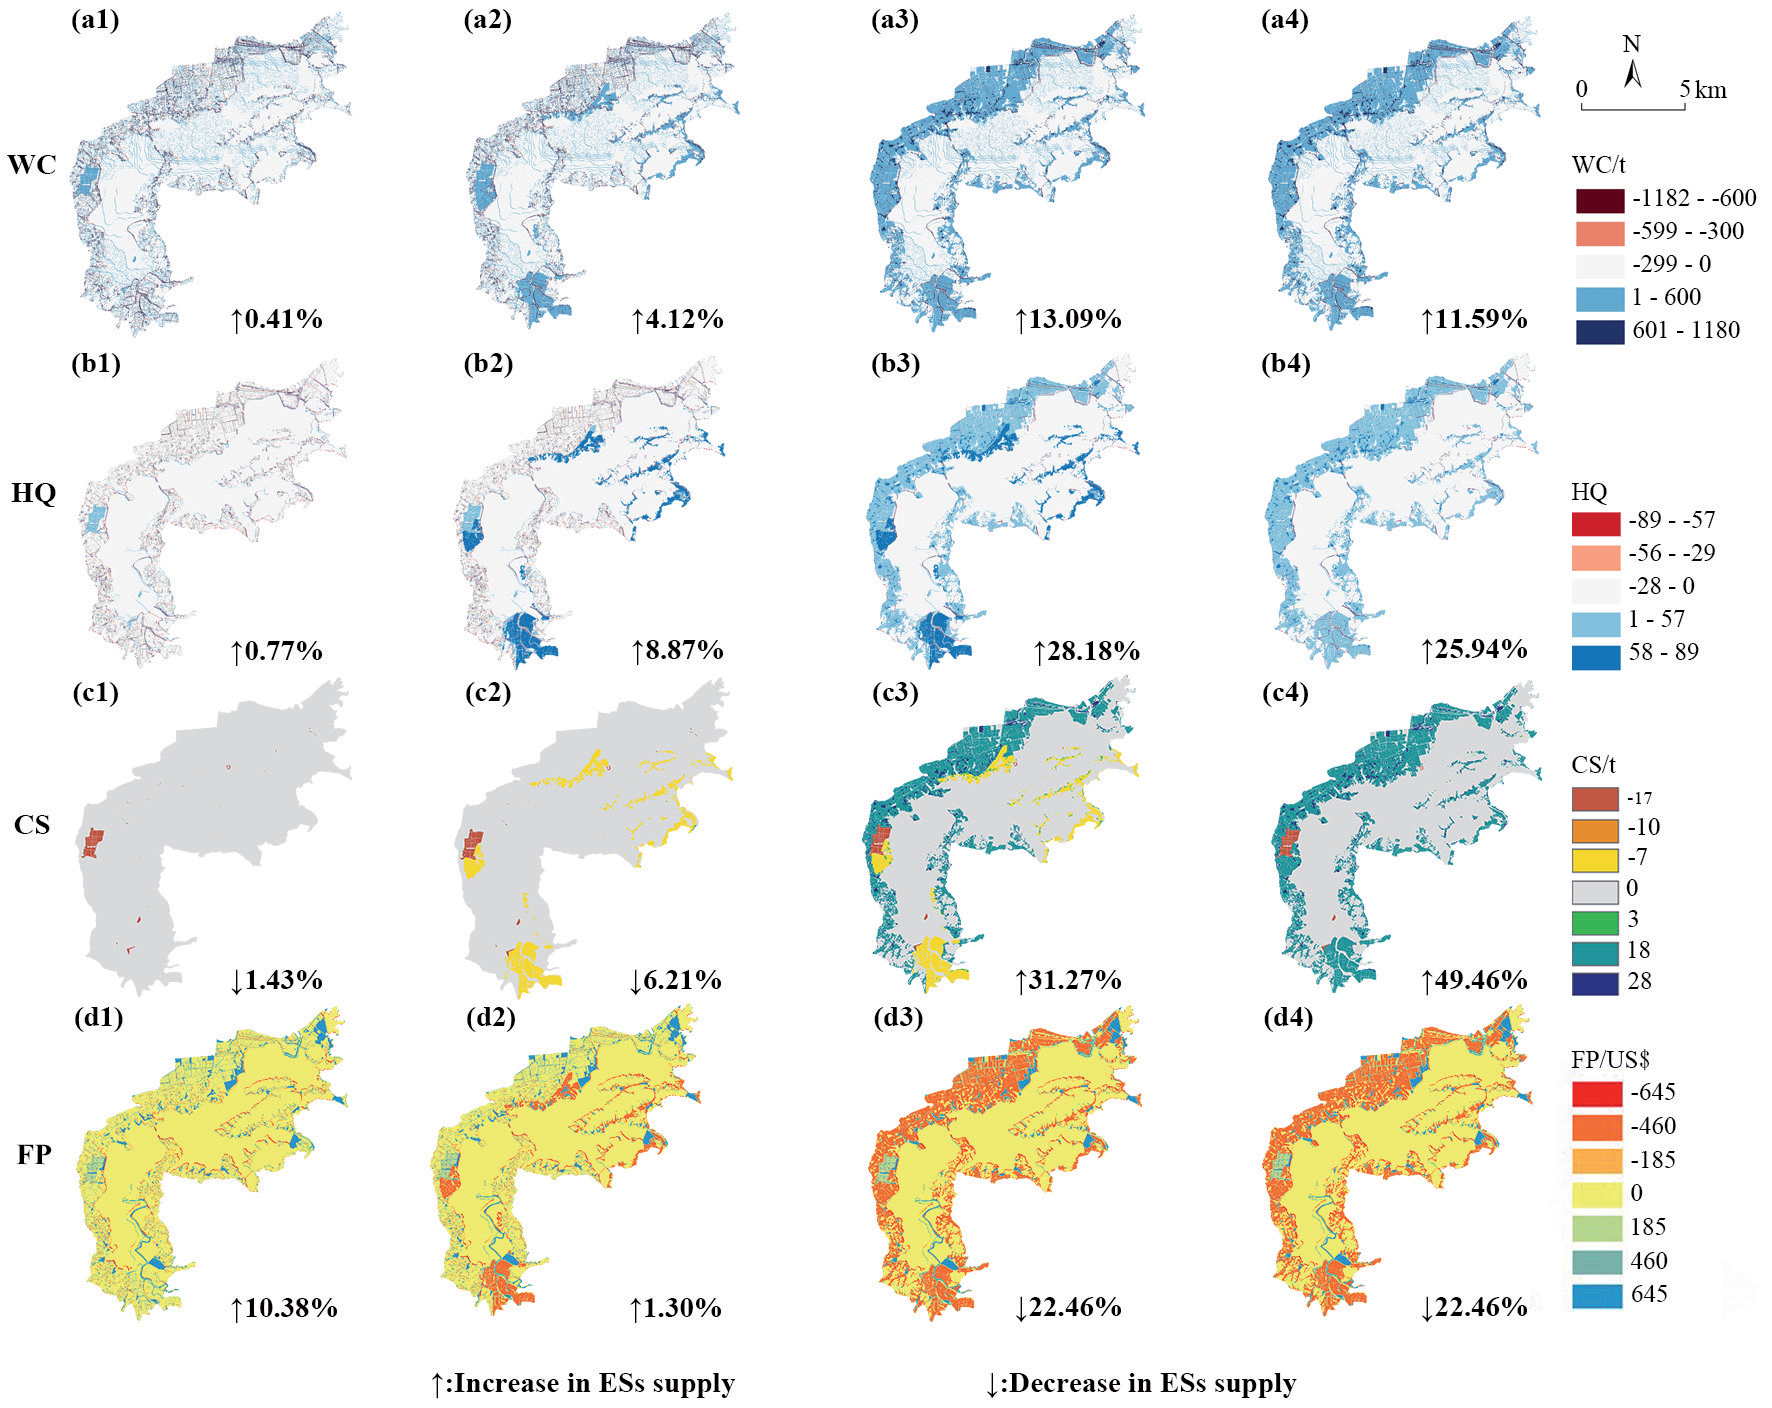
Overall changes in the supply of ESs are shown in Fig.5. In general, the supply of WC and HQ showed varying degrees of improvement in both CPS and FPS. Conversely, CS and FP exhibited contrasting trends between CPS and FPS. Specifically, WC and HQ experienced the highest increase in proportion in S4, with respective increments of 13.09% and 28.18%, while the smallest increases were observed in S1, with respective increments of 0.41% and 0.77%. The improvement magnitude of WC and HQ in CPS was significantly lower than that in FPS. CS displayed a declining trend in CPS, with decreases of 1.43% and 6.21% in S2 and S3, respectively, whereas it showed substantial improvement in FPS, with increments of 31.27% and 49.46% in S4 and S5, respectively. FP experienced increases of 10.38% and 1.3% in S2 and S3, respectively, but decreased by 22.46% in both S4 and S5.
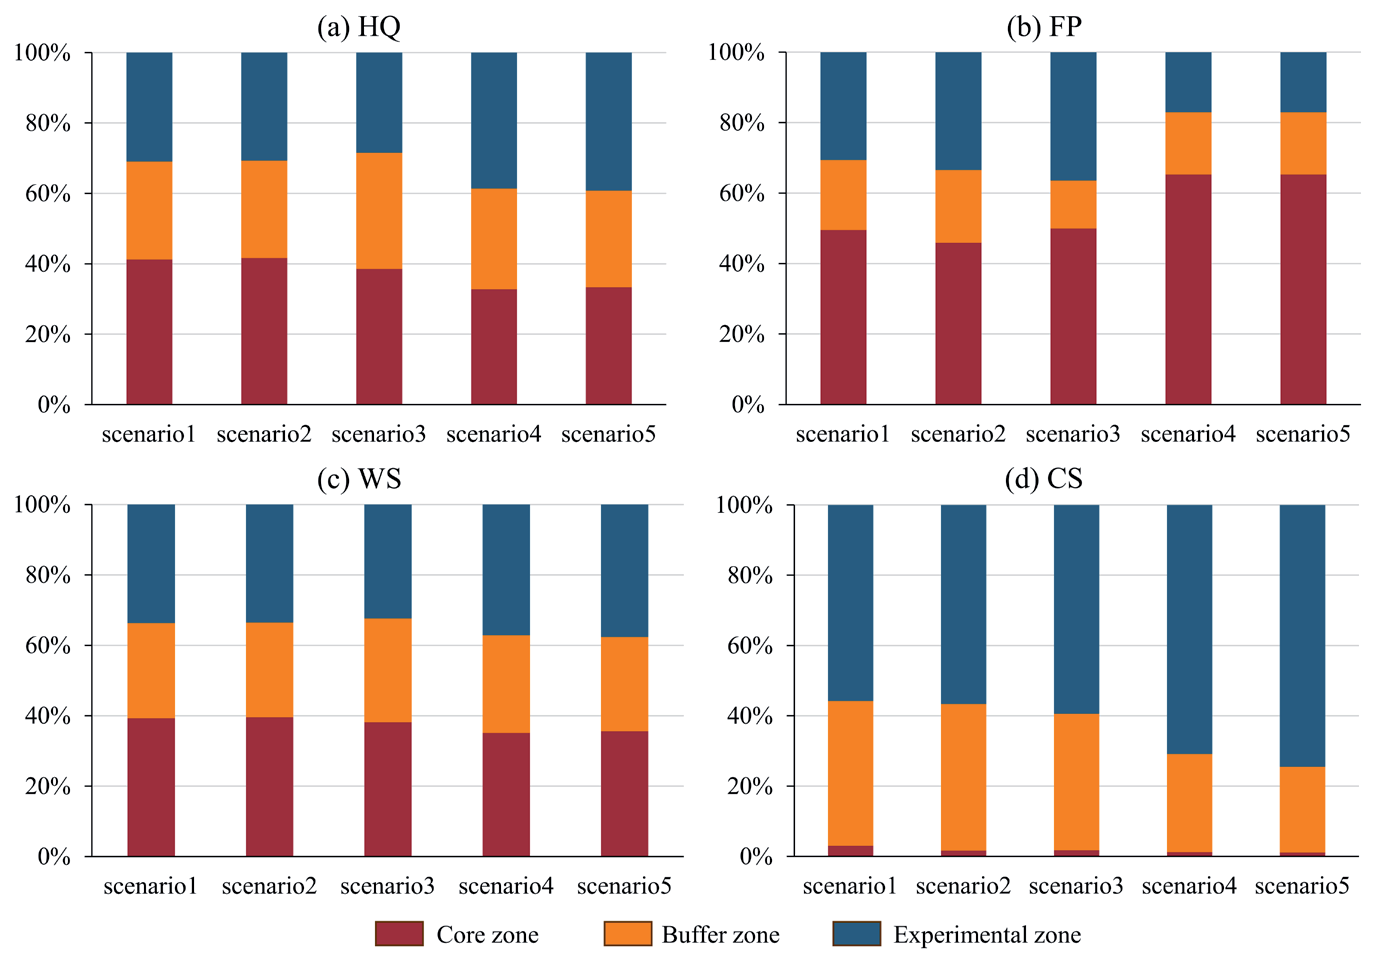
The proportions of ESs supply in various functional zones are shown in Fig.6. It can be observed that land use change leads to significant changes in ESs supply. The proportional changes in ESs supply in the core zone were minimal, and the trend of change was not apparent. In the buffer zone, the proportions of HQ and WC supply increased in the last three scenarios compared to the first two, while the proportions of CS and FP supply slightly decreased, especially in S2 and S3. In the experimental zone, the supply of HQ in S4 and S5 was significantly higher than in S1, S2, and S3, accounting for nearly 40% of the total supply. The supply in the first three scenarios was within the same level range. The proportion of WC was similar characteristic to that of HQ, but the magnitude of change in the latter scenarios was smaller than HQ. The supply of FP gradually increased in the first three scenarios and significantly decreased in S4, accounting for less than 20%. The supply of CS remained relatively constant in the first two scenarios and substantially increased in S4 and S5, exceeding 50%.
ESs Trade-Offs Relationship
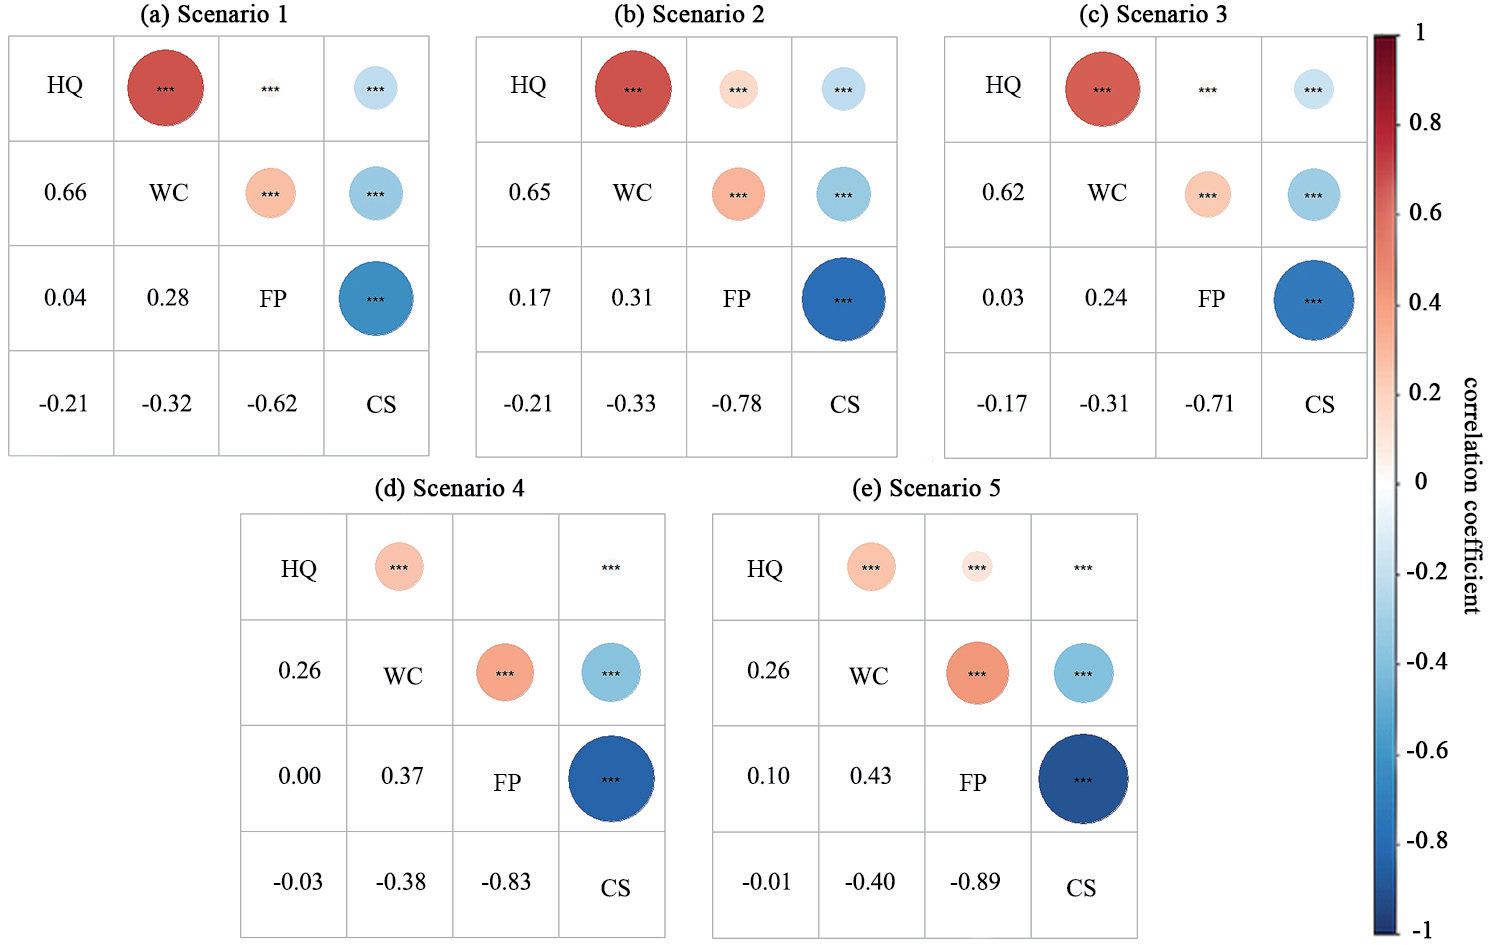
ESs trade-offs or synergistic relationships shown in Fig.7. CS, most notably, showed trade-offs with all other ESs. all ESs showed varying degrees of synergistic relationships with the exception of CS. S1-S3 show clear synergies between HQ and WC (ρ>0.6), with a significant trade-off between CS and FP (ρ<-0.6). The results for S4 and S5 differ somewhat from S1-S3, trade-off between CS and FP display a further strengthening (ρ>0.8) with a significant weakening of the synergistic relationship between HQ and WC (ρ<0.3). Noting that the trade-offs/synergies between ESs are not significant, except for those between the two pairs of ESs above. In terms of the significance of trade-offs/synergies, the most significant synergies were found between HQ and WC in S1 (ρ = 0.66), and the highest trade-offs were found between CS and FP in S5 (ρ = -0.89).
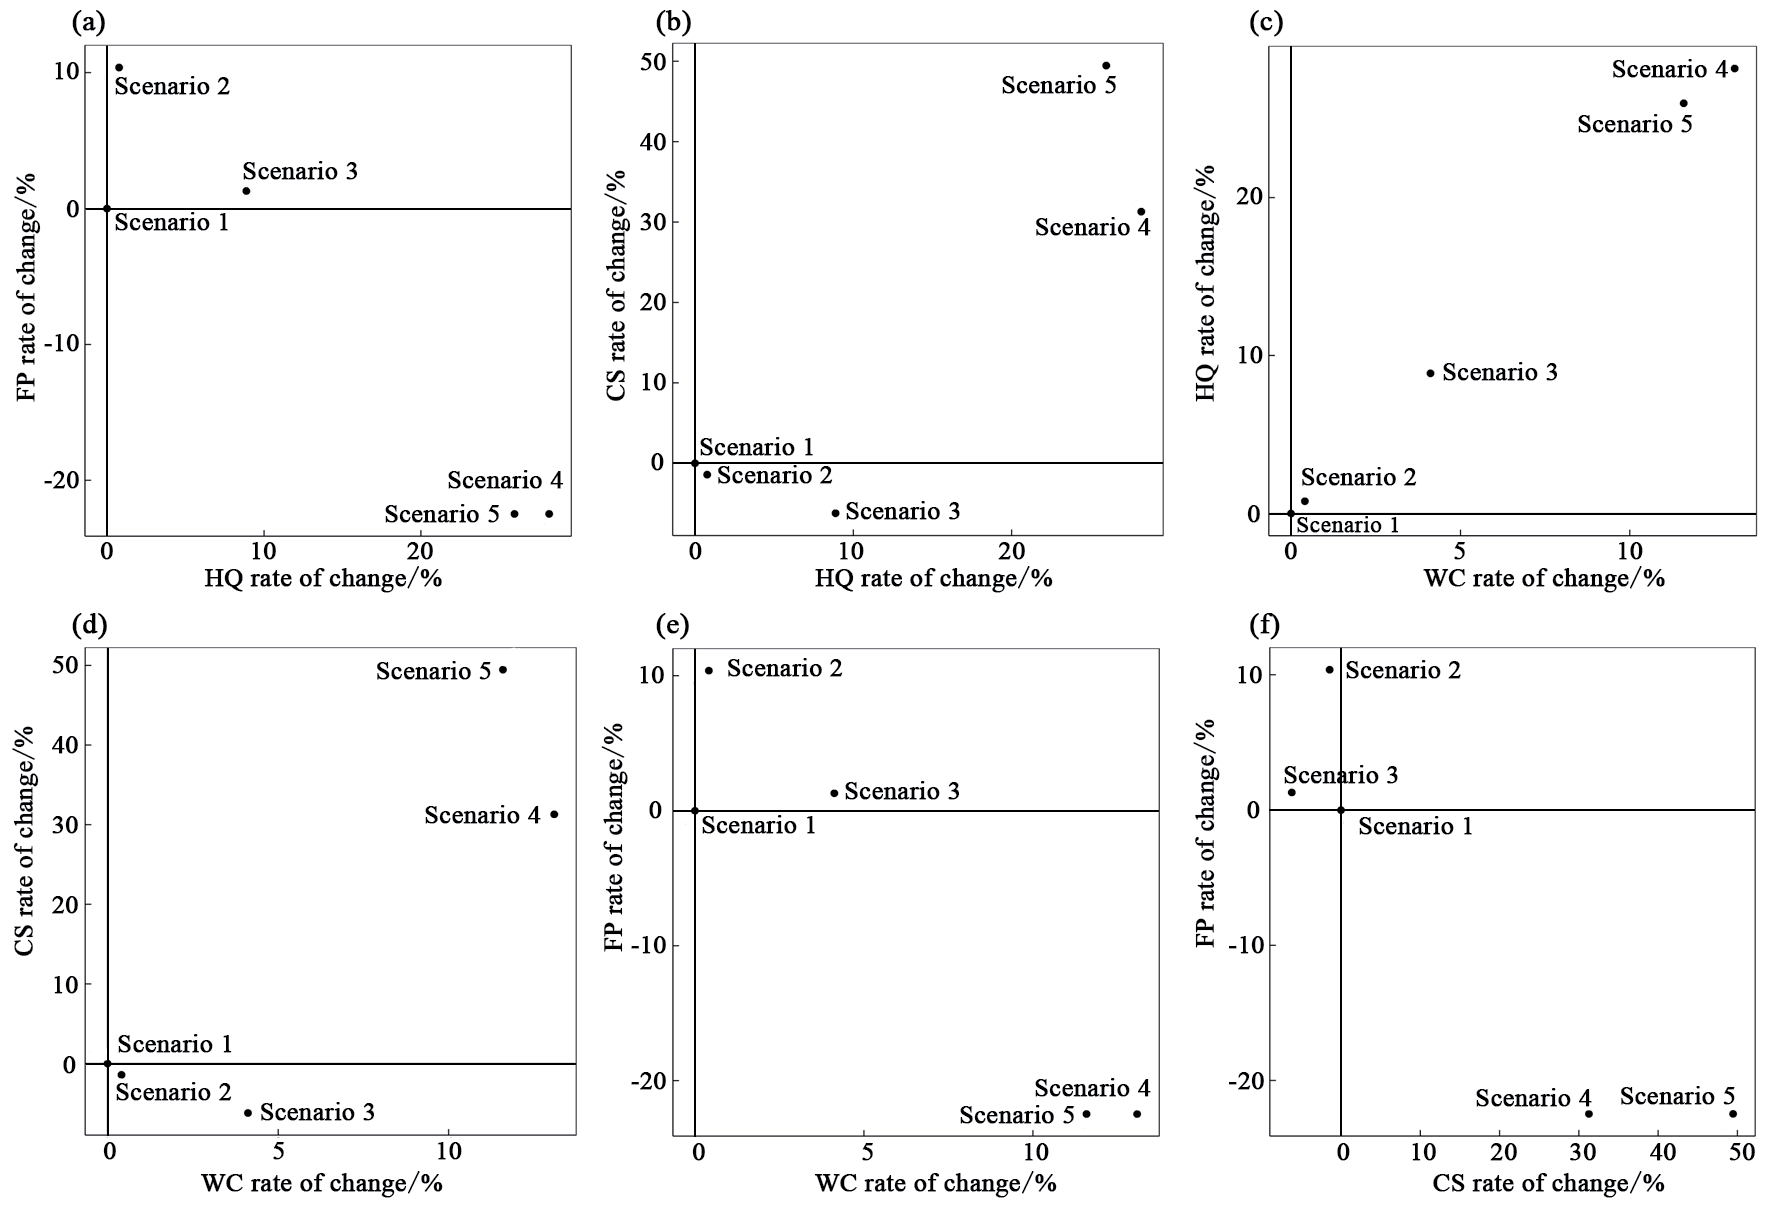
By comparing and analyzing the changes of ESs supply through pairwise comparisons of the five scenarios, we derive the positions occupied by the five scenarios within the coordinates of the four quadrants, to evaluate the effectiveness of the scenarios (Fig. 8). Firstly, as the HQ improves, S4 and S5 effectively enhance CS and WC. However, this improvement may have a significant negative impact on FP, especially as pronounced in S4. Secondly, regarding the relationship between HQ and FP, the scenarios exhibit similar characteristics as the relationship between WC and FP. These characteristics are also evident in the relationship between the two ESs (HQ and WC), as well as CS. This suggests a clear consistency in the ESs effects of the scenarios, emphasizing significant synergistic relationships between ESs. It is noteworthy that all scenarios show some contradictory relationships between FP and CS. This highlights the necessity for planning decisions to thoroughly consider the relationship between FP and CS and mitigate trade-offs among the two.
The core and buffer zone are the priority areas for the implementation of spatial decision-making in NRs. Therefore, S2 and S3 simulate the possible impacts of this policy scenario. We find that the transfer of farmland and village construction land in core and buffer zone to lakes or wetlands can improve the quality of HQ, WC and FP in a short period of time. Although the farmland area is reduced, the increase in fishery output value resulting from the increase in lake area is greater than the increase in cropland area. The policy of NRs villages and cropland requires ecological migration with gradual cropland conversion types. Therefore, S4 and S5 simulate the FPSthat is likely to occur in the future, resulting in the largest CS enhancement, as well as enhancements in WC and HQ. The main reason for this scenario to occur is the change in cropland type, although the type of land transferred varies.
Discussion
Development of Nature Reserves
In 1956, Dinghu Mountain National Nature Reserve was established in Zhaoqing City, Guangdong Province, marking China’s inaugural nature reserve and the initiation of protected areas in the country. Presently, China boasts over 11,800 protected sites across various administrative levels, covering approximately 18% of the national terrestrial territory. These protected areas, particularly nature reserves, constitute integrated ecological systems merging natural, economic, and social components, interweaving ecological, production, and residential spaces. Notably, there is a prevalent intermingling of forests with cultivated lands, wetlands with farmlands, and coexistence of built-up areas within national-level nature reserves, comprising 531 towns and accommodating around 4 million residents, with the core areas hosting approximately 400,000 individuals [50]. The Chinese government has issued policy directives such as Guiding Opinions on Establishment of Protected Areas System with National Parks as the Mainstay (2019) and Notice on Preliminary Work for Optimizing and Adjusting the Scope and Functional Zoning of Nature Reserves (2020), marking a new phase for China’s PAs. In this phase, the functional zoning has shifted towards management control areas. Specifically, core and buffer zones have been reclassified as core protection areas, while experimental zones have been designated as general protection areas, accompanied by stipulations regarding land use types. Currently, the ongoing process of integrating and optimizing NRs remains incomplete. New regulations for NRs have not yet been promulgated, and the functional zoning of these reserves continues to reference existing laws such as Law of the People’s Republic of China on Nature Reserves (2017) and technical standards like General Plan of Nature Reserves (GB/T 20399-2006). Consequently, this study continues to investigate nature reserves based on the functional zoning of core, buffer, and experimental areas.
In the context of the new policy framework, NRs are mandated to exclude built-up towns, villages, densely populated regions, and community livelihood facilities that hold low conservation value. In alignment with targeted poverty alleviation and ecological support, orderly relocation of indigenous inhabitants within core protection zones is recommended. Additionally, agricultural lands within these reserves are lawfully and systematically returned to forestry, grasslands, lakes, and wetlands considering their historical evolution and conservation requirements. The outcomes of this research indicate that the implementation of these policies will expand ecological spaces such as forests, wetlands, and lakes within NRs while reducing the expanse of villages and cultivated lands.
ESs Trade-Offs in Spatial Decision of Nature Reserves
The healthy coupling of the food-water-land-ecosystem nexus is the basis for achieving sustainable development [51], The valuation of ESs and assessment of trade-offs relationships are incorporated into the simulation analysis of policy measure implementation scenarios, which has important practical value and guiding significance for implementing ecological conservation measures in NRs [52]. Currently, the implementation of ecological restoration measures in NRs faces a series of complex problems [53]. It is necessary to assess the impacts of the implementation of policy measures on human well-being from the perspective of ESs, as well as the trade-offs relationship response of ESs [54]. Our analysis indicates that a significant portion of farmland and villages is undergoing transformation into ecological areas, including forests, lakes, and wetlands. This transformation effectively improves the supply of ESs, including HQ, WC and CS. However, this transformation does not necessarily improve the trade-off relationships among different ecosystem services. The synergistic relationship between HQ and WC, as well as between HQ and FP, has markedly decreased. In contrast, the synergistic relationship between WC and FP has slightly enhanced. The trade-off relationship between HQ and CS has been enhanced, and the trade-off relationship between FP and CS has been further reinforced.
From the perspective of long-term conservation and development, S4 is better suited to meet the requirements of the ideal conservation status. By transforming farmland and impervious land into wetlands and forests, it maximizes the enhancement of HQ and WC while also strengthening the value of CS. Despite the decline in the supply of FP, it significantly reduces the disturbance caused by human production and subsistence activities on agricultural land to bird habitats and lake water quality, as evidenced by the improvement of HQ. Additionally, we recommend that the management refer to S3, which involves preserving some farmland and villages in the experimental area to provide sustainably utilized natural resources and ecological space for the development of eco-tourism, meeting the demand for sustainable development beyond the ecological protection needs of NRs [55-57].
Policy-driven land use transformation needs to pay attention to the following points: (1) In response to the transformation of farmland and villages, managers needs to develop clear ecological compensation measures. In addition, economic compensation should be used to compensate for the economic losses in agriculture caused by birds’ foraging. (2) Policies encouraging of indigenous communities in the environmental system should contribute to the growth of the income of the aboriginal people, including economic incentives and inclusive negotiation, in order to increase the potential of ecosystem services to increase people’s incomes [58]. (3) In addition, different types of villages should be classified according to their different developmental conditions and conflicting characteristics [59], and scientific rural development plans should be formulated to harmonize conflicts between ecosystem protection and sustainable development.
Limitations and Prospects
This paper focuses on potential land use changes within NRs in the context of policy implementation, in comparison to previous research. It enhances the analysis of trade-offs among ESs, aiming to offer valuable insights to conservation area management concerning the potential impacts of conservation policies and measures on different functional zones. This study enables adjustments in conservation measures, thereby improving the scientific foundation for spatial decision-making. However, this article has certain limitations that require further refinement in future research.
(1) Firstly, the model parameter selection might deviate from on-ground monitoring data as it primarily relied on existing research. (2) Secondly, the study only includes four typical ESs due to limited data availability and does not consider cultural services, which should be addressed in future investigations. Additionally, it is important to examine the supply and demand gaps of CS in NRs under the context of carbon neutrality strategy and the scenario of farmland protection [60]. (3) Lastly, the quantity and spatial imbalance characteristics of ESs in NRs need to be studied from the perspective of the supply-demand relationship [61]. Future research could also explore the impact of land use changes and their trade-offs on ESs using model algorithms that consider historical transitions and future climate changes.
.
Conclusion
SJLNNR is situated in a strategically advantageous geographical location and is dedicated to the preservation of rare waterfowl. However, there is a contradiction between improving the quality of life for local residents and protecting the ecosystem. This study quantitatively analyzes the changes and trade-offs of ESs under difference scenarios, based on policy-driven land use changes. This analysis utilizes the water balance equation, InVEST’s habitat quality model, and the value per unit area. Additionally, the impacts generated by a ESs are evaluated under different scenarios. The main conclusions are as follows: (1) Protection measures driven by policy scenarios result in a significant reduction in cropland and construction land area, while increasing the wetlands and forests’ coverage. Particularly, in the FPS. (2) WS and HQ experience various degrees of increase, reaching a maximum of 13.09% and 28.18%, respectively. CS decreases in CPS and increases in FPS, with a maximum increase of 49.46% and a minimum decrease of 6.21%. FP increases in CPS and decreases in FPS, with a maximum increase of 10.38% and a minimum decrease of 22.46%. (3) There is a synergistic relationship between HQ and WC, but no significant correlation with FP is observed. CS showed a trade-off relationship with other ESs, especially with FP being the most prominent. In terms of ESs effects, FPS is significantly stronger than CPS, effectively enhancing HQ, WC, and CS.

