

Introduction
The rapid increase in high-speed expansion of economic aggregates, global population, and accelerated urbanization has resulted in limited land resources facing more frequent human activities, which leads to a sharp increase in resource and environmental pressure and intensifies the conflict between human and land relationships [1]. Data from the National Bureau of Statistics showed that China has undergone a substantial increase in urbanization, rising from 17.9% before the reform to 65.22% in 2022. Rapid urbanization and industrialization have strained resource supply, causing unprecedented influences on the national territory's rational spatial layout and development [2]. Meanwhile, issues related to the unregulated growth of urban and rural residential areas, the fragmentation of cultivated land, and the deterioration of ecological environment quality have been noticed in recent times. These issues have resulted in frequent alterations in land use types and spatial patterns, posing a substantial risk to the stability of the land use system. In addition, these actions threaten the stability of food supplies, ecological security, and the long-term stabilization of various regions [3]. Land use conflicts are a spatial manifestation of the instability of the land use system, which has a close interactive feedback relationship with biodiversity, and social stability, serious obstacles to the sustainable use of land resources, and high-quality regional development [4]. Therefore, it is of great significance to research scenario modeling and mitigation paths of land use conflicts to promote the alleviation of human-land conflicts and the sustainable development of the city.
Land use conflicts manifest as an objective contradiction, a pervasive phenomenon that permeates all phases of societal progress. Examining the spatiotemporal variations in land use conflicts is beneficial for comprehending the current state of the regional social and economic environment. Previous research has examined the progression of land use conflicts in terms of changes in land use types [5, 6], alterations of land landscape patterns [7, 8], evaluations of land suitability [9], and comprehensive intensity of land use [10]. These studies have mainly examined the magnitude of regional inequalities in land use preferences and the valuation of property parcels, thereby evaluating the likelihood of future land use conflicts [11]. From an ecological point of view, the occurrence of intense land use conflicts can lead to frequent changes in the landscape mosaic of land use types of different sizes and shapes [12], generating landscape ecological risks, which in turn lead to the emergence of ecological land degradation, deterioration of environmental conditions, and a decline in the health of ecosystems [13]. Therefore, the academic community employs the landscape ecology theory to construct indicator systems based on an environmental perspective. These systems aim to evaluate the regional ecological risks resulting from instability in land use structures [14]. The composition of land use conflicts should be 'external pressure + vulnerability - stability'. This formula depicts the sources, receptors, and impacts of landscape ecology while also quantifying the degree of regional land use conflicts. The logical implication is that the land elements are subject to external environmental interference, which puts pressure on their ecosystem [15], exacerbating the vulnerability of the land use system, making it difficult to maintain stability, and leading to conflict. This method has been widely applied in related research fields and has significant reference value for this paper. As land use conflicts continue to escalate, researchers have turned their attention to potential future conflicts. Prediction of potential conflicts relies heavily on quantitative projections of land use structure and modeling of spatial land use distribution patterns under various scenarios [16]. For example, many studies have used the CLUE-S or FLUS models to predict the magnitude of land use conflicts. However, the models mentioned above typically employ land use types as simulation units, which poses challenges in simulating and forecasting land use structural changes resulting from planning policies at a patch scale [17]. Furthermore, these models lack adaptable patch-based strategies for modeling patch growth across various natural land use types at a detailed resolution. However, the patch-generation simulation (PLUS) model improves the mining transformation rule method and can model changes in multiple land use types at a fine resolution. This effectively improves simulation accuracy [18]. Combining the gray multi-objective linear programming model with the PLUS model can define future regional development boundaries and desired development goals using a system of unequal constraints. This is done while also considering the balance between multiple objectives and reflecting the diversity of government decisions [19]. Although these studies can provide recommendations for regional development to some extent, few studies have considered ways of mitigating land use conflicts from a territorial-functional perspective.
The core area of study concerning land use conflicts centers on governance and regulation. Previous studies mainly used land use prediction models to simulate future land use conflict areas. Then, they used qualitative approaches to propose strategies and recommendations for mitigating land use conflicts. These suggestions primarily focus on structure optimization, overall allocation, ecological protection, and other factors [20]. The first approach is to formulate scientific land planning policies, strengthen land use control and fragmentation management, promote the economical and intensive use of land, and mitigate landscape fragmentation. The second method entails implementing stringent procedures to govern the conversion of unproductive land categories. This will be achieved through enhanced ecological protection efforts, aiming to expand the extent of ecological land utilization, enhance landscape stability, and resolve land use conflicts. Therefore, it is essential to conduct an impartial and thorough examination of the mitigation impacts of various policy interventions on land use conflicts while considering geographic space, landscape ecology, and the policy environment. These analyses should not be only qualitative but need to include quantitative measurements. This is the biggest difference between our research and previous works.
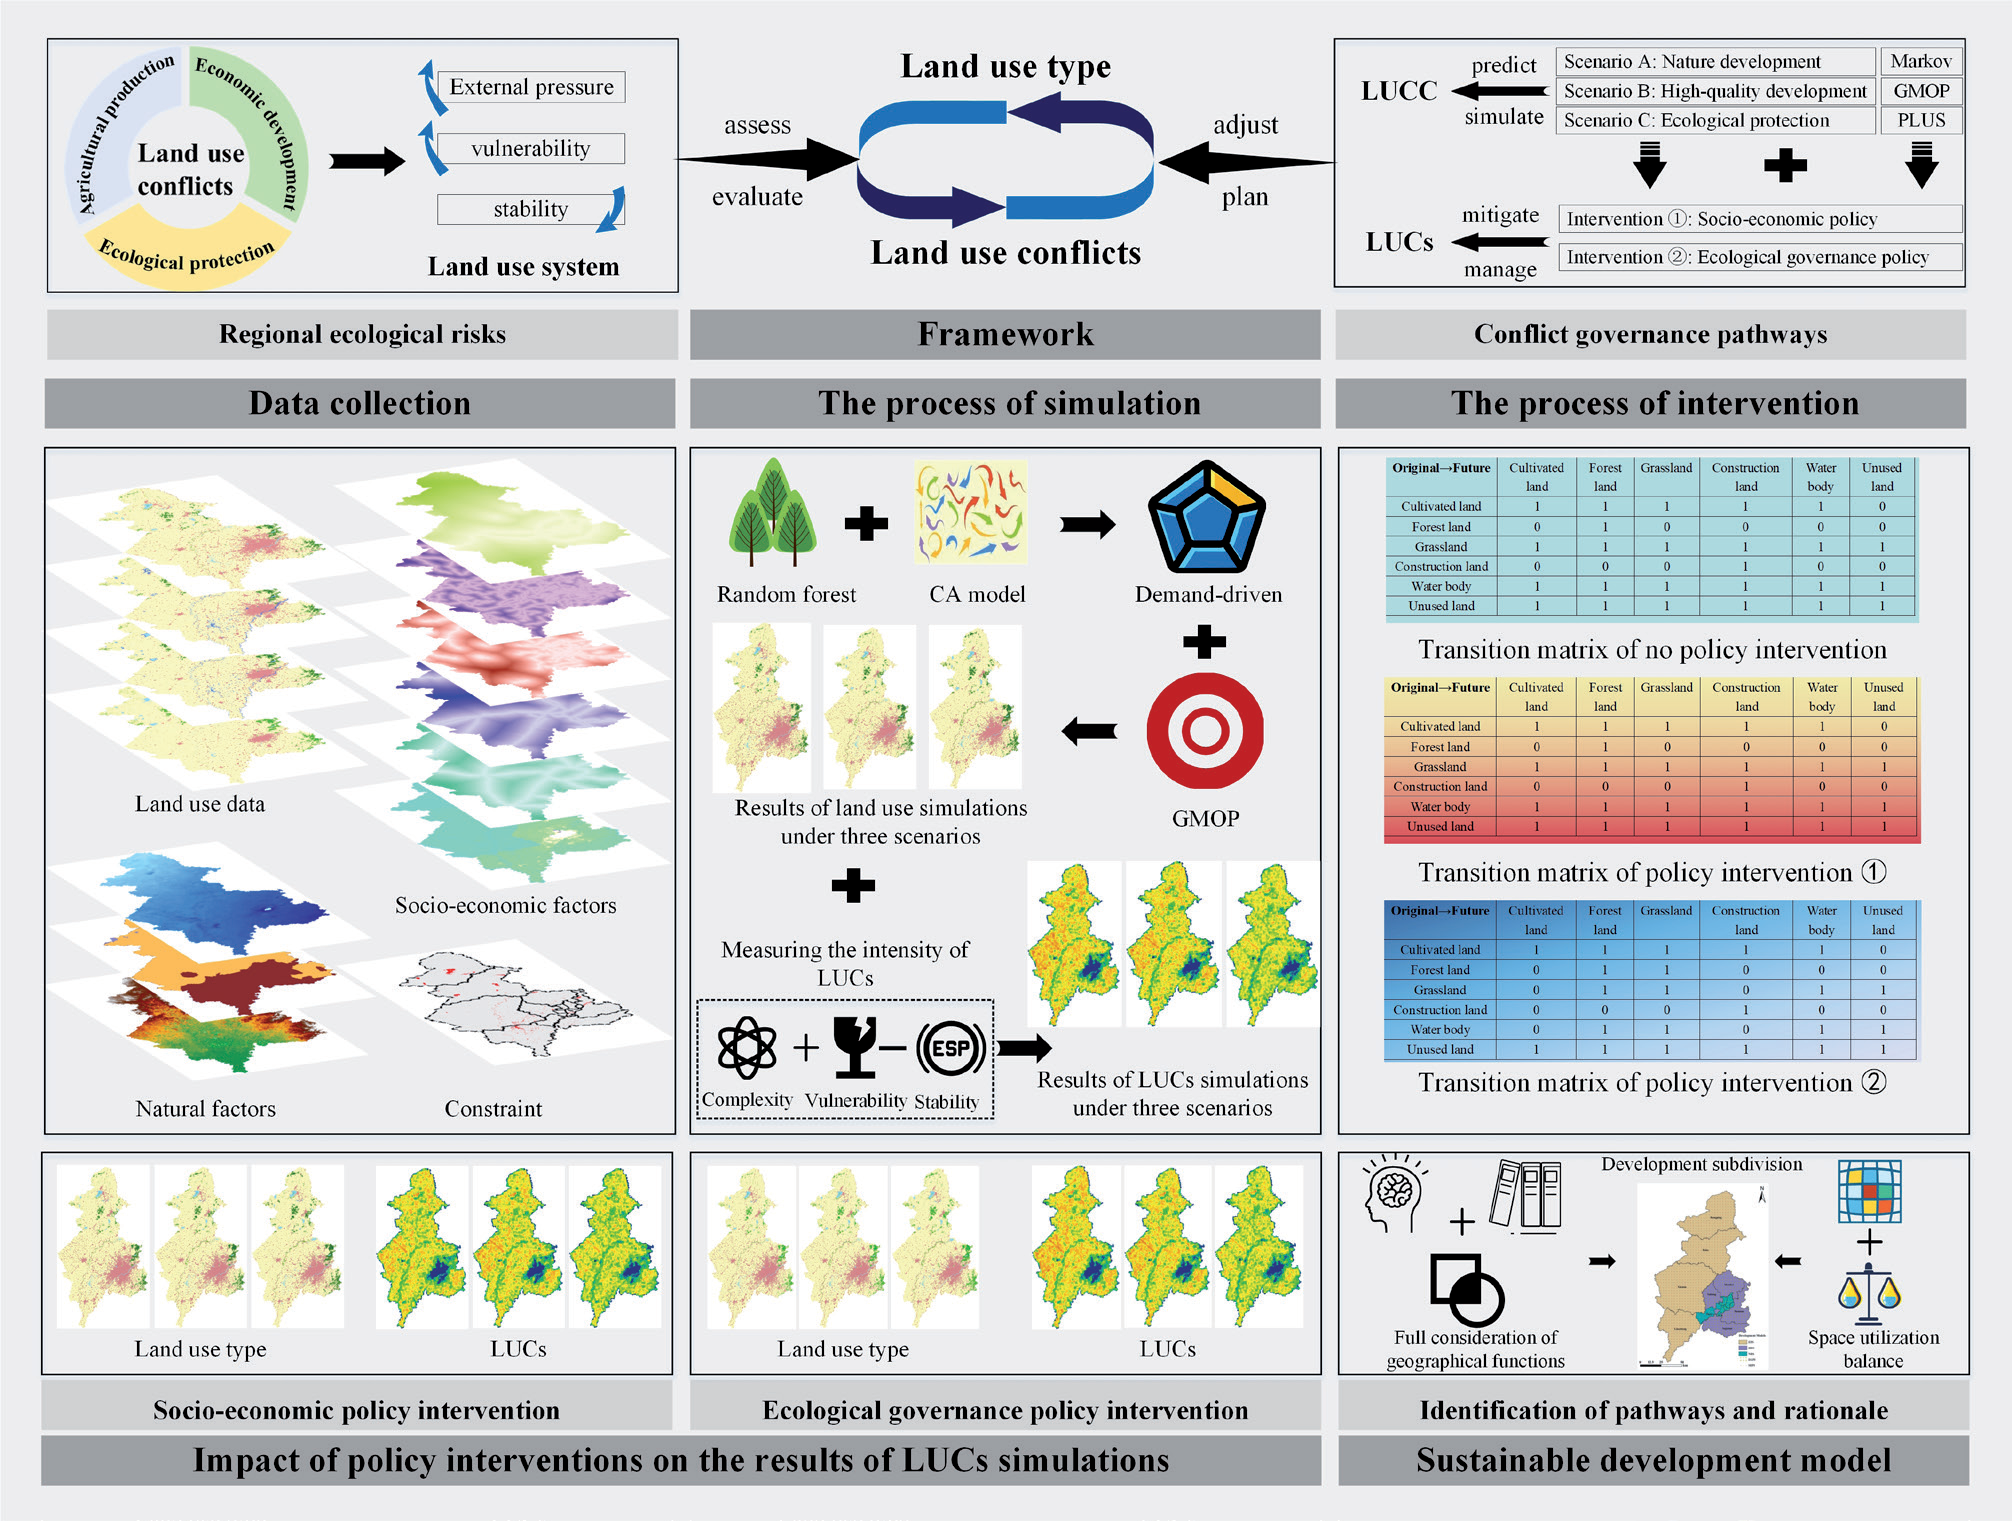
Shenyang, the only megacity in the main grain-producing region of northeastern China [21], is a political and economic center as well as an important food production region. It is situated at the southeastern periphery of the Horqin Sandy Land, recognized as a first-class sensitive ecological zone in China [22]. It is located in two sensitive regions: soil erosion in Northeast China and the Mengxi desertification and salinization area. Its ability to resist environmental interference is poor, and the ecological function of some areas is fragile. Food production, economic development, and ecological protection are all territorial functions that must be performed [23]. To continuously balance production-living-ecological space, land use types and layouts in Shenyang have changed frequently, and the stability of the land use system has declined, generating intense land use conflicts. Taking the above factors, we chose Shenyang as a typical case to carry out the study. Our research includes the following: (1) Analyzing the spatial and temporal evolution of land use conflicts based on land use change. (2) Based on the establishment of a bottom line for food security, using the GMOP-PLUS coupled model to delineate the pattern of land use conflicts in the region in 2030 under the natural development scenario, high-quality development scenario, and ecological protection scenario. (3) Exploring the impact of policy interventions on future land use conflicts. Ultimately find ways to both effectively mitigate land use conflicts and promote sustainable development in Shenyang City (Fig. 1).
Material and Methods
Study Area
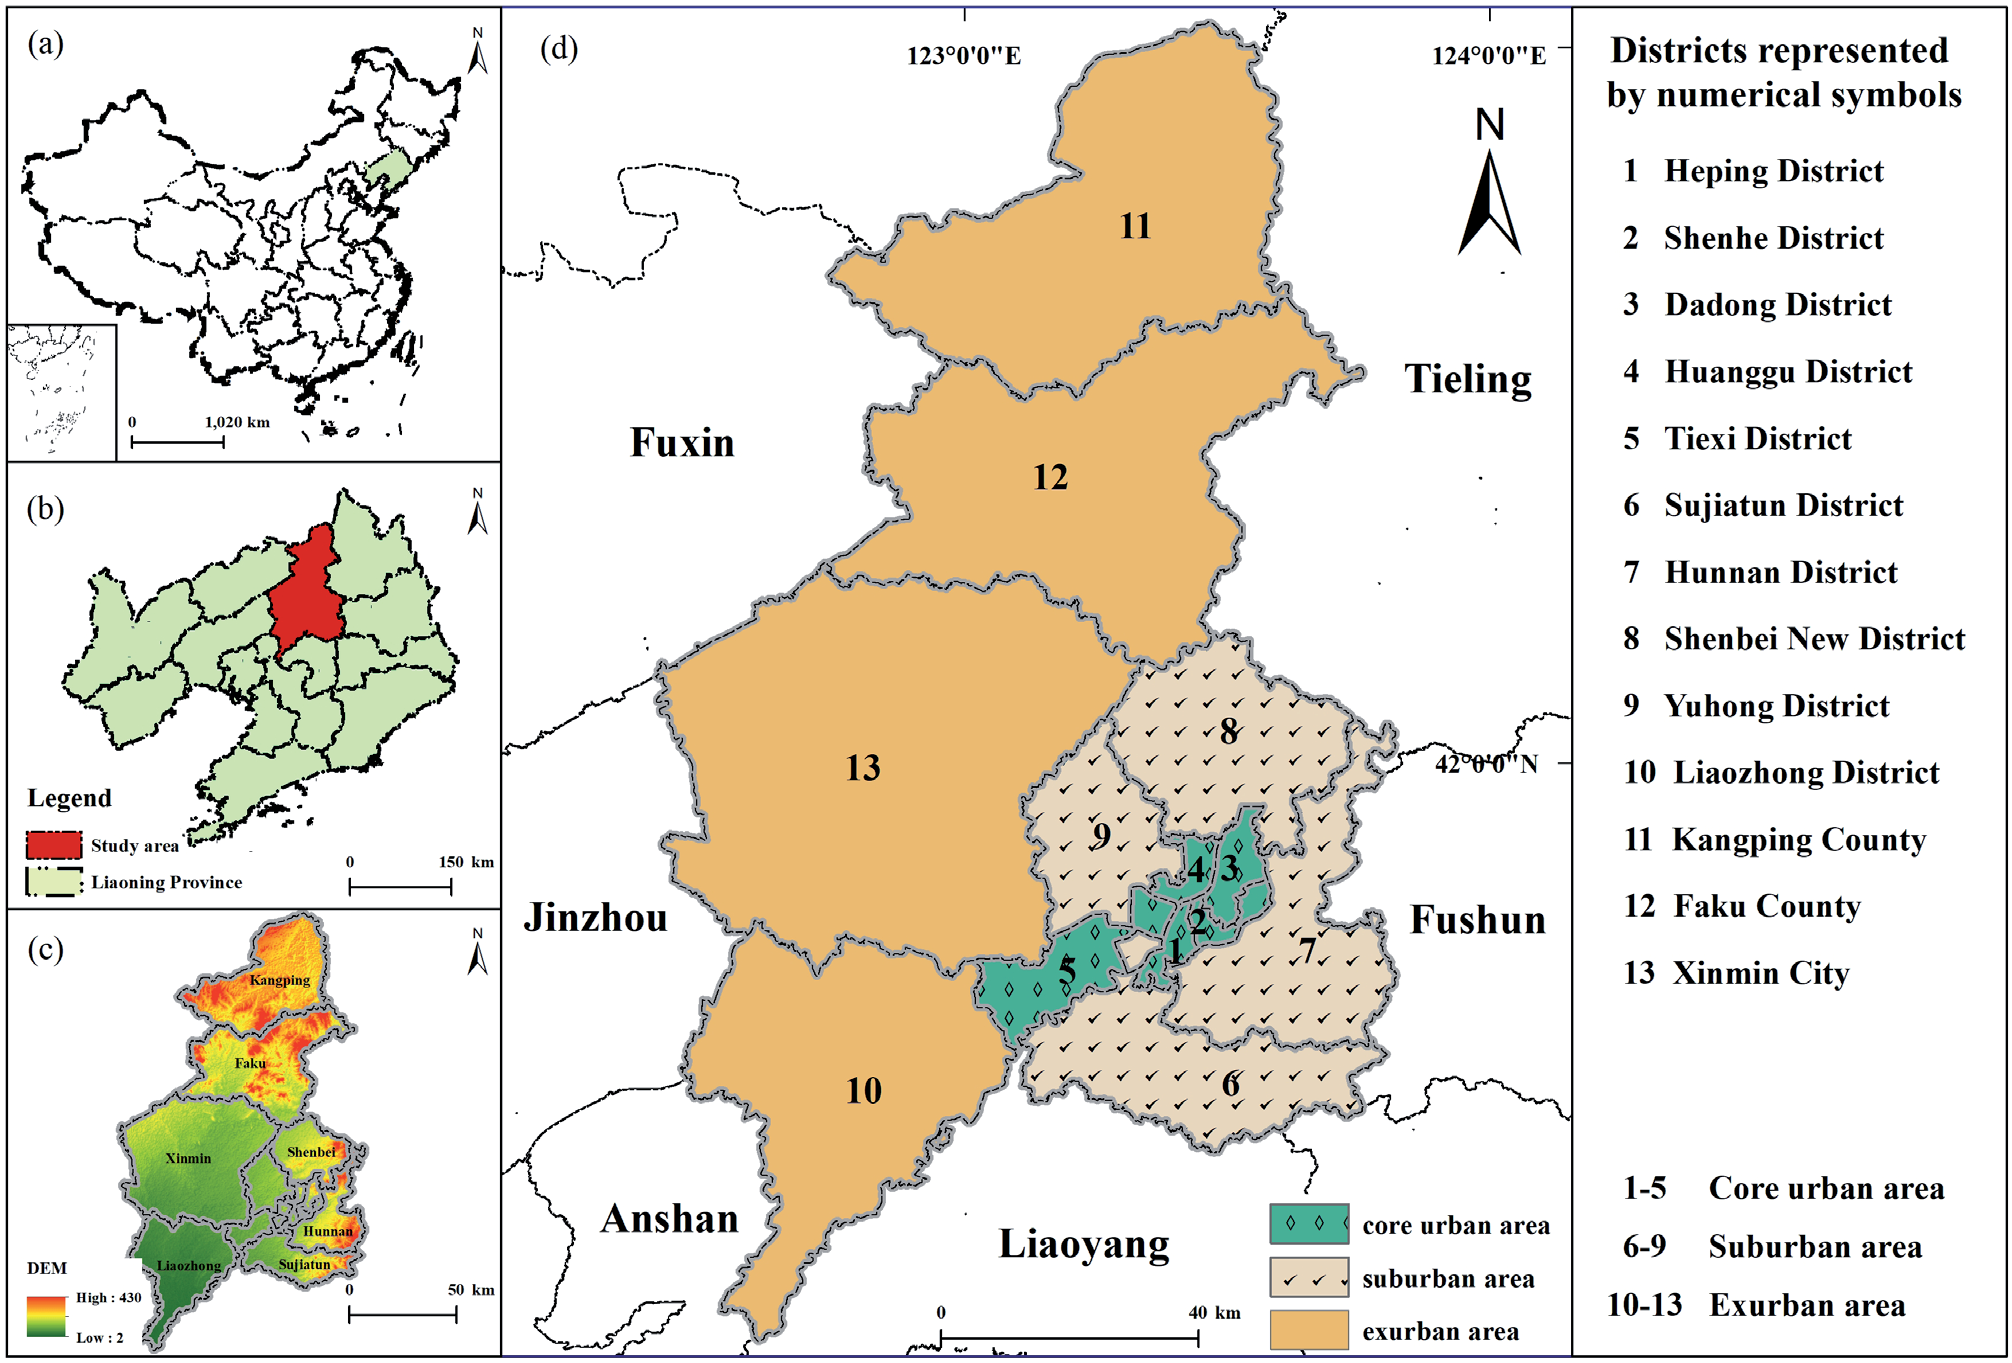
Shenyang is situated in the southern part of Northeast China. It is bordered to the south by Benxi and Liaoyang, and to the north by Horqin Left Rear Banner in the Inner Mongolia Autonomous Region. It is bounded east by Fushun and west by Anshan, Jinzhou, and Fuxin. The region serves as a prominent hub for grain production in the northeastern area while also functioning as a center for politics, economy, culture, and trade. Shenyang is located at 122° 24 ′ 39 ″ ~ 123° 47 ′ 52 ″ E, and 41° 11 ′ 59 ″ ~ 43° 02 ′ 42 ″ N. It belongs to the warm continental climate, with an annual rainfall of 600-800 mm. Shenyang has twenty-seven rivers, notably the Liaohe and Hunhe rivers. It has a flat topography, mostly plains, with an elevation of roughly 50 meters. The natural environment in this region is great, and land development is quite simple. The soil types are mainly meadow, fluvial, brown, and paddy. They are suitable for growing various crops and serve as an important commodity grain base in China. Shenyang governs ten districts, two counties, and one city. Heping District, Shenhe District, Dadong District, Huanggu District, and Tiexi District are in the core urban area. Sujiatun District, Hunnan District, Shenbei New District, and Yuhong District are in the suburban area. Liaozhong District, Kangping County, Faku County, and Xinmin City are in the exurban area (Fig. 2). The permanent resident population of the city was 9.204 million in 2023, with a 7.834 million urban population (an urbanization rate of about 85.12%), and a comparatively high intensity of land development. The area of Shenyang is 12,860 km2, with cultivated land constituting around 63% of the total area [24]. With the rapid development of urbanization and industrialization, the ecological space and agricultural space in Shenyang City are constantly being crowded out. Land use changes are frequent and land use conflicts are intensifying.
Data Collection
The primary data utilized comprise land use data and driver data, encompassing statistical data and basic geographic information data.
Land use data come from the Chinese Academy of Sciences Resource and Environmental Science Data Centre (https://www.resdc.cn), and the 30 m annual land cover dataset and its dynamics in China from 1990 to 2019, which is based on Landsat TM / ETM / OLI remote sensing images and classified into six main types due to the land use cover change classification standard. The main classification types are cultivated land, forest land, grassland, water body, construction land, and unused land. The data accuracy is greater than 80%, which is sufficient for research purposes. For more information on data sources and processing, please refer to the relevant documents [25].
Statistical data come from the Shenyang Statistics Bureau (http://tjj.shenyang.gov.cn/) and the Statistics Bureau of Liaoning Province (https://tjj.ln.gov.cn/).
Geographic information data include administrative boundaries (https://www.resdc.cn/), annual precipitation (https://doi.org/10.5281/zenodo.3185722.), average annual temperature (https://doi.org/10.11888/Meteoro. tpdc.270961), annual sunshine hours, DEM (https:// www.gscloud.cn/), population (http://www.resdc.cn), GDP (http://www.resdc.cn), soil type (https://www.fao. org/soils-portal), and road data (www.openstreetmap. org).
Methods
Model for Measuring the Intensity of Land Use Conflicts
The essence of land use spatial conflicts is the process of spatial and temporal competition and game between various land use subjects and stakeholders. Its connotation is the evolution of various interest conflicts and land use types epitomized by land use conflicts. The land use system is characterized by complexity, vulnerability, and dynamics. Therefore, the analysis of land use conflicts needs to be considered from complexity, vulnerability, and dynamics [26].
Land provides the space in which surface landscapes can be shaped, so changes in land use patterns due to land use conflicts are highly correlated with the spatial and temporal dynamics of landscape ecological risks [27]. In other words, the landscape pattern is a spatial manifestation of land use conflicts, reflecting the inherent contradiction concerning land use structure and the ecological environment. Therefore, we chose the ecological risk assessment conceptual framework to examine land use conflicts through the pressure-vulnerability-stability process. The "risk source, risk receptor, risk effect" conceptual model was employed for ecological risk assessment. Complexity, vulnerability, and stability indexes were selected as indicators to analyze land use conflicts. Referring to previous studies [28], the comprehensive land use conflicts calculation model can be abstracted as "complexity + vulnerability -stability" of the land use system.
LUCs is the intensity of land use conflicts, P is the complexity index, V is the vulnerability index, and S is the stability index.
Complexity index (P). It reflects the impact of human activities on land use patterns. The study utilized the area-weighted mean patch fractal dimension (AWMPFD) to evaluate the complexity of landscape patches, which indicates external pressures [29].
Pij is the patch perimeter, aij is the patch area, and A is the total landscape area.
Vulnerability index (V). It reflects the degree to which the land use system responds to external pressures and elucidates the exposure status of land patches. Based on variations in susceptibility among distinct land use categories as risk receptors, and in conjunction with the developmental attributes of the study region and pertinent literature sources [30], this investigation established vulnerability indices for construction land, forest land, grassland, cultivated land, water body, and unused land as 1, 2, 3, 4, 5, and 6.
Vi is the vulnerability index of the i-th land use landscape type, fi is the vulnerability index of different landscape types, ai is the area of the i-th land use type within the spatial unit, and Z is the total area of the spatial unit.
Stability index (S). Patch density can be used to reflect the stability of the landscape. A higher density number indicates increased fragmentation within a specific spatial unit. There is a reduction in regional biodiversity and cohesiveness, which signifies diminished stability and an increased probability of ecological hazards to land resources. Each spatial unit was standardized within the range of [0, 1].
PD is the patch density index within spatial landscape unit, PDmax and PDmin represent the maximum and minimum values of the patch density index for the spatial landscape units, and ni is the number of patches in the i-th land use type within the spatial unit.
The Centre for Peace and Conflict Studies of Uppsala University in Sweden proposed a life-cycle model of conflict (the inverted U-curve model), which argued that conflict and peace show parabolic changes over time and as the level of conflict evolves, and exhibit a certain degree of periodicity [31]. Our research adopted the inverted U-curve model of conflict to classify the controllability of land use conflicts into four levels: stable and controllable, basic controllable, mild loss of control, and severe loss of control by the parabolic development process of conflict. When dividing the four levels, we believe the latent period of land use conflicts is long. Its controllable stage should account for the vast majority of it, and the loss of control stage accounts for a smaller part. Therefore, based on the existing studies, we divided four levels of land use conflicts into stable and controllable [0, 0.35), basic controllable [0.35, 0.7), mild loss of control [0.7, 0.9), and severe loss of control [0.9, 1.0] [32-34].
Scale Setting for Landscape Pattern Index Analysis
The land use conflicts measurement model constructed in this research involves the calculation of the landscape index, and the landscape pattern index has a strong scale effect. The scale can be divided into granularity and amplitude. Different landscape granularity and analysis amplitude have a significant impact on the results of the landscape index calculation, which in turn affects the accuracy of conflict index measurement [35]. After multiple attempts, the accuracy loss of the total area of the regional landscape is minimized when the landscape granularity is 90 m. When the window radius reaches 3 km, the base ratios of various indicators tend to stabilize, indicating that the 3 km window radius can reflect the intrinsic scale of spatial variability of landscape patterns in the study area. Therefore, the particle size of this study is 90 m and the window size is 3 km * 3 km.
Patch-Generation Simulation Model for Land Use Change
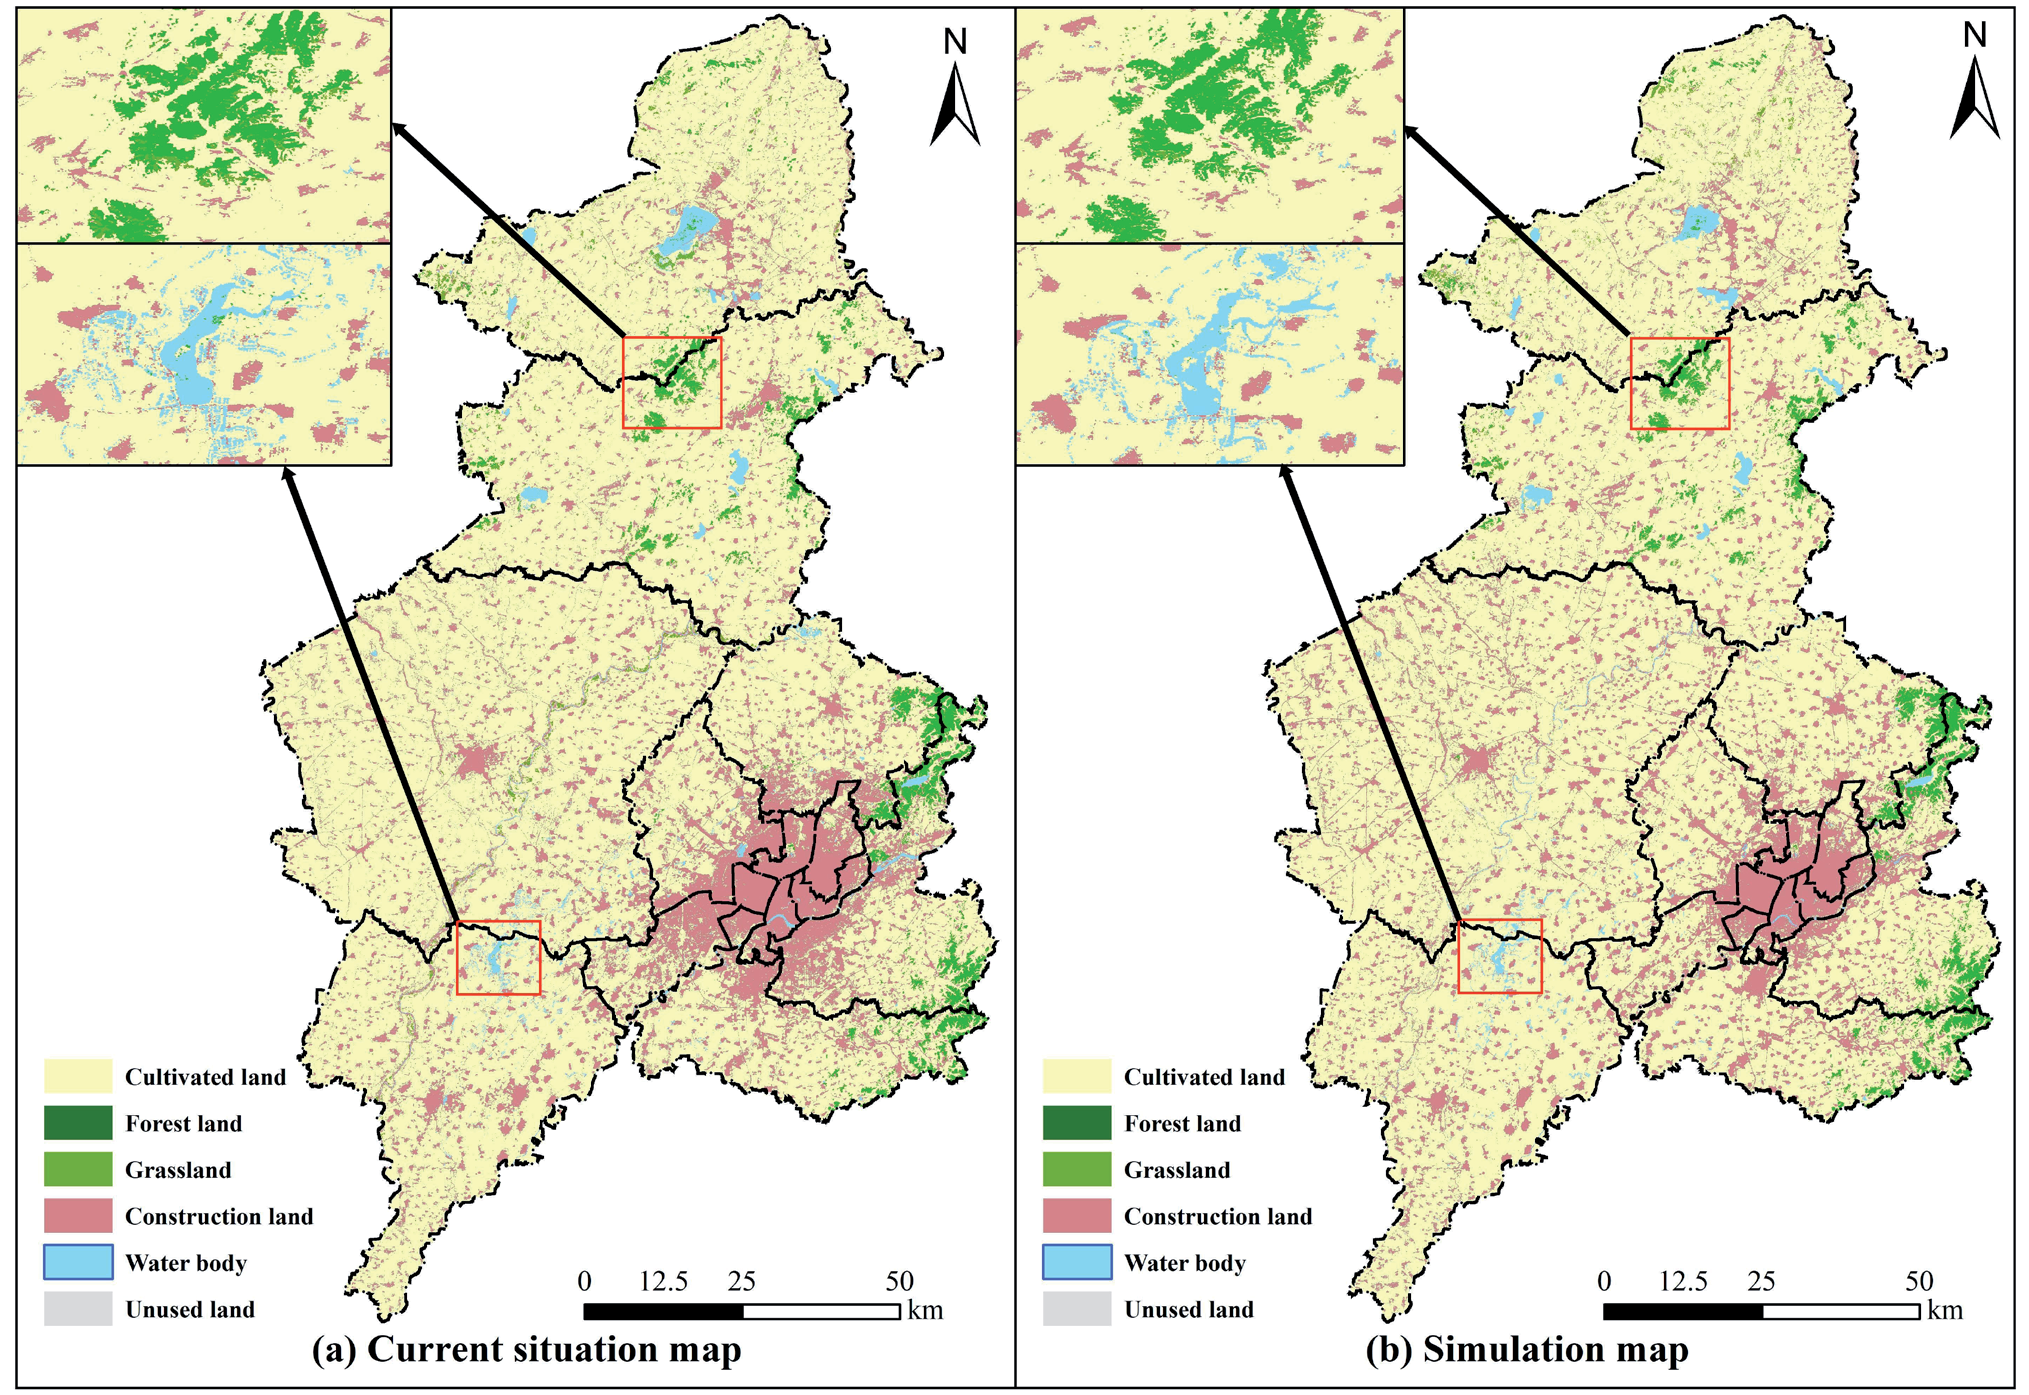
The PLUS model utilizes a patch generation mechanism and threshold decline mechanism to dynamically mimic changes in different land use categories. The Liang [36] study suggested that the limitations identified in mining transformation rules in existing models and the simulation of landscape dynamics can be effectively addressed. We chose the PLUS model to simulate the land use spatial pattern in Shenyang in 2030 across many scenarios to conduct a scenario diversity study of land use conflicts. The accuracy of this model was assessed by comparing it to two sets of land use data in 2019 (Fig. 3). The evaluation yielded a kappa coefficient of 0.87 and a FOM value of 0.17, suggesting that the simulation results were dependable.
Grey Multi-Objective Linear Programming (GMOP) Model
We applied the Markov model to linearly predict the land resources in Shenyang City in 2030 under the NDS. The GMOP model set constraints (Table 1) and calculated the number of land resources under HDS and EPS. This process aims to derive an optimal solution for allocating land resources [37].
(1) Natural development scenario
A linear prediction model has been constructed to forecast the configuration of land use in 2030. This model leverages past trends of land use changes in Shenyang, spanning from 1986 to 2019. The given scenario postulated that land use types evolve organically along their historical trajectories, unaffected by external factors.
(2) High-quality development scenario
Shenyang holds a significant position as a central city in Northeast China, functioning as a notable center for innovative equipment manufacture. It boasts a relatively elevated level of economic development. The study presents a high-quality development scenario based on food security, drawing upon the development plan of Shenyang. It further simulates the land use structure to identify the configuration that yields the best economic benefits. The formula used for estimating economic benefits is as follows:
f1(x) is the total economic benefit, Ecoi is the economic benefit associated with the land use category on a per unit area basis (10,000 RMB/hm2) and xi is the area of land use type (hm2), the indices in question span from 1 to 6, denoting cultivated land, forest land, grassland, water body, construction land, and unused land. Referring to relevant research [38], the economic benefits associated with cultivated land, forestland, grassland, and water bodies were assessed using the output values of agriculture, forestry, animal husbandry, and fisheries. The economic benefits of building land were assessed by quantifying the overall output value generated by the secondary and tertiary sectors. The economic value attributed to unused land was determined to be zero. Eq. (9) can be rewritten as:
Table 1.
Constraint conditions for multi-objective programming.
(1) Ecological protection scenario
The ecological protection scenario aims to maximize ecosystem service value by ensuring food security and promoting ecological prioritization in Shenyang, where various land use types can provide maximum ecological benefits. Setting up this scenario shows the essential reference value for mitigating land use conflicts and preventing ecological risks. The formula used to estimate the value of ecosystem services is as follows:
f2(x) is the value of service for the total ecosystem, Esvi is the ecosystem service value per unit area of land use types (10,000 RMB/ hm2), a is the area of each grid cell, it is 1 hm2 in this study. The ecosystem service value equivalent factor, denoted as D, is a metric used to quantify the value of ecosystem services, which is calculated to be 2242.88 RMB/hm2 according to the national average grain price of 2.19 RMB/kg in 2018 and Eij is the equivalent coefficient of ecosystem services provided by land utilization [39]. Assuming the value of construction land Esv is 0, Eq. (11) can be rewritten as:
Under the optimized development scenario, the objective function will be subject to constraints imposed by practical considerations. This study has added constraints based on relevant research and the existing development plan in Shenyang to the GMOP model. The predetermined objective function and constraint conditions were loaded into the simulation analysis module within the Office software suite to ascertain the land use demand within the context of the HDS and the EPS.
Policy Interventions in Land Use Conflicts Simulation
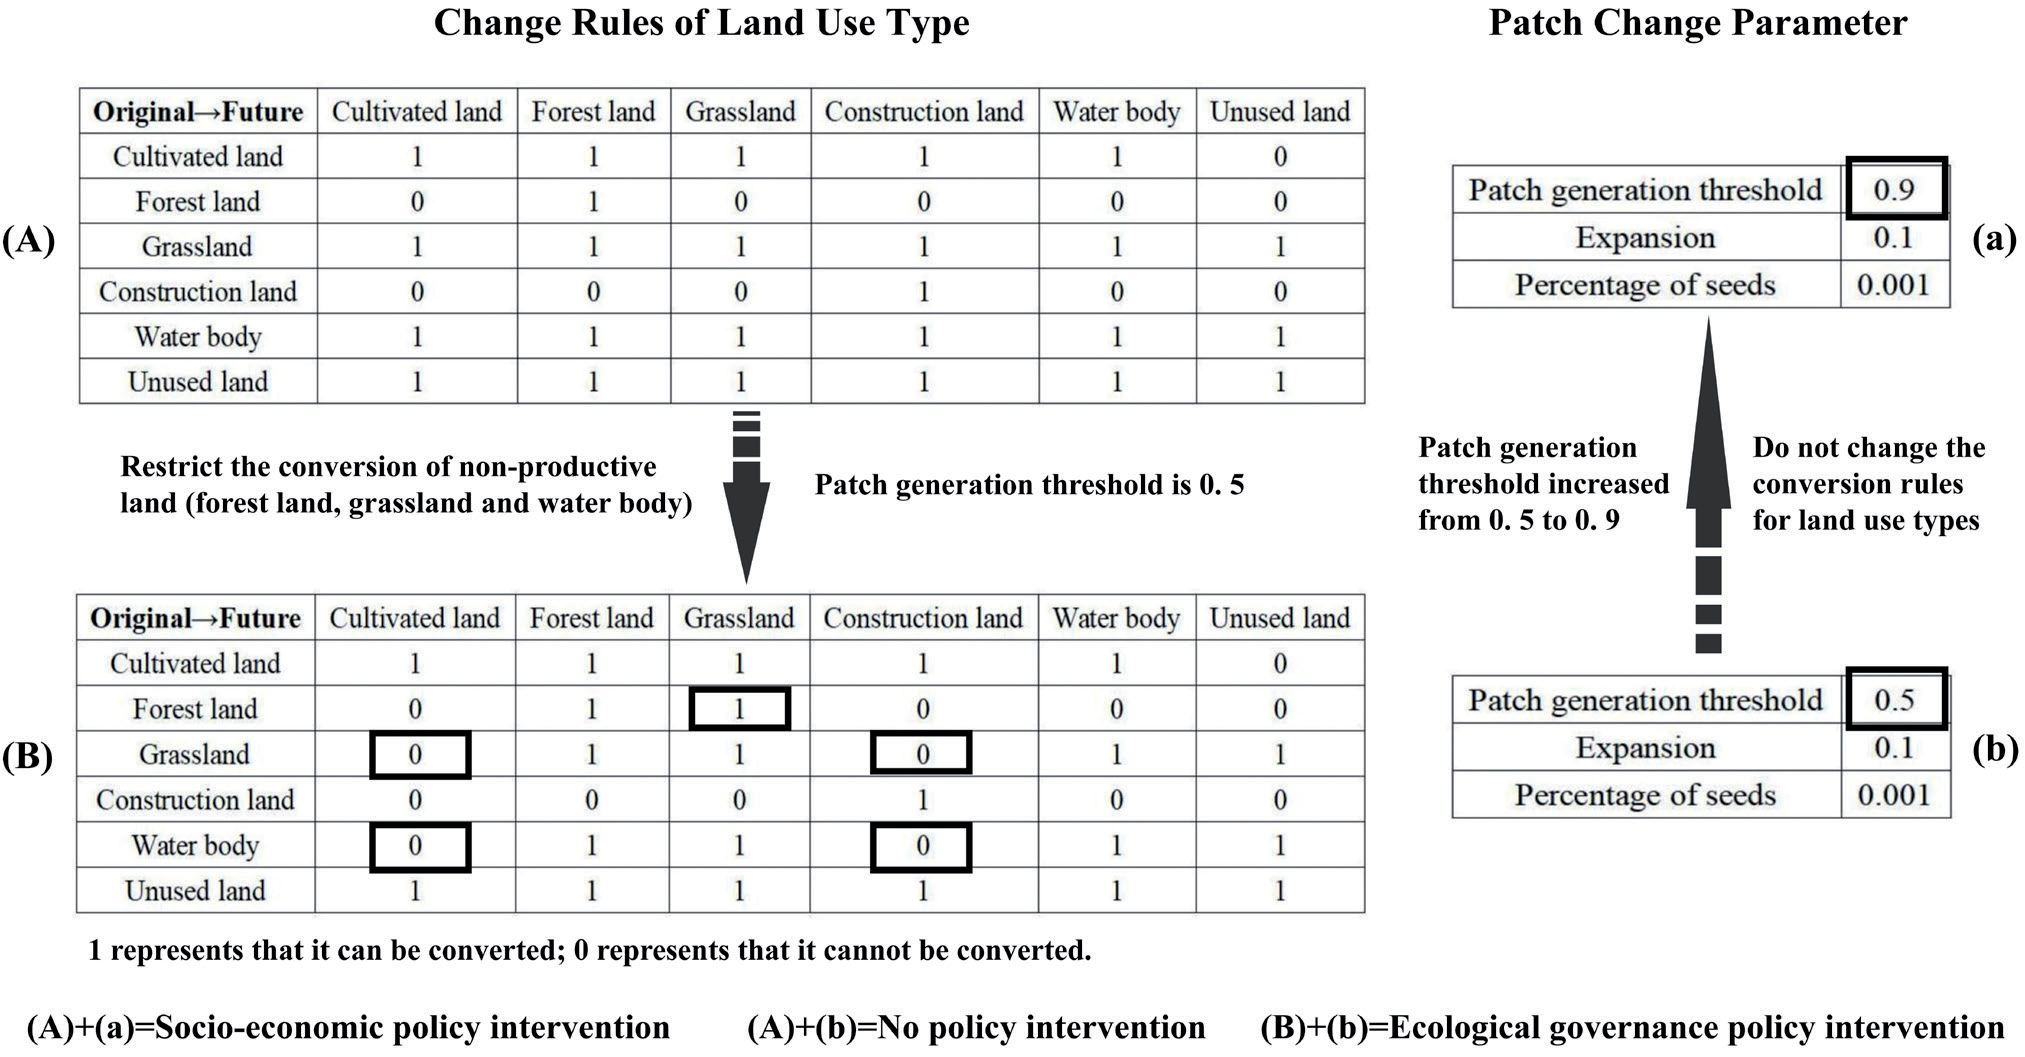
The core subject of land use conflict governance and regulation is government, achieved through the interaction of top-down policy interventions, represented by spatial planning, and bottom-up collaborative networks and consultation systems. There are two main types of policy interventions available [15]: one is socio-economic policy interventions (SEPI), which aim to alleviate land use conflicts by developing spatial planning, strengthening land management by dividing into smaller units, improving land conservation and intensification, and reducing landscape fragmentation. The second is ecological governance policy interventions (EGPI), which strictly control the conversion of forest land, grassland, water bodies, and other land types not for production purposes. They increase the area of ecological land use, enhance the stability of landscape structure, and alleviate land use conflicts. Both policy interventions focus on strengthening land use control. However, SEPI emphasizes the spatial concentration of land use. In comparison, the EGPI emphasizes landscape connectivity and ecological integrity. Therefore, based on the regional primary function, the land use change rules or parameters in the PLUS model were modified and combined with existing research to simulate the spatial pattern of land use conflicts under different policy interventions and determine the mitigation effect of various policy measures on land use conflicts (Fig. 4).
The research mainly modified the change rules of land use types and patch change parameters in the PLUS model when simulating different policy measures. When simulating scenarios without policy intervention and SEPI, the study determined the rules for land use type conversion based on historical conditions. And the focus of EGPI is to protect ecological land. Therefore, we modified the conversion rules for forest land, grassland, and water bodies to restrict their conversion to non-ecological land and allow for the internal conversion of ecological land. In patch generation parameters, the patch generation threshold refers to the attenuation threshold for generating new patches, ranging from 0 to 1. A higher attenuation threshold implies a more conservative conversion strategy, which makes cells with lower overall conversion probabilities less likely to undergo changes. In addition, expansion refers to adjusting the parameters of the model's ability to generate new land use patches, ranging from 0 to 1. A higher coefficient of expansion means a higher ability to generate new plaques. The percentage of seeds is the maximum threshold for generating new seeds, ranging from 0 to 1. A higher percentage of seeds implies a more dispersed land use pattern [36]. Under the SEPI, land use will develop towards conservation and intensification, and the degree of fragmentation of patches will decrease. Therefore, this research raised the patch generation threshold to improve their agglomeration.
Results
Land Use Changes from 1986 to 2030
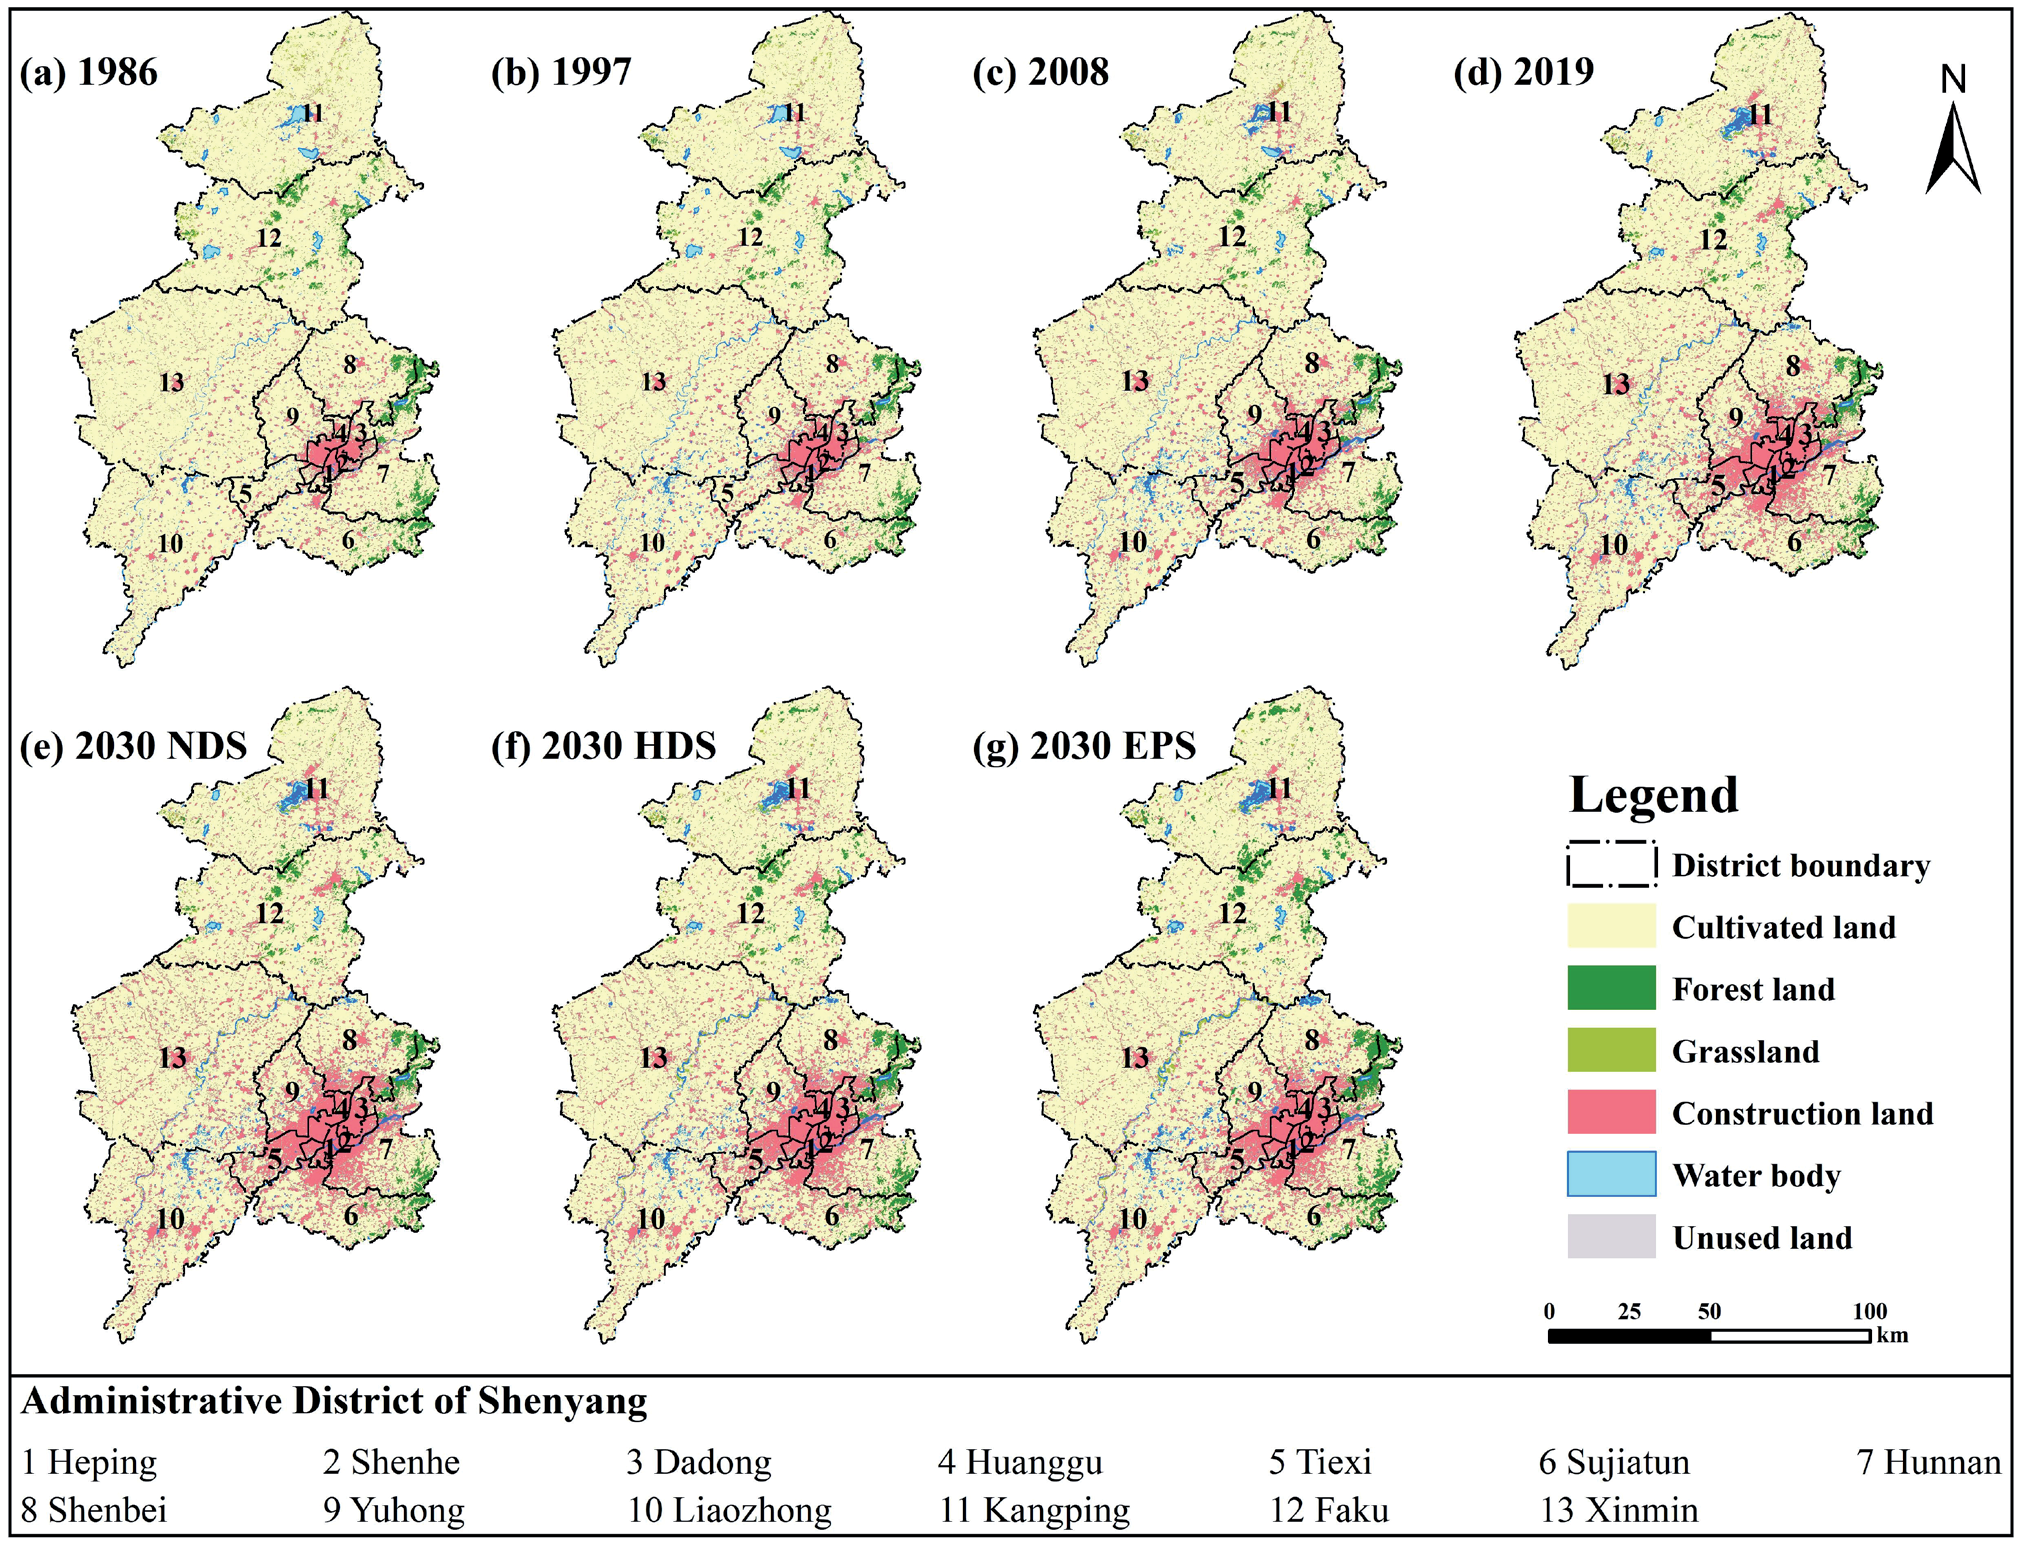
From 1986 to 2019, the predominant land use category in Shenyang was cultivated land, with a widespread distribution across the entirety of the urban area (Fig. 5(a)-(d)). The construction land area is gradually increasing, and a distinct agglomeration area has formed in the southeast of Shenyang, with a cluster-like distribution. The concentration of forest land within the city is primarily located in the eastern district, specifically within the remnant range of Changbai Mountain. There has been little change in the area. The distribution of grasslands primarily occurs in the northern region of the city, encompassing areas next to rivers and surrounding forested regions spatially. The distribution of unused land is predominantly characterized by its arrangement in strip formations alongside riverbanks. From 1986 to 2019, the total area of cultivated land in Shenyang decreased by 977.80 km2, accounting for 8.87% of the original cultivated land area, and the area of construction land increased by 1003.58 km2, with a growth rate of 83.82% (Table 2).
Table 2.
Area statistics of land use types in Shenyang /km2.
Compared to 2019, the construction land area is projected to experience growth across various development scenarios by 2030. The construction land of core urban areas will erode the surrounding land types, and the outward radiation development trend will become increasingly prominent. Under the NDS (Fig. 5(e)), the construction land area increased by 350.31 km2, an increase of 15.92%, with a radial distribution. A decline was observed in the area of other land types compared to 2019, with the most significant decrease in cultivated land (344.95 km2). In the HDS (Fig. 5(f)), there has been a discernible rise in the expansion of building land, forest land, and grassland, with a similar decline in cultivated land, water body, and unused land. In contrast to the NDS, the agglomeration degree of various land types increases significantly, patch fragmentation decreases significantly, and the degree of regional land use conservation and intensification increases significantly. The EPS shows a substantial rise in forest land, grassland, and water body, with growth rates of 48.36%, 43.92%, and 18.13%, respectively (Fig. 5(g)). The construction land area changes slightly compared to other scenarios, with a rise of 3.53%. The diminishing trend of cultivated land and unused land persists. In addition, the forest land and grassland in the remaining areas of the Changbai Mountain range in the eastern part of Shenyang changed from cluster distribution to block distribution.
Spatio-Temporal Pattern Evolution of Land Use Conflicts in the Past and Future
Change in Land Use Conflicts frOm 1986 to 2019
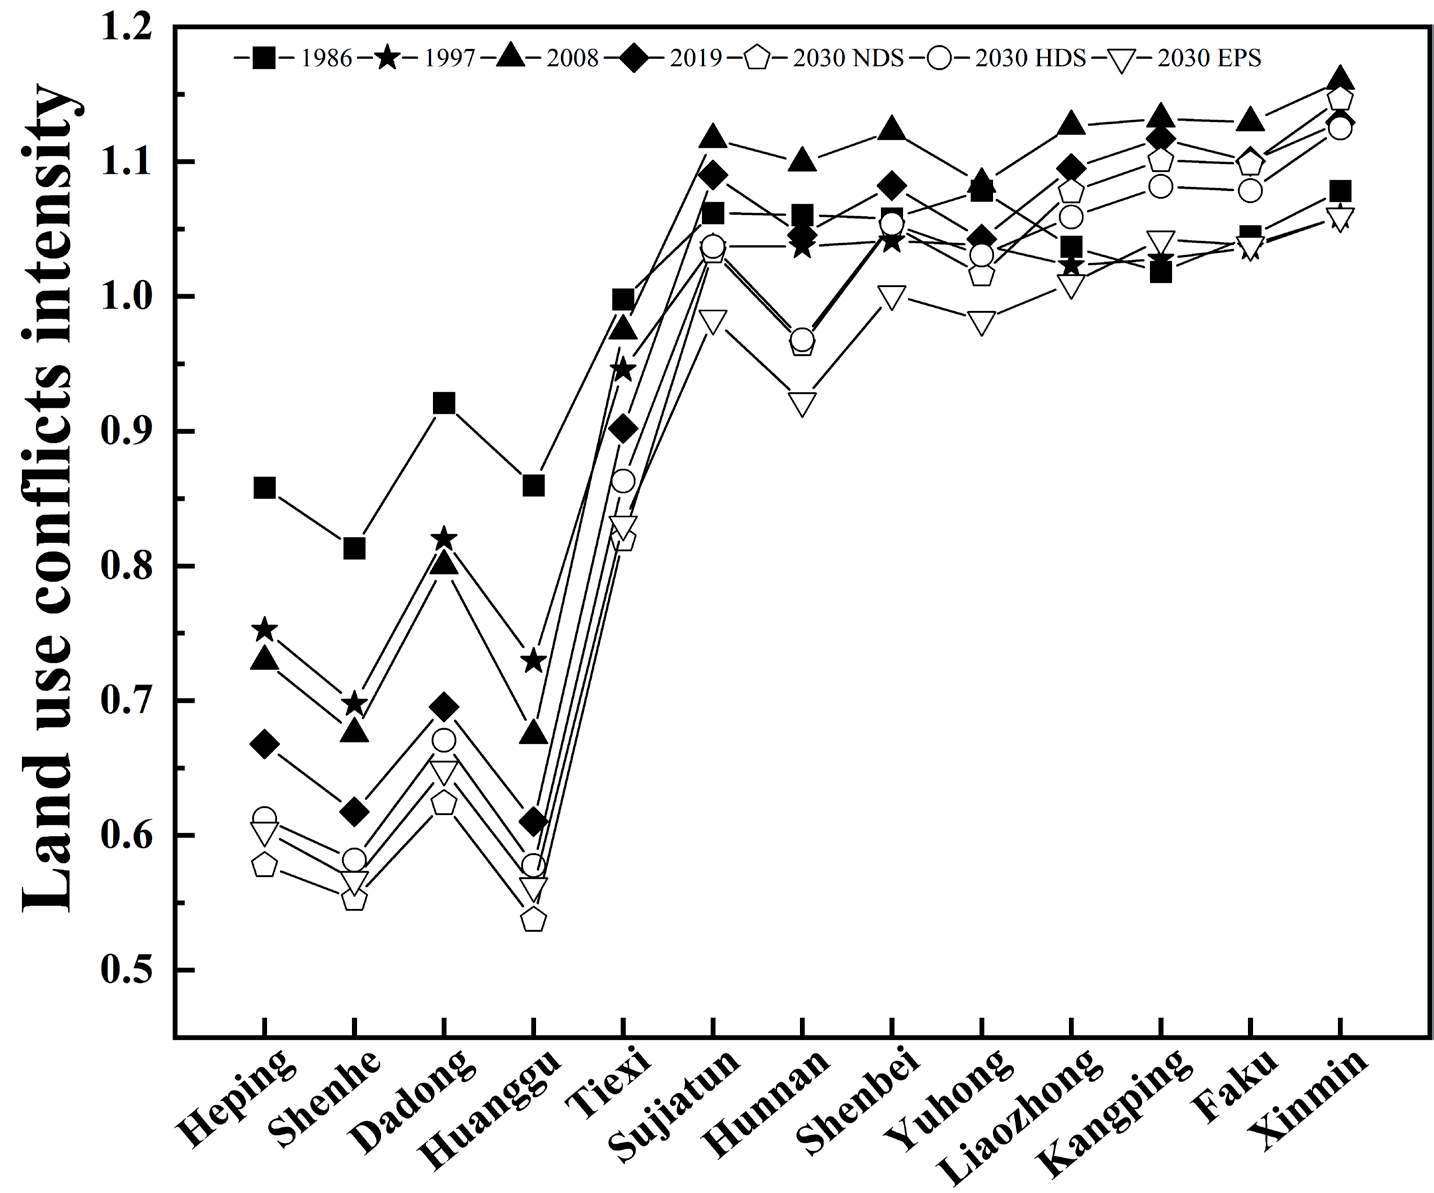
The temporal analysis reveals a decline in the magnitude of land use conflicts in Shenyang over the period spanning from 1986 to 2019 (Fig. 6). In 1986, the mean intensity of land use conflicts in Shenyang was 1.0471, distributed spatially in a clump-like manner. The conflict intensity was lower in urban centers and overall lower than the average for the study area. Xinmin, Yuhong, Hunnan, and Sujiatun showed higher conflict intensity, all greater than 1.05. In 1997, the average value in Shenyang City was 1.0313, which was a slight decrease from 1986. The intensity of conflict in Xinmin, the eastern part of Hunnan District, and the east part of Sujiatun District remained high. In contrast, the magnitude of land use conflicts was reduced inside the core urban area, with a noticeable trend towards their proliferation. In 2008, the average intensity in Shenyang was 1.1200. Its spatial pattern underwent significant changes, and except for the core urban area, the conflict intensity in other regions increased. The average intensity in Shenyang was 1.0881 in 2019. The intensity of land use conflicts continued to decrease in the core urban area, and its spatial pattern began showing low levels on both sides of the river.
Overall, the degree of land use conflicts in five core urban areas, Heping, Shenhe, Dadong, Huanggu, and Tiexi, exhibited a persistent decline. The intensity of land use conflicts in Hunnan fluctuated downward. However, other regions showed a fluctuating upward trend. Regarding spatial distribution, the degree of land use conflicts in Shenyang between 1986 and 2019 exhibits a discernible differentiation spatial pattern. The core urban area had a low intensity of conflict, while other regions displayed a higher intensity (Fig. 7(a)-(d)).
Change in Land Use Conflicts from 2019 to 2030
In the 2030 NDS, the average value of land use conflict intensity in Shenyang is 1.0724. The five core urban areas have the lowest land use conflict intensity compared to other scenarios. The intensity of land use conflicts in the four suburban areas is between the HDS and the EPS. The four exurban areas have the highest intensity of land use conflicts. In the 2030 HDS, the average value of land use conflict intensity in Shenyang is 1.0605. The five core urban districts and the four suburban areas are the highest level of the three scenarios. The land use conflict intensity of four exurban areas falls between the NDS and the EPS. Under the 2030 EPS, the average value of land use conflict intensity in Shenyang is 1.0114. The land use conflict intensity in five core urban areas is between the NDS and the HDS, while the land use conflict intensity in the remaining nine regions is at the lowest level.
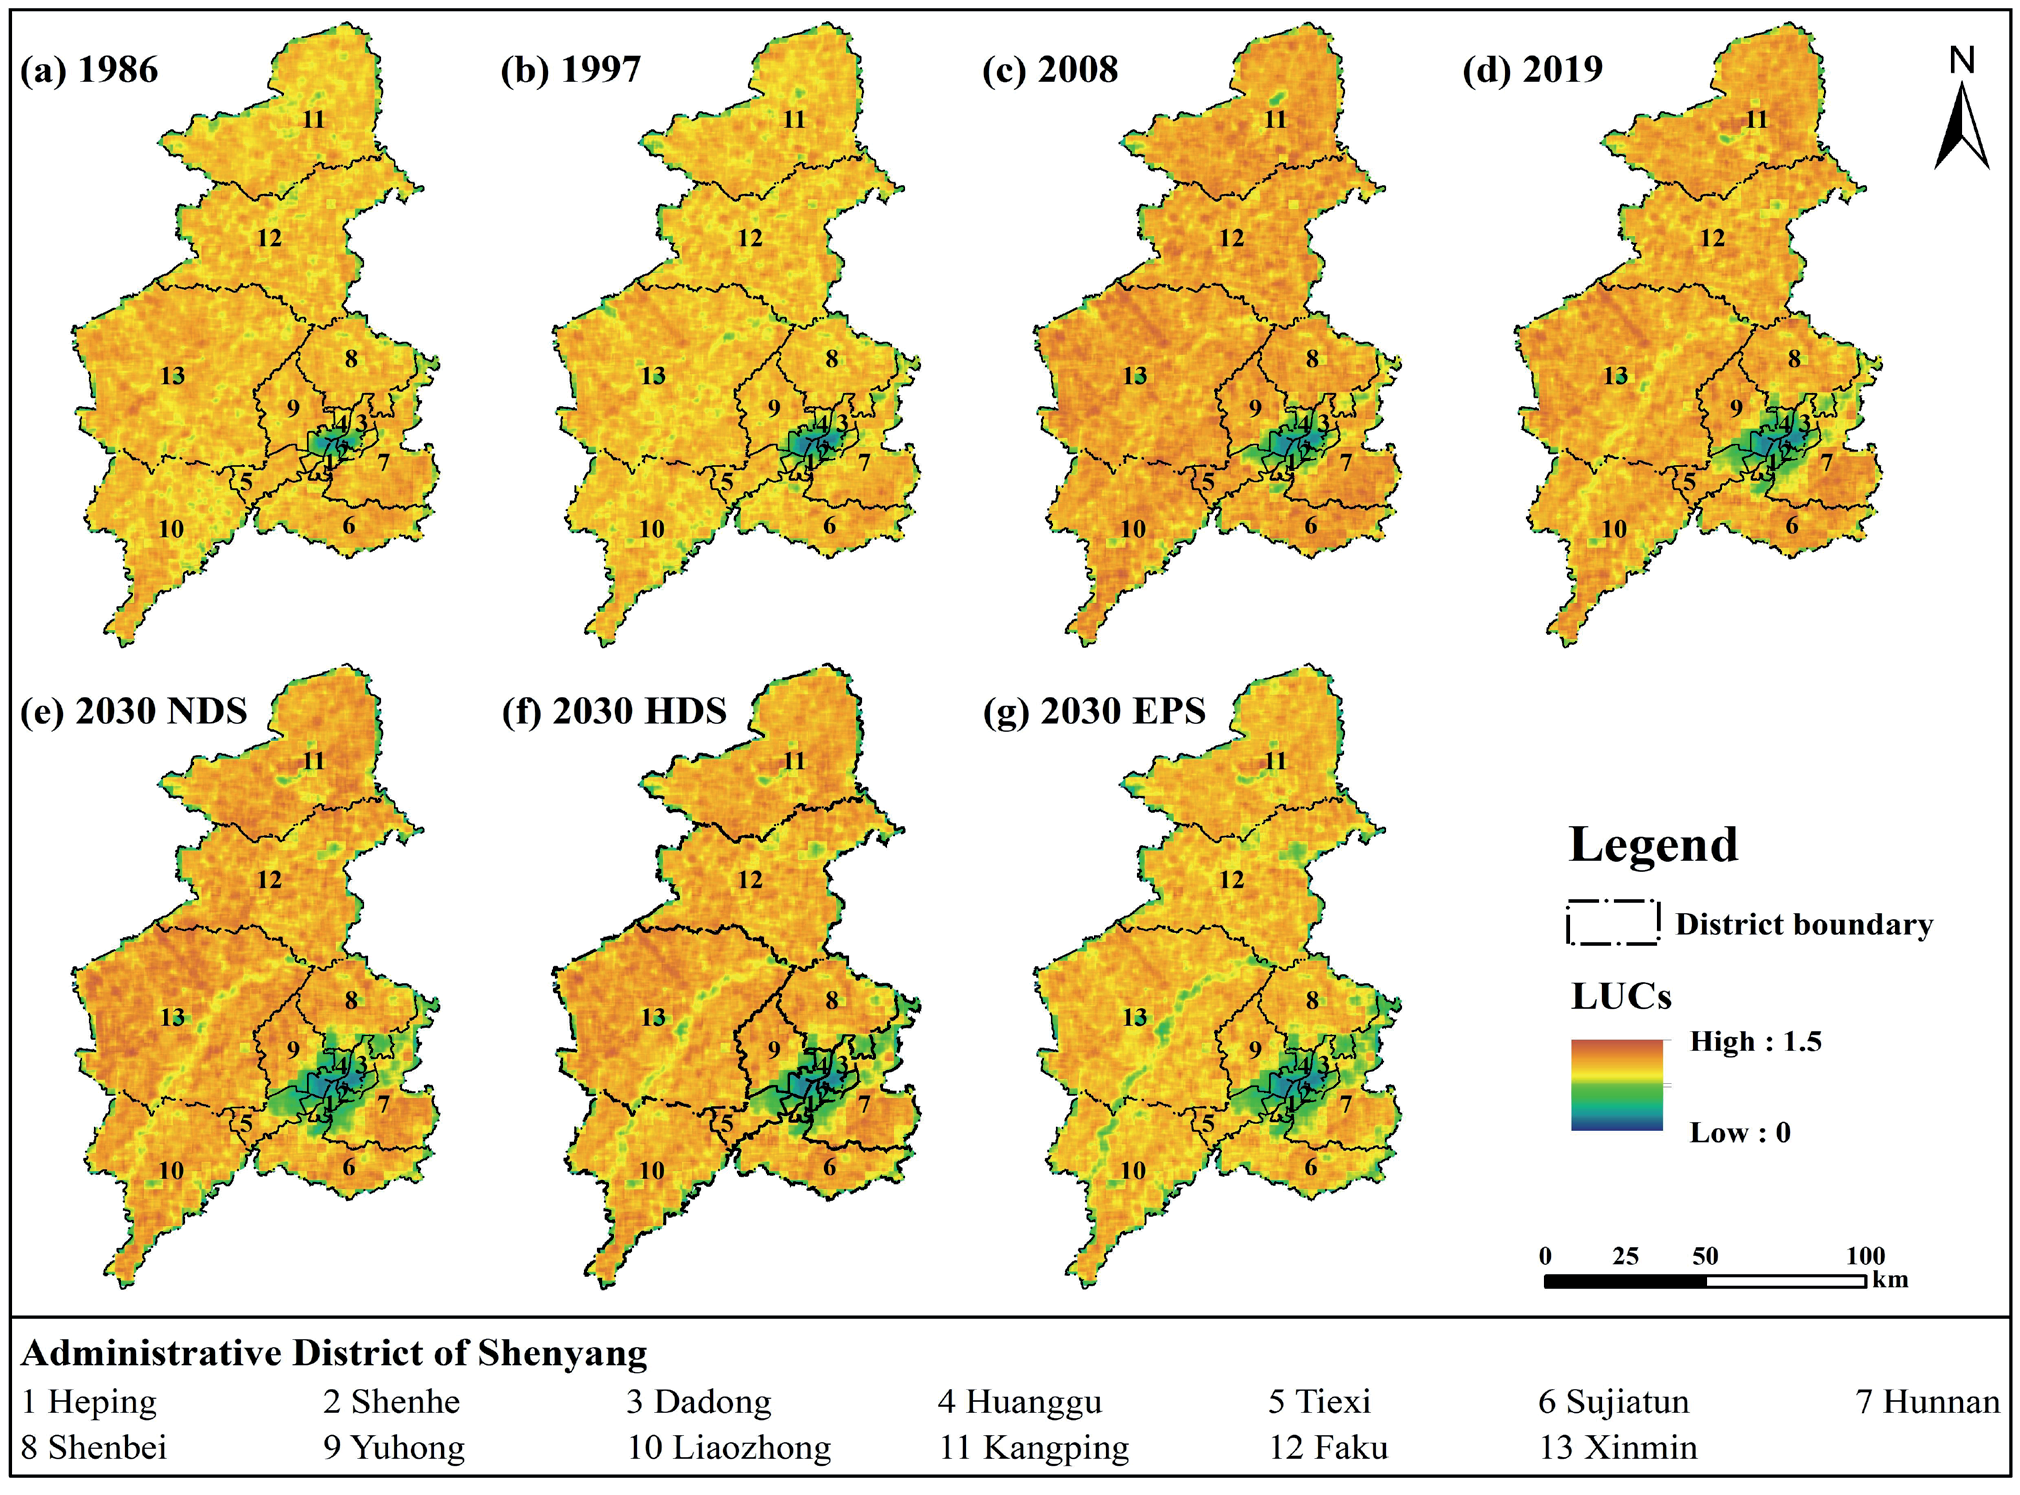
Spatially, land use conflicts under all three scenarios are mitigated to varying degrees across the region in 2030. In the five core urban areas, the mitigation effect from strong to weak is NDS>EPS>HDS. In the four suburban areas, the mitigation effect from strong to weak is EPS>NDS>HDS. In the four exurban areas, the mitigation effect from strong to weak is EPS>HDS>NDS. It is worth noting that the connectivity and stability of landscape patches increase to varying degrees in all three scenarios. This is evidenced by a reduction in the intensity of land use conflicts near rivers and watersheds as well as in the eastern woodlands.
Impact of Policy Interventions on the Results of Land Use Conflicts Simulation
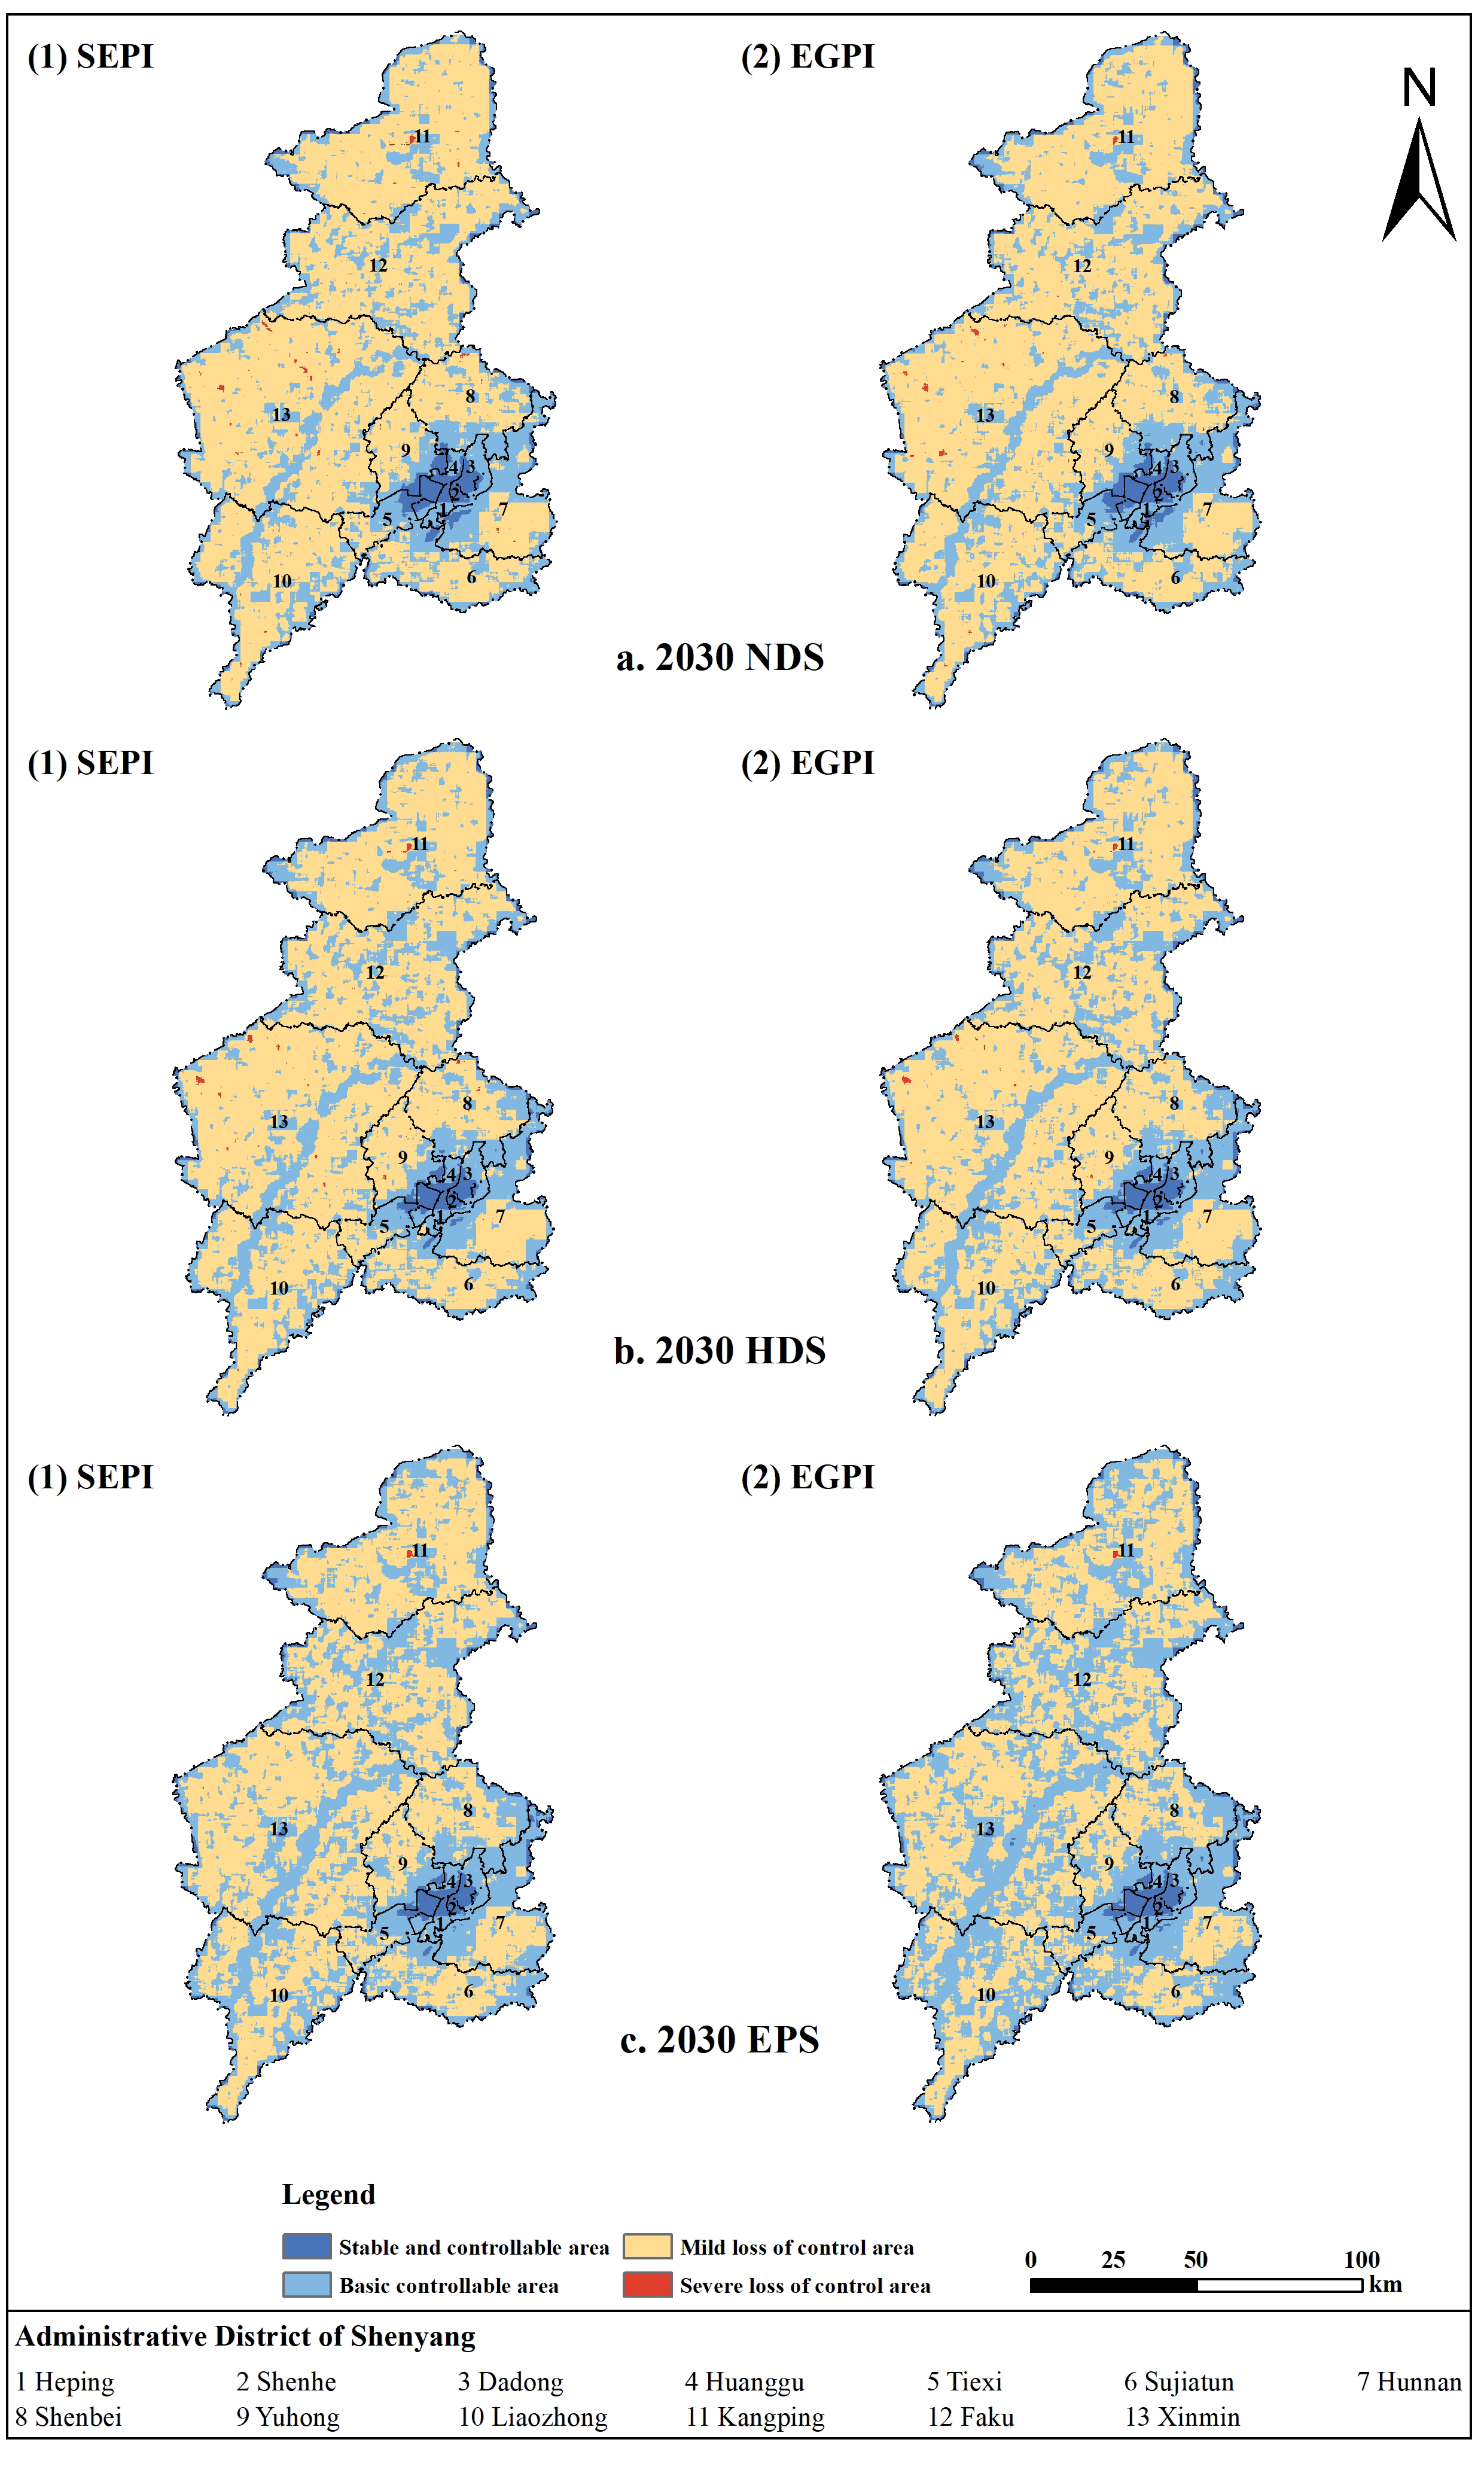
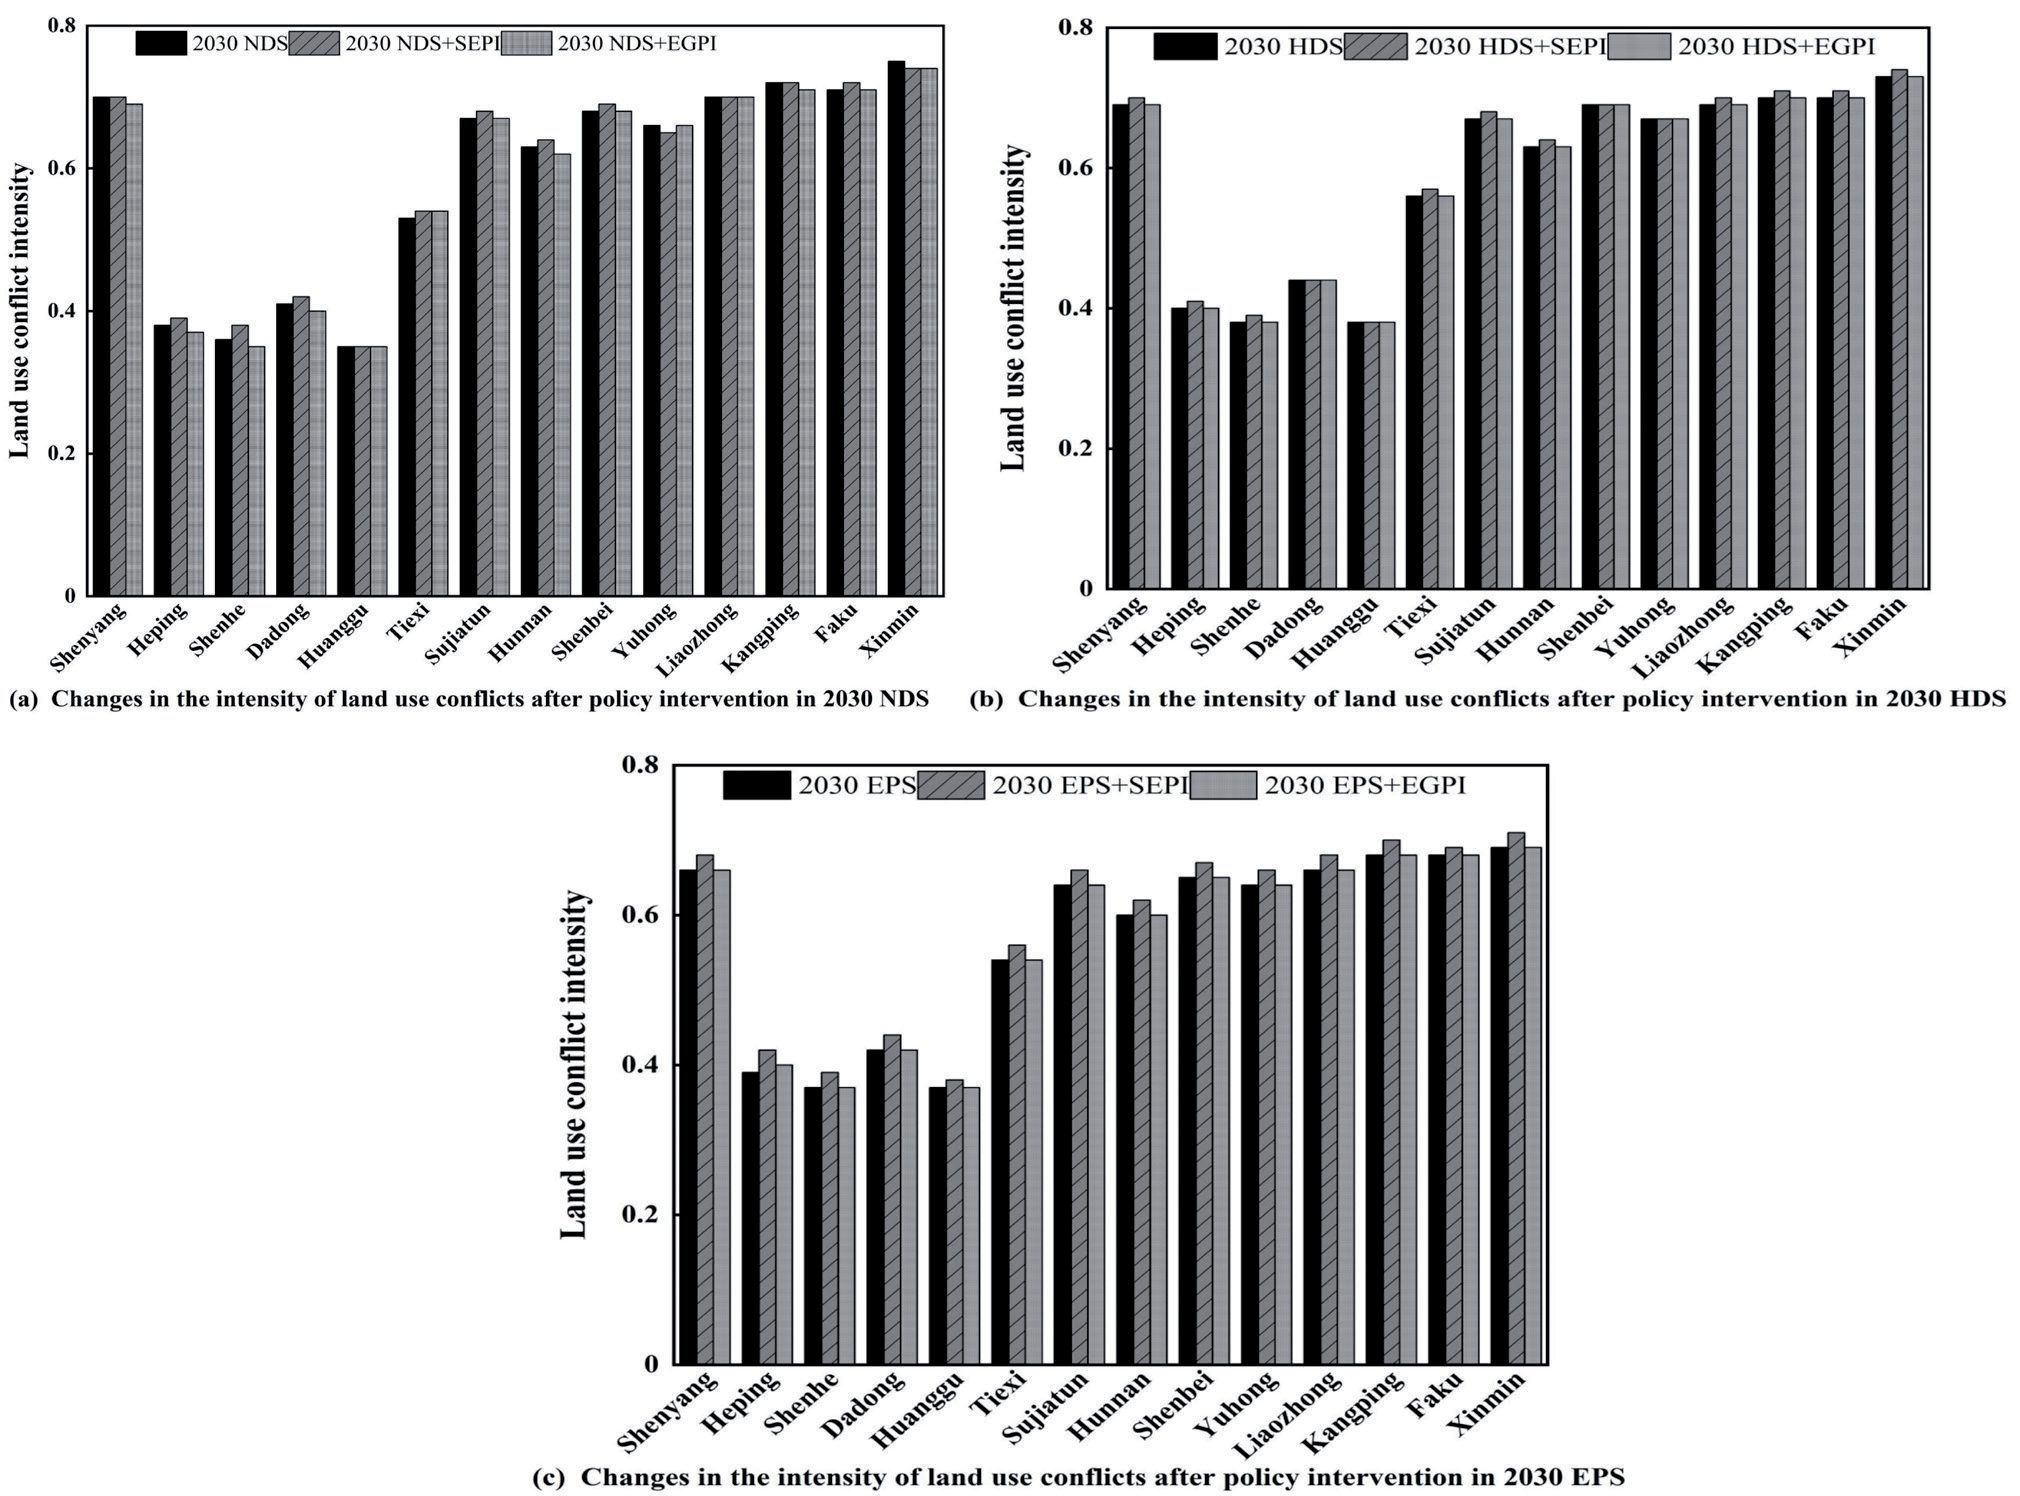
Under the NDS, which intervened with the SEPI, the land use conflict intensity of Shenyang is 0.70 (Fig. 8(a) and Fig. 9(a)). It is consistent with what was before the interventions. The stable and controllable area is concentrated in the core urban areas, with a slight expansion in scope. The basic controllable and mild loss of control areas have little change. The severe loss of control area is primarily localized in the western area of Xinmin and the center portion of Faku, with a total area reduction. After intervening with the EGPI, the land use conflict intensity of Shenyang is 0.69, which is slightly lower than before the interventions. The stable, controllable, and severe loss of control areas has little change. The basic controllable area has slightly increased, mainly due to the rise and aggregation of ecological land area, which has improved system stability. Furthermore, the severe loss of control area has significantly decreased.
Under the HDS, which intervened with the SEPI, the land use conflict intensity of Shenyang is 0.70 (Fig. 8(b) and Fig. 9(b)). It is slightly higher than before the interventions. The stable and controllable area is concentrated in the core urban area, with a western expansion trend. This indicates that the economic development of Tiexi is accelerating, and the core construction land area is increasing. The basic controllable area decreases, and there is a significant reduction in the basic controllable area of the water body. In addition, the mild loss of control area becomes stable, and the severe loss of control areas increases. Severe loss of control areas exist in Xinmin, the central part of Faku, Yuhong, and Shenbei. After intervening with the EGPI, the land use conflict intensity of Shenyang is 0.69, which is consistent with before the interventions. The area of each region is stable, but regional aggregation improves, and the degree of patch fragmentation decreases.
Under the EPS, which intervened with the SEPI, the land use conflict intensity of Shenyang is 0.68 (Fig. 8(c) and Fig. 9(c)). It is higher than it was before the interventions. The region characterized by stability and controllability is predominantly concentrated inside the core urban area. The basic controllable area shows a significant decrease, while the mild loss of control area increases. The severe loss of control area is concentrated in the central part of Faku. After intervening with the EGPI, the land use conflict intensity of Shenyang is 0.66, which is consistent with the results before the interventions. The implementation of policy intervention significantly improves regional connectivity and has high ecological system stability.
Discussion
What are the Possible Reasons for Land Use Conflicts Change in Shenyang During the Historical Phase?
Our research results showed that the concentration of places with low conflict intensity is observed in central metropolitan areas characterized by heightened human activity and urbanization. The construction land in the core urban area is relatively stable and difficult to convert into other land types, making the core urban area a low-intensity land use conflict area. The high-conflict areas in each city are distributed around each town, which is related mainly to the fact that each county is eager to promote urbanization and has a strong demand for land use. This suggests that there is a strong relationship between land use conflicts and land use change. The more frequent the land use change, the more intense the land use conflicts. The related research also confirms this result [40, 41].
In 1986, Shenyang was in the industrial transformation and development stage [42]. Based on the principle of "business in, workers out," the core urban area focuses on improving intensive land use and building and transforming the original urban regions. The suburban areas actively develop forestry, animal husbandry, sideline fishery, industry, and tertiary industries. There was a strong demand for land resources and a relatively high intensity of land use development. In 1997, Shenyang experienced a significant urbanization process characterized by the proactive expansion of built-up regions in multiple districts and counties. The original agricultural land was quickly transformed into other land types, leading to drastic changes in land use types and patterns, and intense conflict over land use. In 2008, the Shenyang government formulated various planning documents, such as overall land use plans and urban-rural plans. They focused on developing the outskirts of Hunnan, Shenbei, and Sujiatun, and designated new development areas to leverage the value-added effect of locational environment optimization and attract investment. The exurban areas of Kangping, Faku, Xinmin, and Liaozhong accelerated their economic development during this period. The rural population residing in these areas started to migrate towards the county and district levels, with each county and district becoming a new round of high-value areas of land use conflicts [43]. In 2019, Shenyang proactively augmented its water body area and enhanced the preservation of river and lake waters. The land use conflicts intensity on both sides of the river showed significant differentiation. The marked increase in landscape connectivity of the watershed is a direct cause of the reduction in land use conflicts on both sides of the river. There was a slowing down trend of land use conflicts in Shenyang at this stage, which had an important relationship with the local government's promotion of intensive development and the slowing down of urbanization.
Based on the research results and the above analysis, we guess that socio-economic factors may be key in driving regional land use conflicts. It has been shown that land use conflicts are closely related to population density and economic conditions [8]. Population is the main driver of land development and urban expansion due to the need for adequate production and living space. The continuous rise in population density encroaches on the natural habitats of flora and fauna, causing serious ecological spatial disturbances [44, 45]. Moreover, intense human activities could lead to a highly fragmented and less stable landscape. At the same time, the increasing level of urbanization and the rapid development of the regional economy have led to a sustained increase of investment in construction land and the continued development of the housing industry. It exacerbates the expansion of urban space, the non-agricultural process of cultivated land, and the reshaping of the regional land use pattern, which has inevitably led to land use conflicts [46]. Therefore, based on the research results and collected data, we have selected five socio-economic indicators, namely: urbanization level, population density, economic density, growth rate of the secondary industry, and growth rate of the tertiary industry. We used the GTWR model to reveal the core driving factor (Table 3).
Table 3.
Importance of each driving factor for different periods from 1986 to 2019.
The results showed that population density was the primary factor driving land use conflicts in Shenyang from 1986 to 1997, accounting for 37.67% of the total importance, and its driving role weakened significantly in the later stages. From 1997 to 2019, land use conflicts were mainly caused by the urbanization level, accounting for 52.86%, and 54.64% of the total importance. In Shenyang, the urbanization rate plays a significant role in land use conflicts, contributing more than 30% of the total importance in all stages. Suburban regions were significantly affected by this factor. The effect of economic density on land use conflicts was not significant. The rate of industrial development, especially the importance of the tertiary sector in the evolution of land use conflicts, has gradually increased.
What Kind of Development Model Should be Adopted by Shenyang in the Future to Effectively Mitigate Land Use Conflicts?
Our research showed that the continued adoption of the EGPI in the EPS can effectively alleviate land use conflicts (Fig. 8 and Fig. 9). However, overprotection of the ecological environment may be detrimental to regional socio-economic development and agricultural production [47]. Therefore, the sustainability of regional development must be considered to achieve a dynamic balance between economic development, ecological protection, and food security.
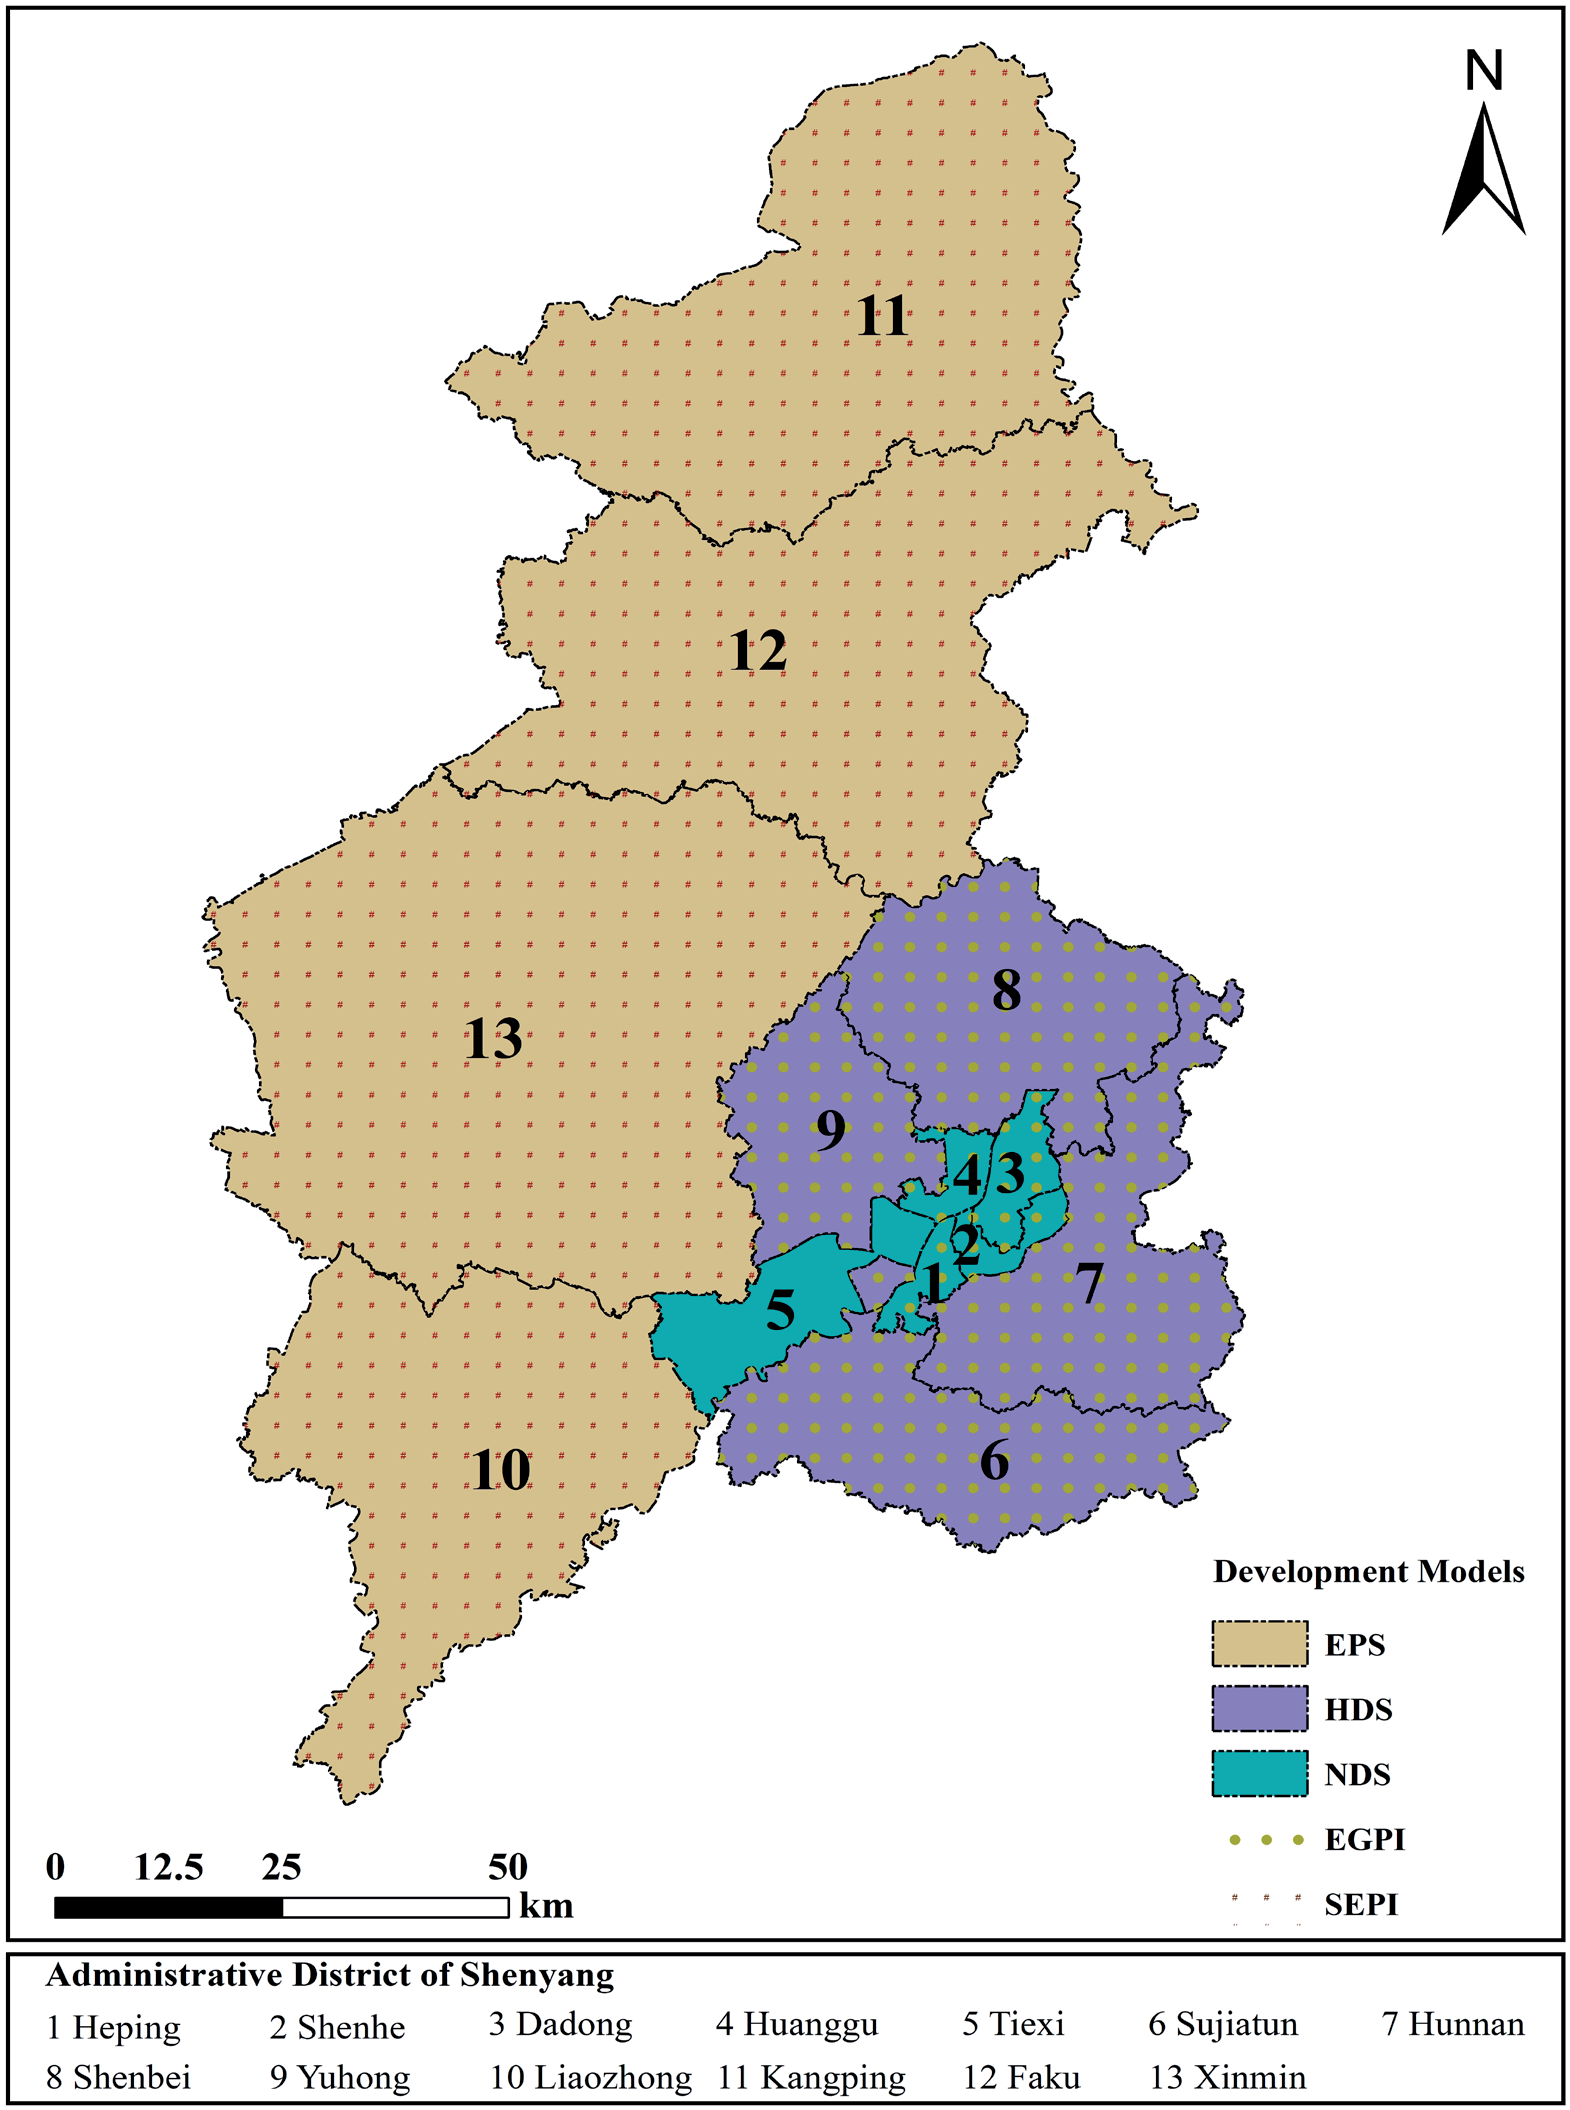
Combining the development plan and the current situation of Shenyang, a range of land use conflict mitigation measures for different administrative regions was set in our research. It seeks the optimal combination scenario to mitigate land use conflicts within this range to fulfill urban growth requirements. Heping, Shenhe, and Huanggu are the core urban areas with a relatively small geographical area and no food production tasks. The construction land is the primary land type, and their land use conflict intensity should be controlled within 0.35 as much as possible to meet the stability and control requirements. The use of the EGPI under the NDS has a significant effect on mitigating land use conflicts in Heping, Shenhe, and Huanggu. Tiexi and Dadong are the core urban areas of Shenyang, with construction land as their primary land use. However, the region still bears a small amount of grain production tasks. The intensity of land use conflicts in Dadong is controlled within 0.40. The cultivated land area in Tiexi is relatively large, and it is reasonable to control the intensity of land use conflicts within 0.55. Adopting the EGPI under the NDS significantly alleviates land use conflicts in Dadong. Tiexi should continue to adopt a natural development trend and prioritize economic development. Sujiatun, Hunnan, Shenbei, and Yuhong are located on the outskirts of Shenyang. They have large areas of cultivated land. The eastern part of Sujiatun, Hunnan, and Shenbei is the remnant of the Changbai Mountains. The tributary of the Hun River flows through the territory of Yuhong. While undertaking economic development and agricultural production, they all have a specific ecological protection task. Therefore, controlling the intensity of land use conflicts at around 0.65 is reasonable. It can be seen that adopting the EGPI in the HDS can increase the concentration and connectivity of forest land, effectively integrate regional development space, increase the agglomeration effect of core urban areas, and significantly promote regional development while mitigating land use conflicts. Liaozhong, Kangping, Faku, and Xinmin undertake the main task of grain production. The area of cultivated land accounts for about 80% of the total cultivated land of Shenyang. The northern part of Kangping is the "Three North Shelterbelt," and the eastern part of Faku is the intersection of the Changbai Mountain Range and the remaining parts of the Yanshan Mountain Range. Many rivers, such as the Liaohe River, pass through Liaozhong and Xinmin. Ecological governance is also an essential task for the region, so it is reasonable to control the intensity of land use conflicts at around 0.70. Adopting the SEPI in the EPS can significantly reduce the area of severe loss of control regions, effectively protecting ecological land and reserve development space while safeguarding food security. The final results of the future sustainable development model for each area of Shenyang City are presented in Fig. 10.
Suggestions for Promoting the Realization of Sustainable Development in Shenyang
Due to the limited availability of land resources and the insatiable demands of the human population, land use conflicts are inevitable. Land use conflicts are the process of competition for land resources and spatial redistribution. Mitigating land use conflicts does not mean promoting a single land use type, but rather alleviating disorder and fragmentation in land use and promoting the effective allocation of land resources. However, economic and social development is inevitably accompanied by the expansion of built-up land and the reduction of other land use types. Therefore, mitigating explicit conflicts at the quantitative and structural levels by addressing implicit conflicts related to planning and decision-making is an effective way of governing land use conflicts.
Firstly, it is necessary to optimize the factor guarantee and plan the land quota reasonably. Territorial space planning plays a central role in territorial space governance. Reasonable and scientific planning decisions are significant in building a sustainable territorial space development pattern and alleviating the contradiction between people and land. However, there are still problems, such as extensive land use and disorderly development of land space in Shenyang [48]. The reasons are related to the conflicts caused by overlapping urban construction plans in the early stages. Therefore, Shenyang should fully consider the regional function. It is imperative to strategically establish land indicators by demarcating the urban development boundary [49], there are permanent essential cultivated land preservation red lines and ecological protection red lines. It is necessary to clarify the "white space land," guide new construction to be concentrated within the urban development boundary, gradually transform from extensive management to refined governance, and increase the urban agglomeration effect to alleviate land use conflicts.
Secondly, accelerate the construction of high-standard cultivated land and realize scale operation. High-standard cultivated land construction is a vital policy practice in "storing grain in the soil" of China and a meaningful way to overcome the inefficient use of cultivated land and enhance productivity. The terrain of Shenyang is mainly plain, with superior crop planting conditions and a large cultivated land area. This shows significant advantages in developing agricultural-scale operations. The potential economic and ecological value output of cultivated land resources is enormous and constitutes a core area for land use conflicts. Therefore, reducing cultivated land fragmentation, and achieving large-scale cultivated land management is crucial in mitigating land use conflicts.
Finally, we need to improve the system for controlling the use of territorial space. Controlling land space use can reduce negative externalities, coordinate development and protection conflict, and promote orderly and sustainable space development. It is essential in mitigating land use conflicts it has not risen to the legal level. Therefore, it is necessary to apply legal means to impose rigid constraints.
Contributions and Limitations
Land use conflicts arise from the process of land use change. Serious land use conflicts can lead to an imbalance in the spatial pattern of land use, reduce the stability of the land system, and negatively impact society, economy, and ecology [50]. Therefore, it is significant to carry out simulation studies of land use conflict patterns under multi-objective scenarios and identify effective mitigation patterns to promote sustainable regional development and build a healthy and stable land use spatial pattern.
In previous studies, scholars have focused more on identifying, screening driving factors, and modeling future development trends of land use conflicts. However, research on identifying land use conflict mitigation and judging their mitigation effects still needs to be further explored. The core area of land use conflicts research is governance and regulation, and research that mitigates regional land use conflicts only by proposing countermeasures is too abstract to reflect mitigation effects spatially. Compared to previous studies, our study can be considered the first attempt to identify land use conflict mitigation patterns and mitigation effects spatially. The study results have significant reference value for improving the science and effectiveness of regional land use planning and management.
Firstly, this study fully accounts for geographical realities when modeling the future land use pattern under multi-objective scenarios. We set food security as one of the constraints when setting objectives, which can ensure that the study area can meet the task of food production under different development scenarios. The study can provide a reference for other similar regions.
In addition, this study thoroughly considered the relevant policies already introduced by the Chinese government. The mitigation effects of different development scenarios and combinations of policy tools on land use conflicts were analyzed. Then, land use conflict mitigation models suitable for different regions were identified based on regional development needs and resource endowments. It provides a methodological reference for conducting land use conflict mitigation research, as well as a scientific basis for the governance and regulation of regional land use conflicts.
Although the land use conflicts mitigation model proposed in this study can provide some insights into the sustainable development of the region, it still has certain limitations. Land use conflicts are a geographical phenomenon based on social behavior and involve conflicting and opposing land values between stakeholders due to social choices. Research conducted from a geographical perspective may not adequately take into account the subjective perceptions of the subjects involved in the conflicts. In future research, we will identify the multiple interest subjects that lead to land use conflicts from a sociological perspective and explore a more scientific path of land use conflict governance through field research.
Conclusions
Drawing on the ecological risk assessment framework, this study measured the intensity of land use conflicts in Shenyang City from 1986 to 2019 in terms of three landscape dimensions: complexity, vulnerability, and stability. Different from previous studies, we applied the GMOP-PLUS model to obtain the spatial distribution pattern of land use conflicts under the three scenarios based on ensuring food demand in 2030. In addition, we combine qualitative and quantitative methods to analyze the effects of different policy interventions on future land use conflicts. The data support the following conclusions. (a) There is a close relationship between land use conflicts and land use changes. The intensity of land use conflicts is higher in areas with more frequent land use changes. (b) Compared to 2019, land use conflicts in Shenyang are mitigated under three scenarios in 2030. The effects of the SEPI and the EGPI on alleviating land use conflicts were significantly different. (c) In the future, Shenyang should focus on regional functions, reduce land use conflicts, and promote regional sustainable development by formulating reasonable land planning, accelerating the construction of high-standard farmland, and improving the system of land use control.

