Introduction
Biomaterials are synthetic substances that are inserted into the human body to function and support the organ for as long as possible. Synthetic materials used in artificial implants have a significant interaction with the bones and tissues of the human body. They can be plates, stents, joints (hip and knee), screws, rods, and scaffolds. The essential need for a biomaterial is that it serves the living body for as long as feasible with minimal implant failure, especially under cyclic loading conditions. Metals such as cobalt-chromium, stainless steel, titanium, and their alloys are widely utilized as biomaterials to overcome such environments and provide sufficient mechanical strength as well as corrosion resistance [1, 2]. Among the several types of stainless steel, duplex, and 316 L stainless steel are primarily used in the production of implants and artificial devices [3–5]. Numerous researchers have reported using duplex stainless steel for orthopedic and orthodontic applications [6, 7]. Its consumption is lower than that of 316 L stainless steel, nevertheless. Duplex stainless steel requires more research in terms of functionality and biocompatibility within the context of the human body. Because it contains chromium and molybdenum, duplex stainless steel has excellent corrosion resistance [8].
However, these biomaterials’ surfaces need to be improved for greater performance, including proper cell attachment and development [9]. One of the most widely utilized non-conventional material removal processes is electrical discharge machining (EDM). EDM is a popular technique nowadays for concurrently cutting the material with high precision and modifying the substrate surface [10–12]. In this process, the workpiece and electrode react to generate intermetallic compounds in the presence of the dielectric medium, which changes the material properties of the workpiece [13–15]. Using powder-mixed electrical discharge machining (PMEDM), Jeswani expanded the potential of the traditional EDM procedure. The material removal rate (MRR) was raised by approximately 60% and the tool wear rate (TWR) was decreased by approximately 15% when kerosene oil combined with 4 g/l micro graphite powder was used as the dielectric fluid in PMEDM [16].
The investigation employed Al2O3 particles with sizes of 45 and 50 μm and concentrations of 2.5 and 2.8 g/Lit. They concluded that the surface roughness was mostly affected by the discharge current and the low-level pulse on time. Additionally, the process became unstable due to an increase in the gap voltage [17]. Al2O3 and SiC mixed powder in deionized water as a dielectric fluid was used in Joshi and Joshi’s investigation into EDM of Ti-6Al- 4V. The findings demonstrated that MRR, TWR, and SR are significantly influenced by current and pulse timing. Additionally, the SR was enhanced by changing the pulse-off time and powder concentration [18]. Compared to kerosene, deionized water enhances the machining environment. Additionally, no environmental harm is seen, and no carbon deposition forms on the machined surface. [19, 20]. EDM enhances the substrate material’s biocompatibility, corrosion resistance, and tribological qualities. Less research has been done on the biological effects and compatibility of the DSS- 2205 alloy with red blood cells from humans. Nevertheless, certain published research found that the EDMed DSS- 2205 alloy showed improved bioactivity and corrosion resistance characteristics in contrast to the unprocessed substrate [21, 22].
A survey of the literature reveals that the output parameters of EDM machining are greatly impacted by the physical and chemical characteristics of particles [23]. A common technique to enhance the machining condition is to combine powder particles with the dielectric liquid of deionized water [24]. In recent years, researchers have discovered that silicon oxides and particles can boost the effectiveness of electrical discharge machining [25]. The high surface area and porosity of silicon oxides enable absorption of Volatile Organic Compounds (VOCs). The low specific gravity of silicon oxide particles, which enhances the powder suspension and homogeneity, is a key consideration when adding silicon oxide particles [26].
In the current study, deionized water is used to study SiO2 powder-mixed EDM for duplex stainless steel. The influence of the discharge current, voltage, pulse on time, pulse off time, and relative composition of SiO2 nanoparticles on MRR, SR, and TWR is investigated using response surface methodology (RSM). A dielectric circulation system is made to prevent deionized water from being wasted. Deposition of nanoparticles is prevented by the circulation system. To avoid adhesion and particle deposition, an ultrasonic device is used to homogenize the nanoparticles that are added to deionized water. The morphology of the machined surfaces was investigated using field emission scanning electron microscopy, and the treated samples’ composition was investigated using energy-dispersive X-ray spectroscopy and X-ray diffraction studies. Additionally, the corrosion rate of treated duplex stainless-steel samples was compared to the corresponding untreated substrates using an in-vitro electrochemical corrosion test with Ringer’s solution as the electrolyte.
Resources and Techniques
Tool, EDM Machine, Workpiece, and Nanopowder (Catalysis) Composition
The workpiece utilized in this investigation is a sheet of duplex stainless steel (DSS-2205). The water jet machine cuts the specimens to their specified size (60 × 40 × 20 mm). Due to its great bioactive qualities and excellent performance, this material is widely used in orthopedic and dental implants. Table 1 lists the characteristics and specifications of the workpiece materials. Polishing processes are used in the machining of tungsten tools that have a 10 mm diameter and a 70 mm height. Table 2 lists the characteristics and specifications of the tool. Levels of 20 nm-sized SiO2 nanoparticles with a deionized water dielectric were used in this investigation. Fig. 1 shows a scheme for SiO2 nanoparticle mixed EDM for drilling DSS (2205). The weight loss method is used to determine both the MRR and TWR. The SR of the machined components is determined by the Mahr Marsuf PS1 roughness tester, which measures the average of three measurements made in various directions from the milling surface. Additionally, SiO2 nanopowder is chosen for use in the studies as the foundation for figuring out the composition percentage of the particles.
Design of Experiments
The study’s input parameters were the amount of electric discharge current, voltage, spark on and off times, and the concentration of nanoparticles. Using the Design-Expert software 13 and the RSM, machining tests are carried out. There are three stages of testing for each parameter. Screening experiments are used to choose the parameter’s lower and upper limits. Table 3 contains a list of the process parameter levels, and the Box-Behnken matrix was used to calculate the DOE. The responses, including Tool Wear Rate (TWR), Material Removal Rate (MRR), and Surface Roughness (SR), at each experimental run are reported in Table 4 (According to DOE). A polynomial function was used in multiple regression analysis for the modeling and statistical analysis of the responses. Furthermore, the P value > 0.05 value, which guarantees model stability with a 95% confidence level, is used to statistically validate quadratic models [27–30].
Table 1.
Materials for the workpiece and their characteristics.
Results and Discussion
Influence of Factors on MRR
RSM was employed in this investigation to ascertain the connection between the particles and the machining process outputs. Numerous ions and electrons are produced by nanoparticles suspended in the dielectric as a result of energy absorption, moving in the direction of the electrodes (the tool and the workpiece) [31]. Deionized water has a dielectric breakdown strength of 1.87 times higher than kerosene. As a result, compared to kerosene, deionized water has a longer spark delay time. Longer machining times and erratic electrical discharge are the results of this phenomenon [32]. The breakdown strength of deionized water can be decreased, and the rate of material removal can be accelerated by using nanoparticles in the dielectric. Table 4 displays the outcomes of electrical discharge machining tests conducted in the presence of nanoparticles. The Voltage (V), pulse-off time (Toff), pulse-on time (Ton), discharge current (I), and nanopowder mix (SiO2) are denoted with the codes A, B, C, D, and E in Table 4, respectively.
Table 5 displays the details of the analysis of variance (ANOVA) for the MRR response with powder mixed in the dielectric. Given that the P-value in the table is less than 0.05, it may be inferred that there is statistical significance in the quadratic model. The quadratic model is taken into consideration in this instance with a 95% confidence range. Furthermore, if the P-value exceeds 0.05, which is the desired value, the lack-of-fit term becomes unimportant. The regression model is made simpler by removing components that are not significant. Equation (1) displays the final adjusted model for MRR following the removal of the inconsequential elements in terms of coded factors.
(1)
A perturbation plot illustrating the impact of several machining parameters at a specific location in the design space is displayed in Fig. 2(a). It may help identify the variables that have the biggest impact on raising the rate of material removal. For instance, it is evident that the MRR reaction is most affected by the discharge current (B). With an increase in discharge current, the MRR rises. Additionally, the outcome shows that the reaction is influenced in an increasing linear fashion by the pulse on time (C). The nanoparticles’ (E) composition has a non-linear impact on MRR.
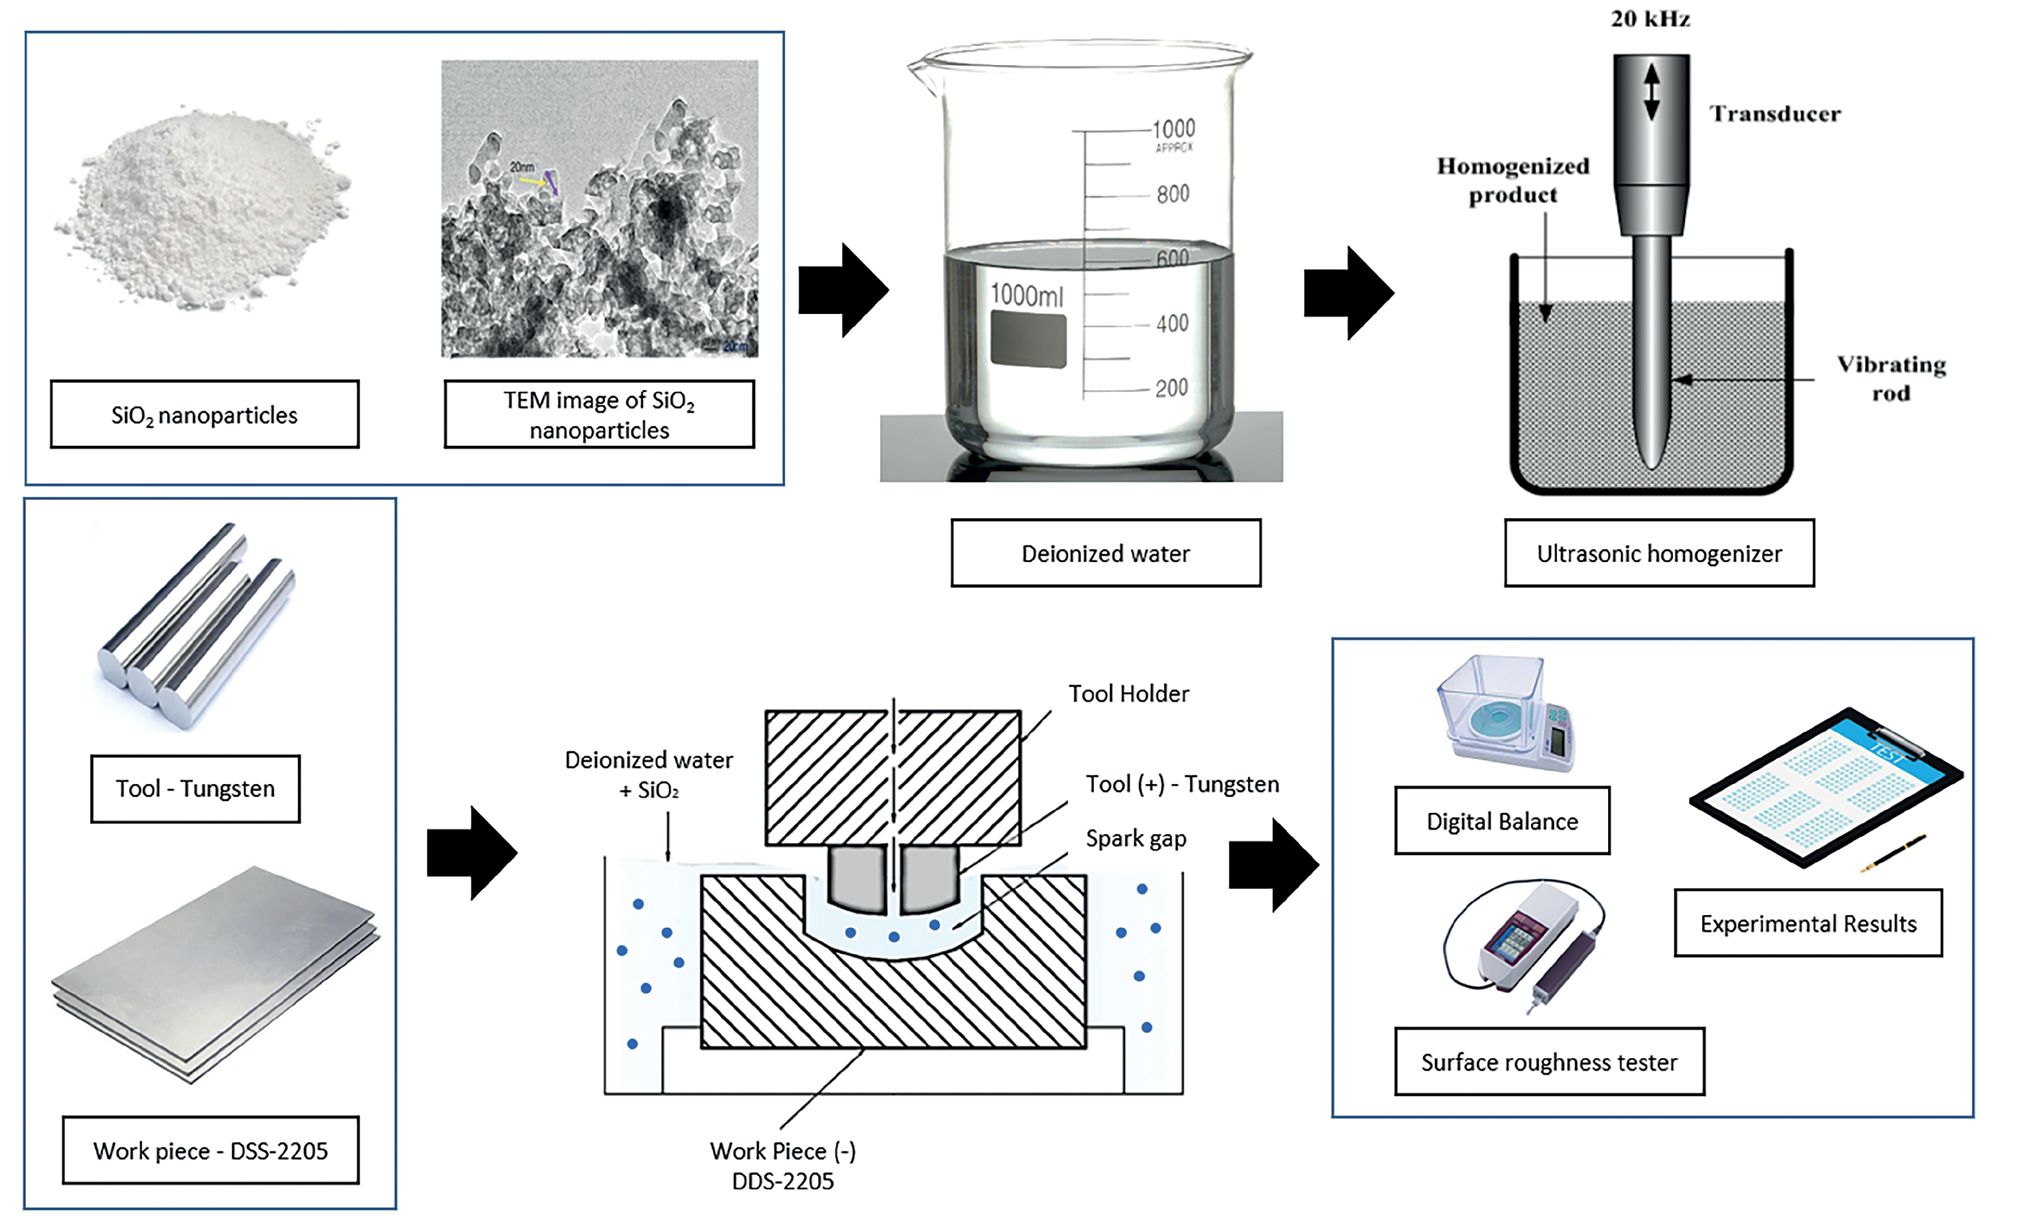
Table 3.
levels of process parameters for the Box-Behnken matrix.
| Factors | Symbols | Levels | ||
|---|---|---|---|---|
| -1.00 | 0 | +1.00 | ||
| Voltage, V (Volt) | A | 40 | 50 | 60 |
| Current, I (Amp) | B | 6 | 10 | 14 |
| Spark ON Time, Ton (μs) | C | 40 | 60 | 80 |
| Spark OFF Time, Toff (μs) | D | 50 | 70 | 90 |
| SiO2 levels (g/l) | E | 0 | 2 | 4 |
Table 4.
Experimental Box-Behnken Design for EDM output parameters
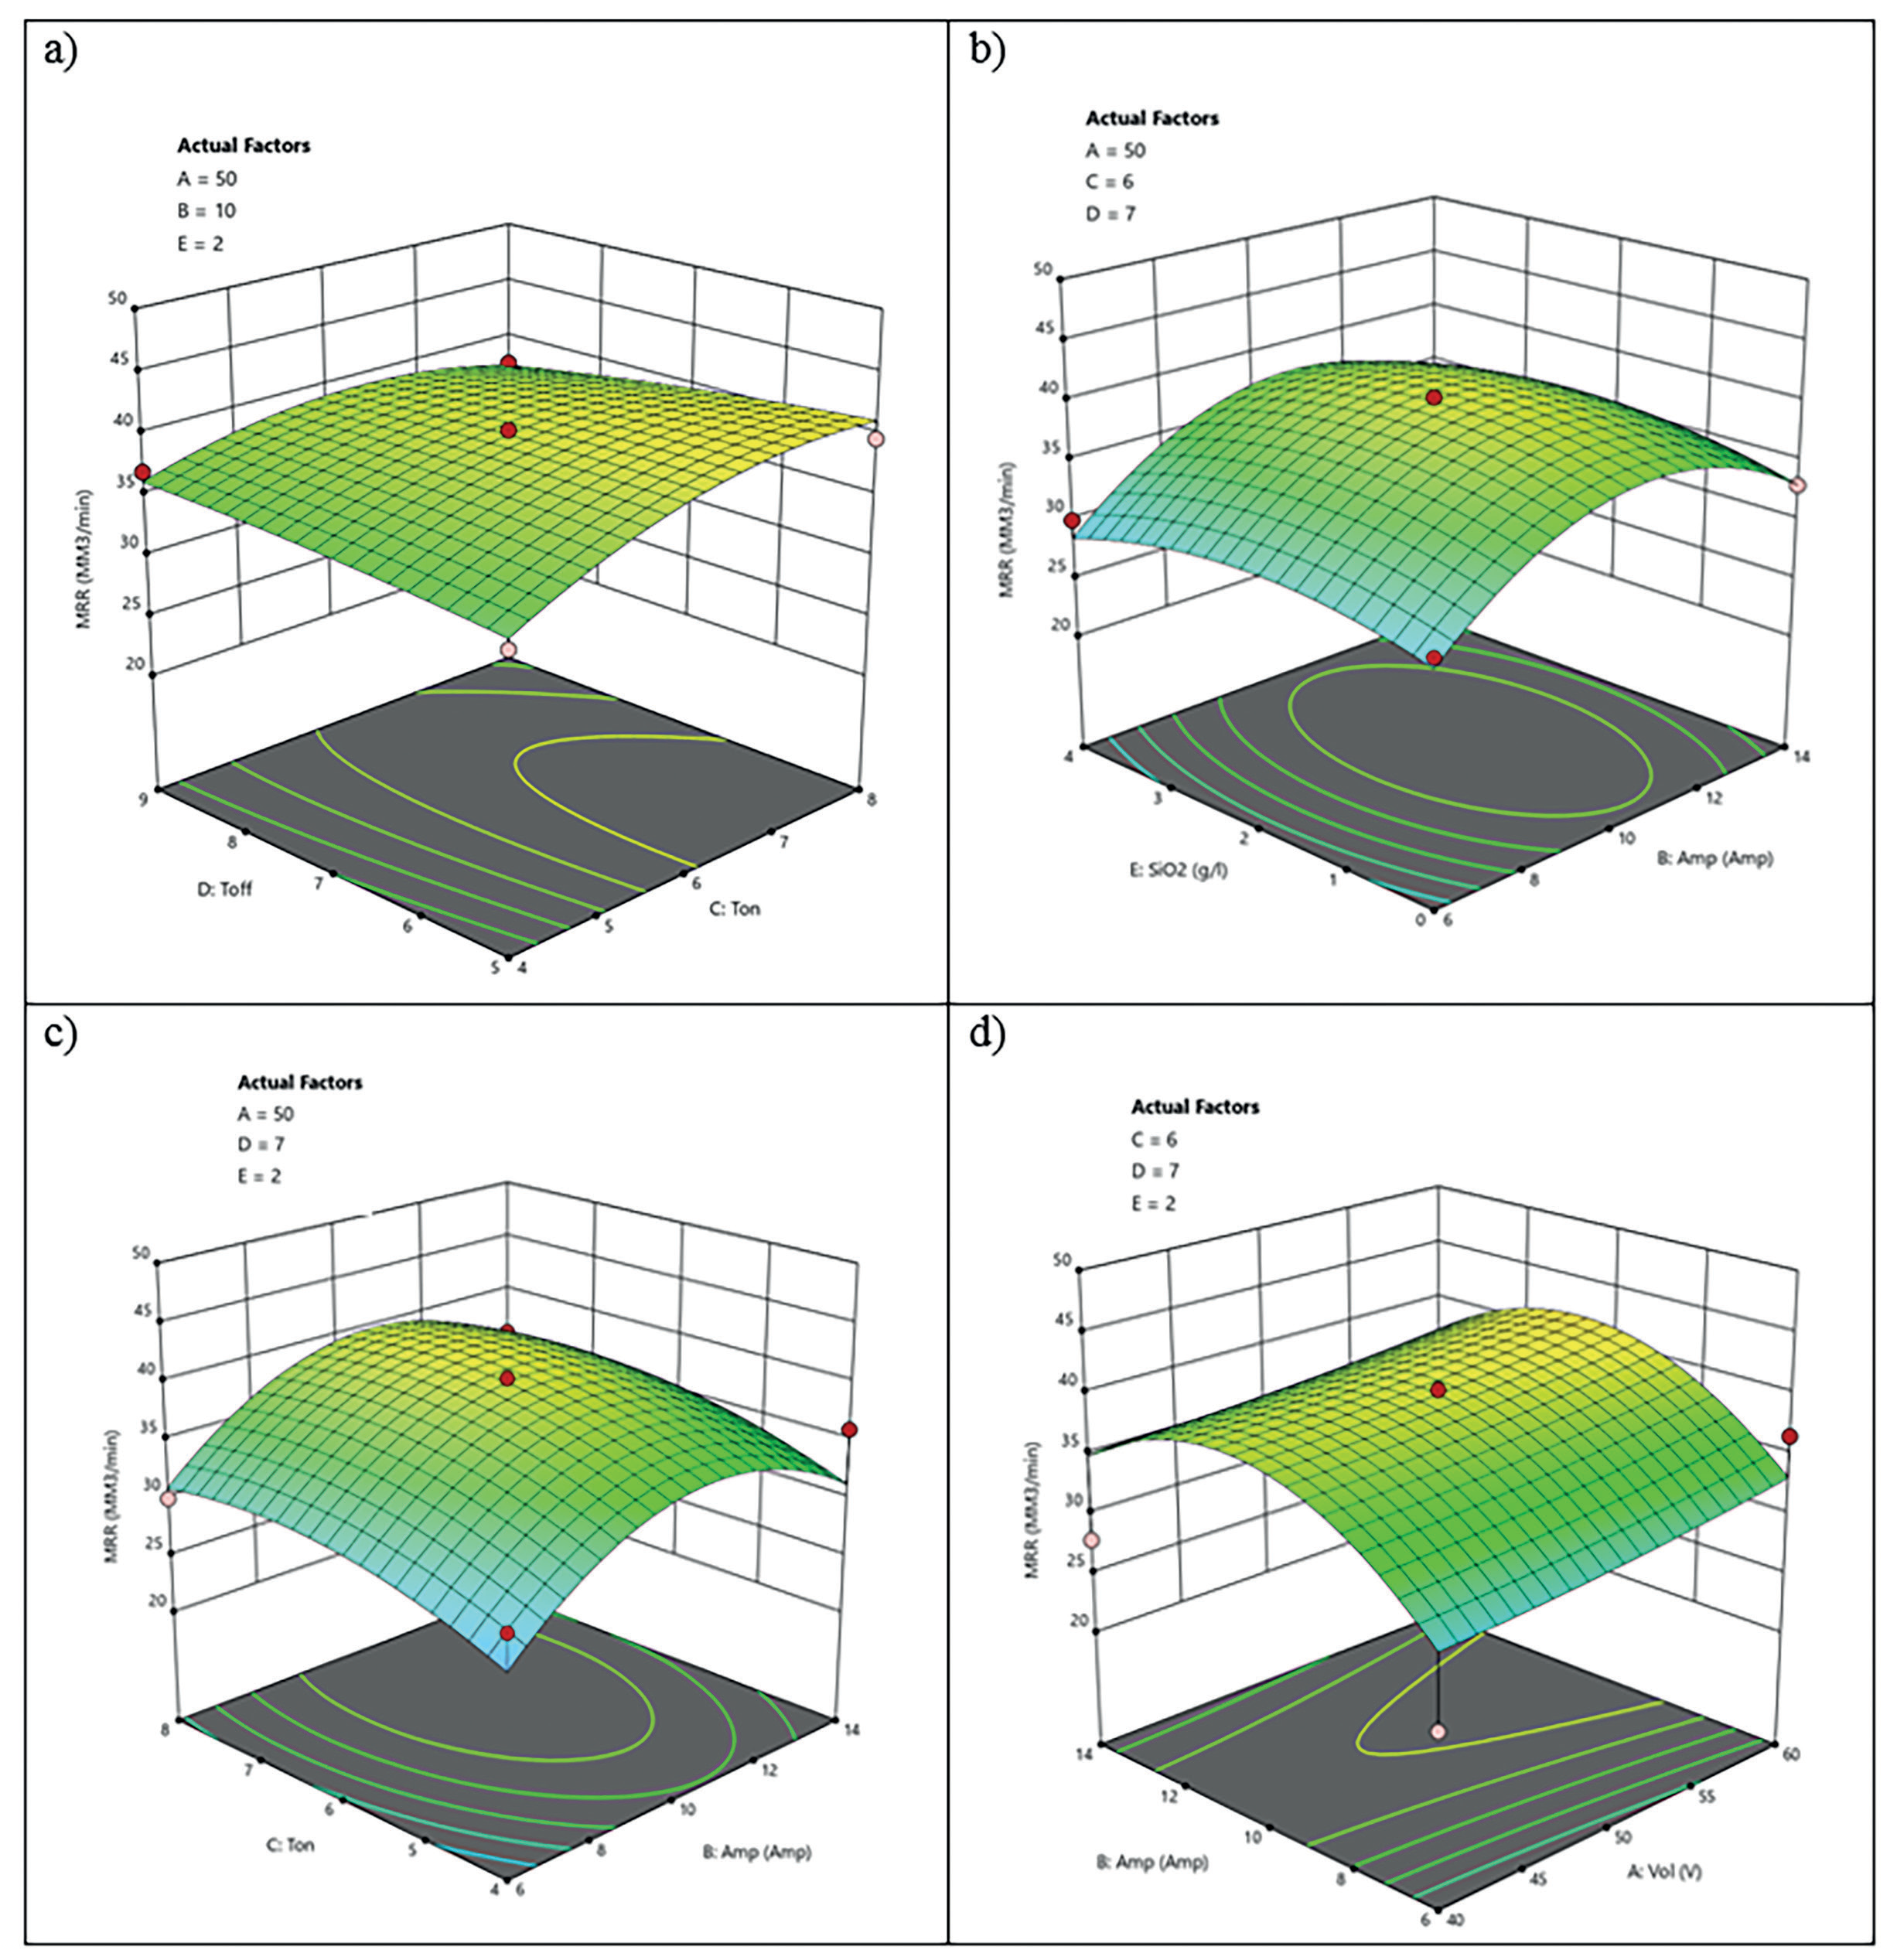
MRR surface plots for nanoparticle concentrations and various EDM input parameters are shown in Fig. 3 (a–d). MRR prioritized the factors of Amp (B), Ton (C), and SiO2 levels. As a result, greater MRR values are favored by higher Ton (C) and 8.72 Amp (B) values. The physical and chemical features of SiO2 reduce spark delay time, eliminate short circuits, and lessen arcs [33].
Influence of Factors on TWR
Table 5 displays the outcomes of the analysis of variance (ANOVA) on the response of TWR derived from the regression analysis. Based on the ANOVA, it is determined that there is statistical significance in the quadratic model. For the revised model, the statistical indicators are 0.8292 and 0.8898 for R-squared and Adj R-squared, respectively. Given that these numbers are close to one another and large, the suggested model has a higher ability to interpret experimental data. Regression models are simpler when meaningless components are eliminated, and they may typically be arranged to better capture the surface response. Equation (2) displays the updated model following the removal of the unnecessary terms.
(2)
Fig. 2.
a) MRR response parameter perturbation diagram b) TWR response parameter perturbation diagram c) SR response parameter perturbation diagram.
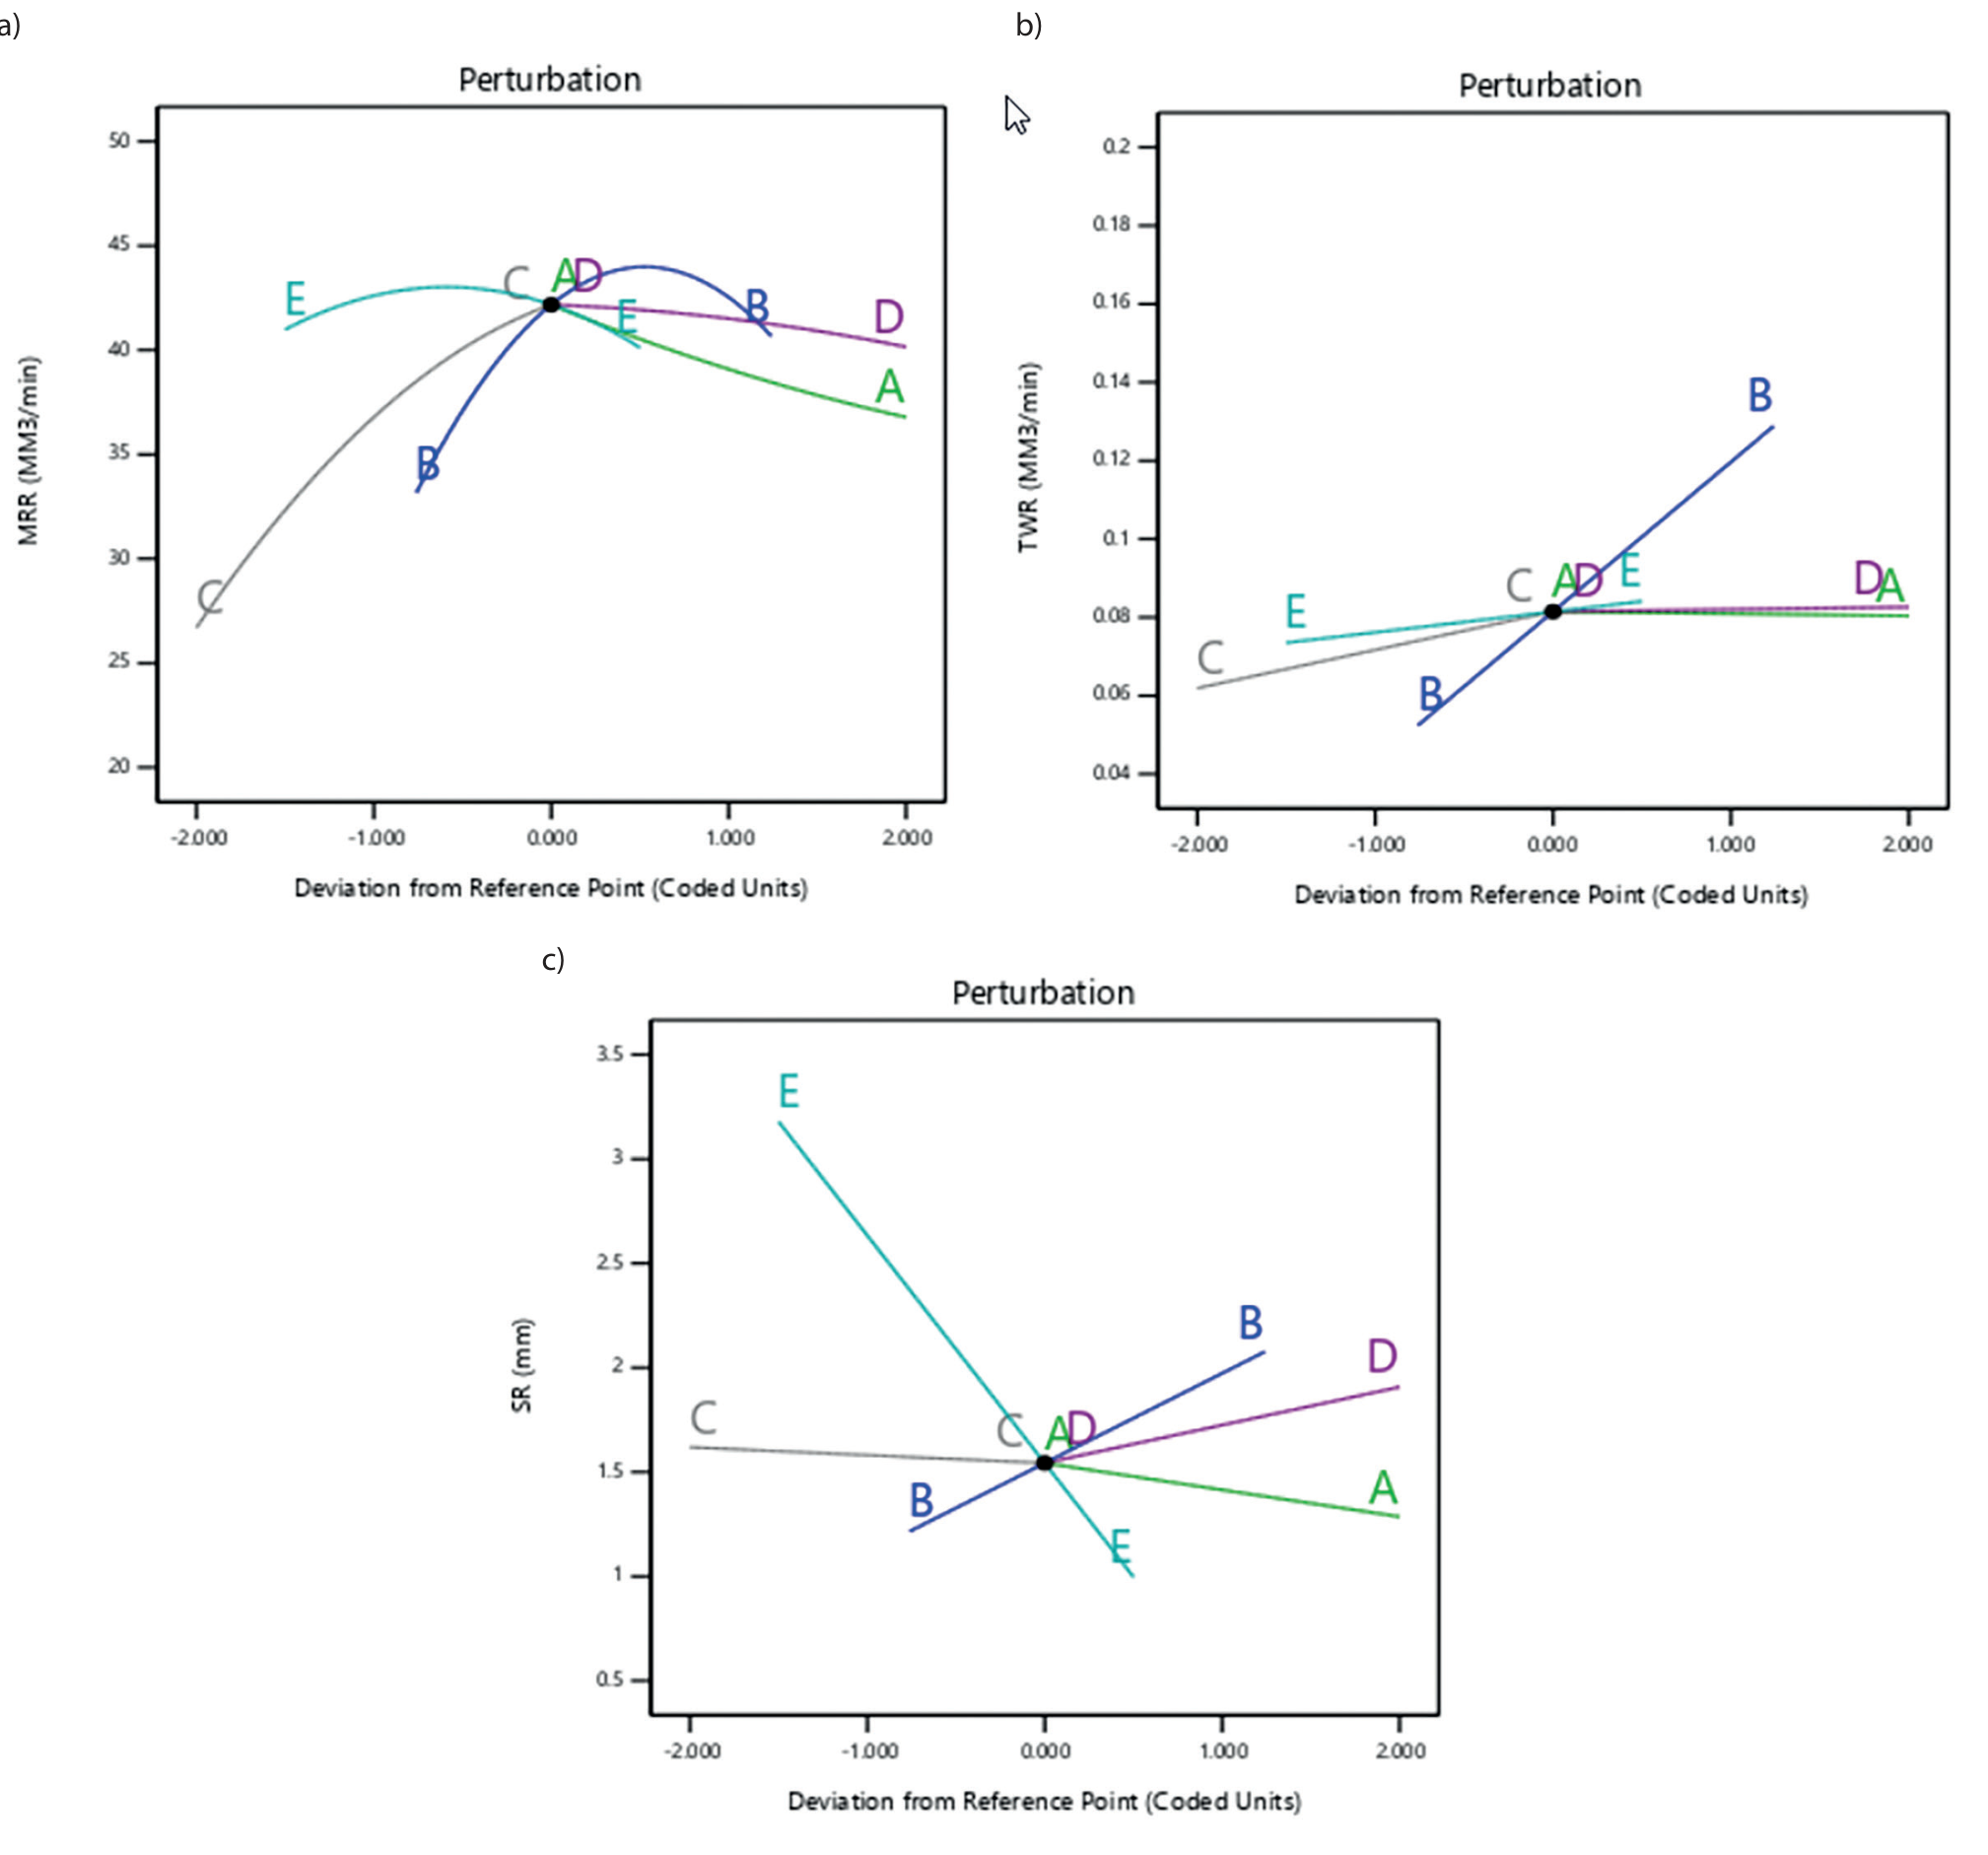
Table 5.
Variance analysis (ANNOVA)
Fig. 3.
MRR surface plots — Interaction between (a) Toff and Ton; (b) SiO2 levels and Amp; (c) Ton and Amp; (d) Amp and Vol.
A perturbation plot illustrating the impact of various machining parameters at a specific position on the TWR response is displayed in Fig. 2(b). The SiO2 particle concentration (E) and electric discharge current (B) in Fig. 2(b) show a linear relationship. The TWR in the deionized water dielectric is enhanced by raising the discharge current by producing heat in the discharge channel. The deionized water’s dielectric breakdown strength results in a longer spark delay time. Because of the suspended particles’ high conductivity, the dielectric breakdown strength of deionized water reduces when nanoparticles are added. Thus, adding nanoparticles to the deionized water facilitates an electrical discharge. Because deionized water has a thermal conductivity that is around 3.86 times that of kerosene, it is not as commonly employed in the electrical discharge machining sector. The tool corrodes more quickly due to the high thermal conductivity in the electric discharge zone. A significant portion of the heat produced in the plasma channel is absorbed by the nanopowder when it is added to the dielectric, delivering energy with a more robust and steadier spark to the machined surface. The lowest value of the TWR is provided by the particle composition, which is 3.751 g/l.
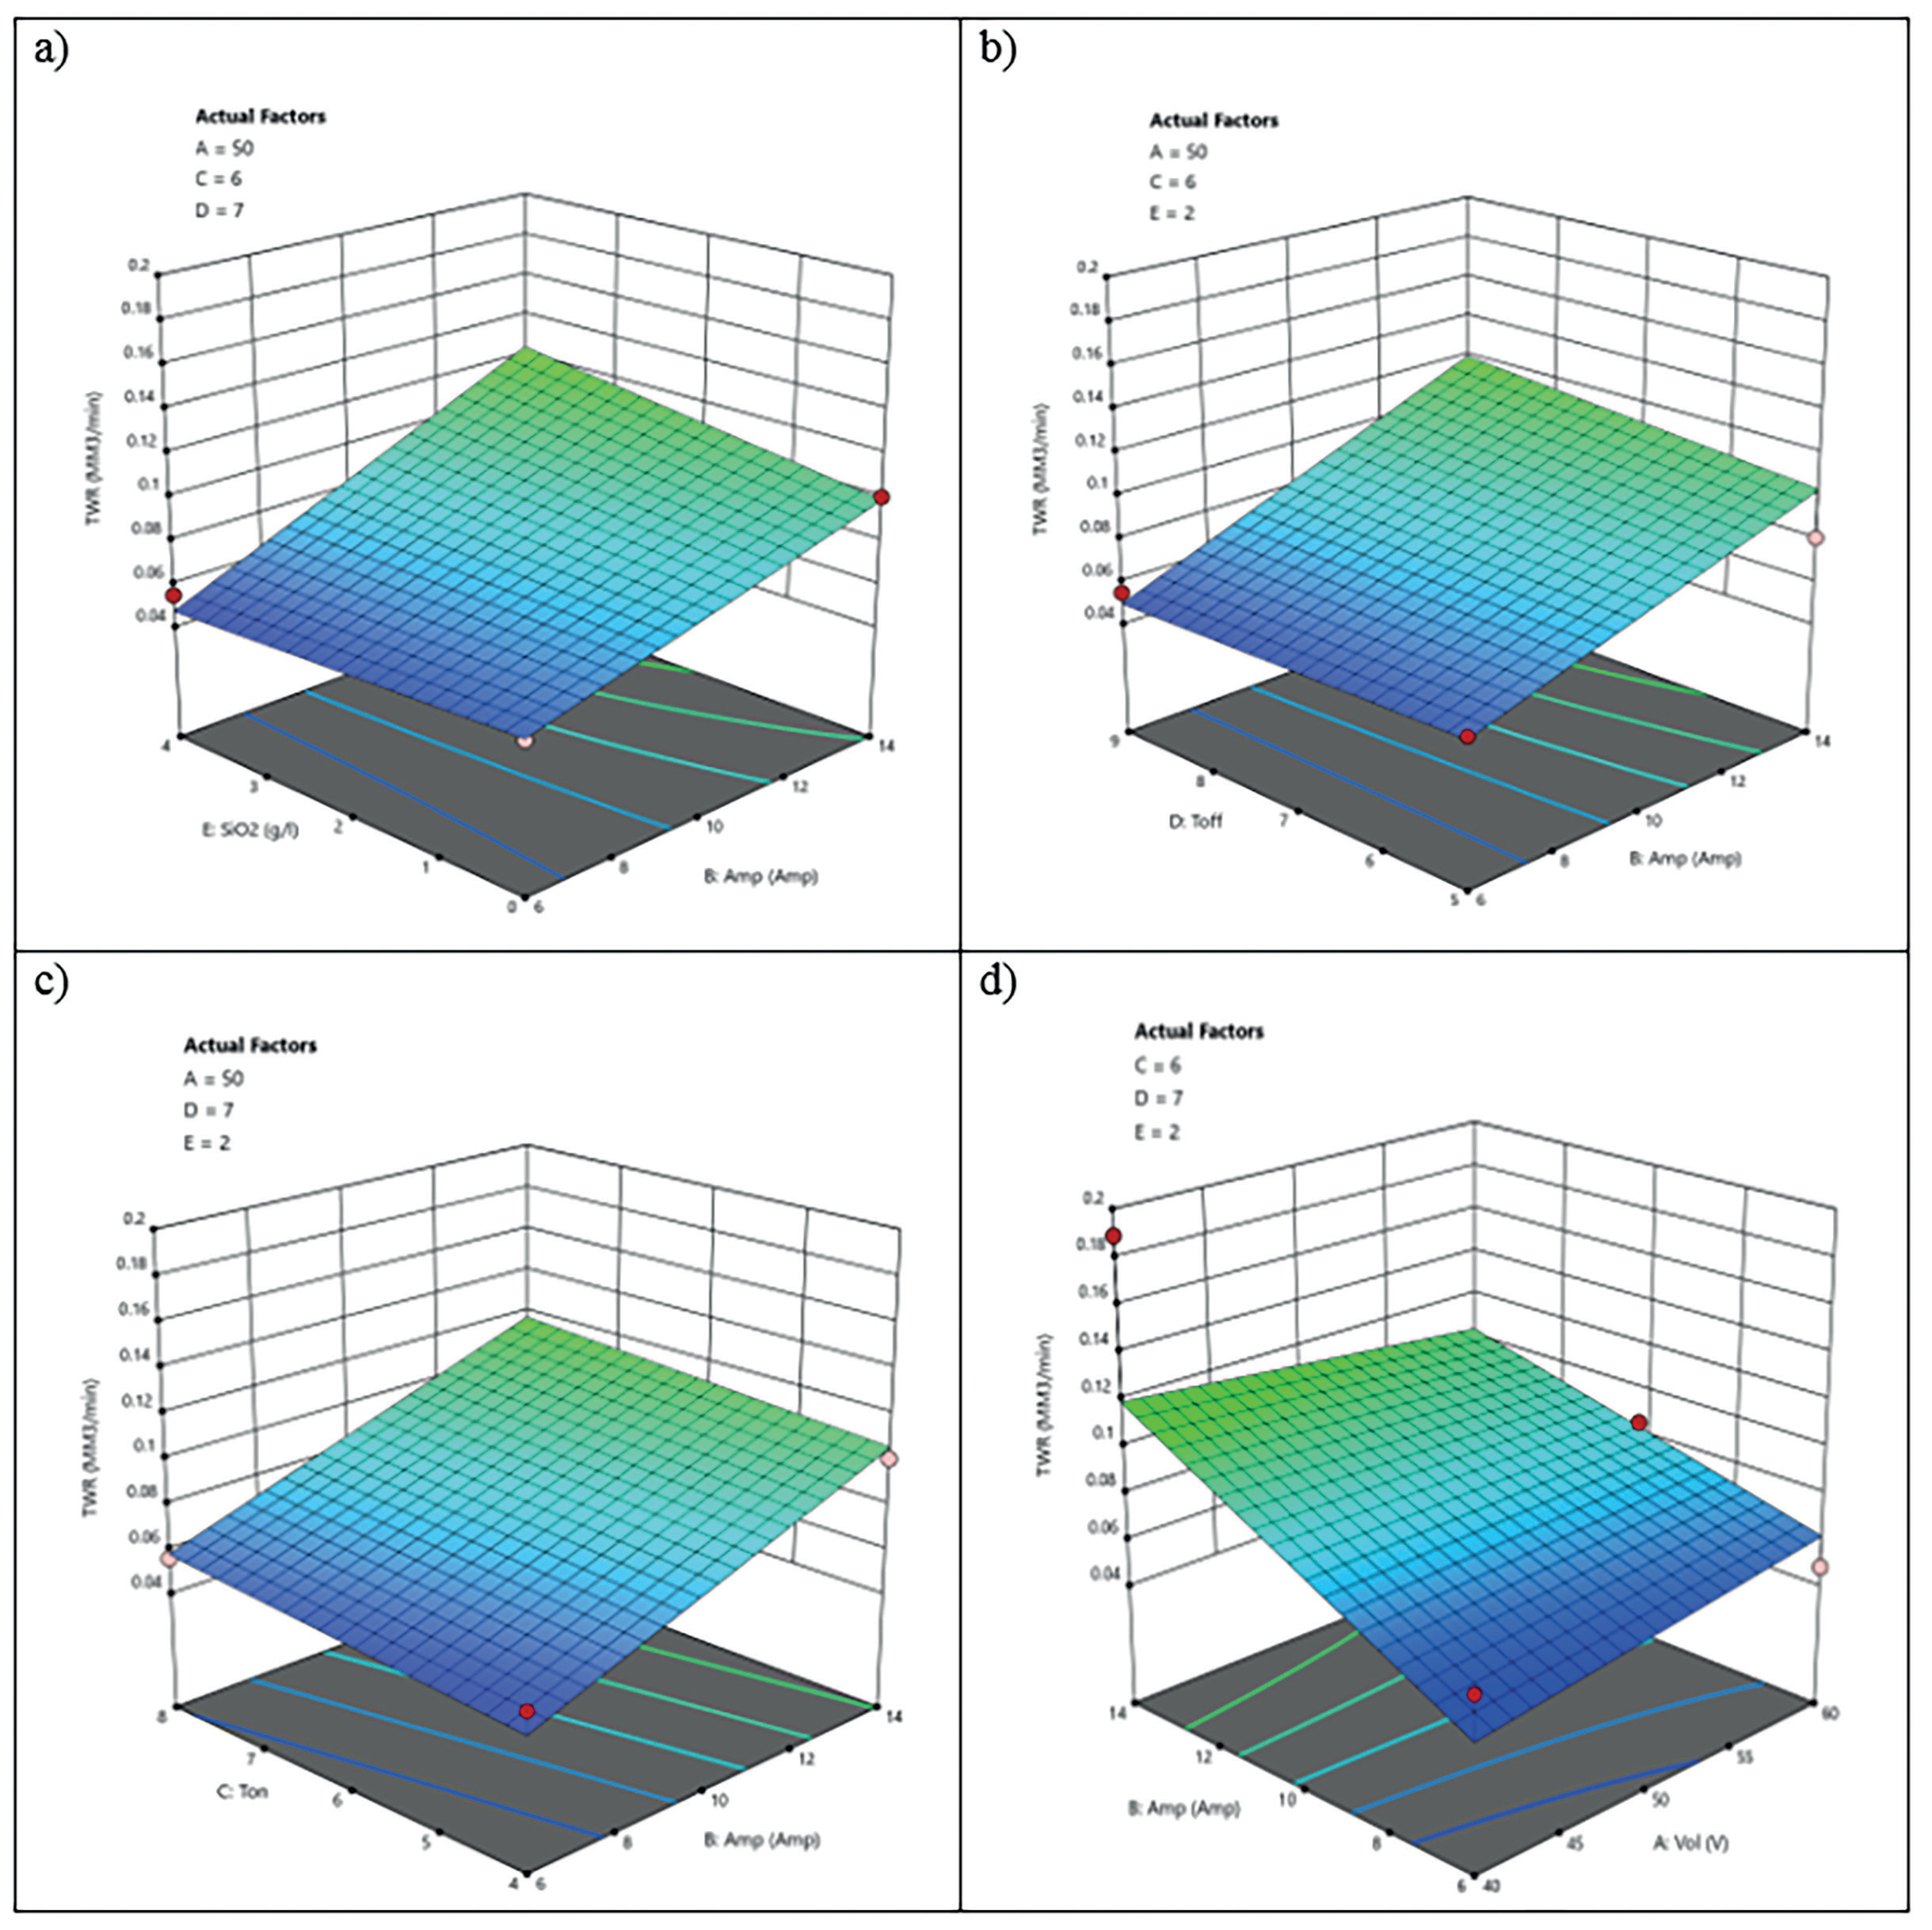
In Fig. 4(a–d), TWR surface plots for various nanoparticle concentrations and additional parameters are displayed. The two factors that most affect the performance of tool wear are discharge current (B) and SiO2 levels (E). Fig. 4 shows that at 8.724 Amps of discharge current and a mix of SiO2 nanoparticles of 3.751 g/l., the lowest TWR value is reached.
Influence of Factors on SR
In the electrical discharge machining process, the workpiece’s surface roughness (SR) is a crucial response. Table 5 displays the details of the analysis of variance (ANOVA) for the SR response. With a p-value of less than 0.05, the quadratic model’s outcome is statistically significant, according to the ANOVA table.
Equation (3) displays the final adjusted model for SR following the removal of the unimportant elements in terms of coded factors. For the SR model, the statistical indicators of R-squared and Adj R-squared are, respectively, 0.8601 and 0.8114.
(3)
A perturbation plot illustrating the impact of various input parameters on the SR response at a certain location is displayed in Fig. 2(c). Surface roughness is equally affected by the discharge current (B) and the concentration of SiO2 nanoparticles (E) in the SR response.
Fig. 4.
TWR surface plots—Interaction between (a) SiO2 levels and Amp; (b) Toff and Amp; (c) Ton and Amp; (d) Amp and Vol.
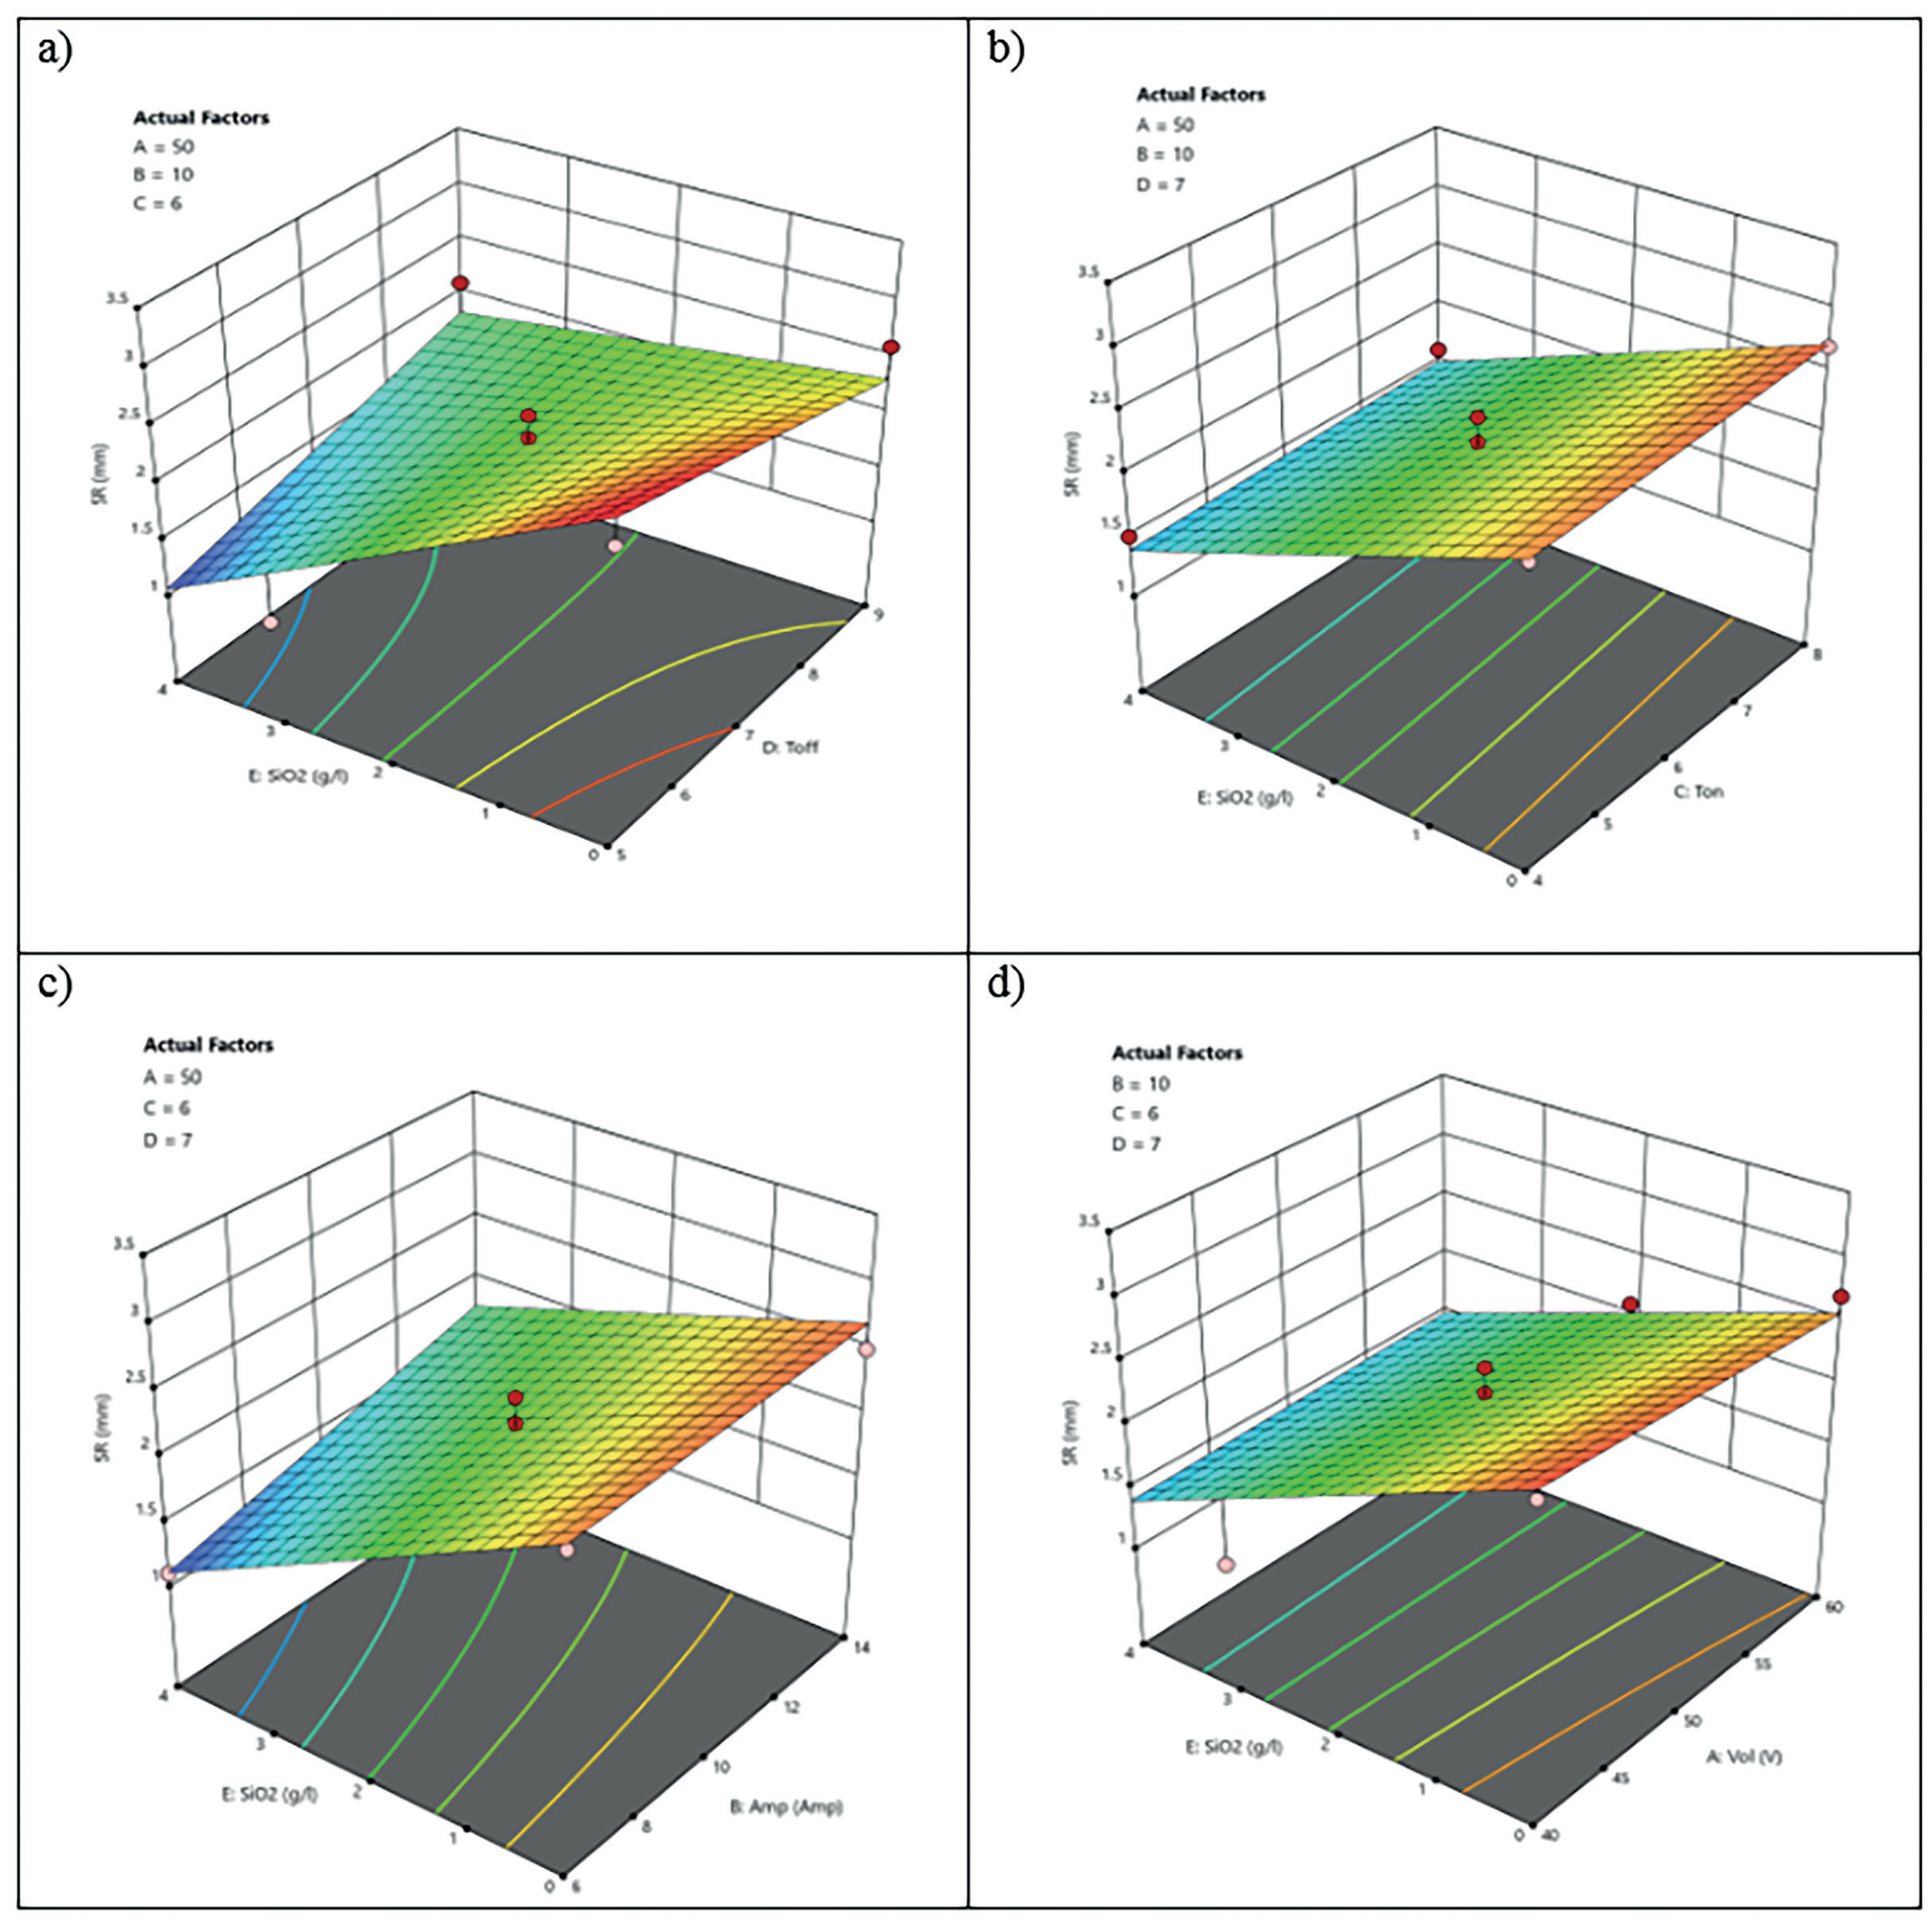
A surface graph depicting the impact of the nanopowder mix and discharge current on the SR response is shown in Fig. 5(a–d). As the amount of nanopowder (SiO2%) grows, Fig. 5`s surface roughness also increases. Because of the particles’ various chemical and physical characteristics, SR has increased. It creates various energy and heat releases on the workpiece surface. When the discharge current is increased, the material removal rate increases, resulting in deeper and wider cavities and greater SR. Furthermore, at low discharge current levels, the influence of the pulse on time on surface roughness is relatively minimal due to reduced pollution in the gap region.
EDMed Surface Analysis Using FE-SEM
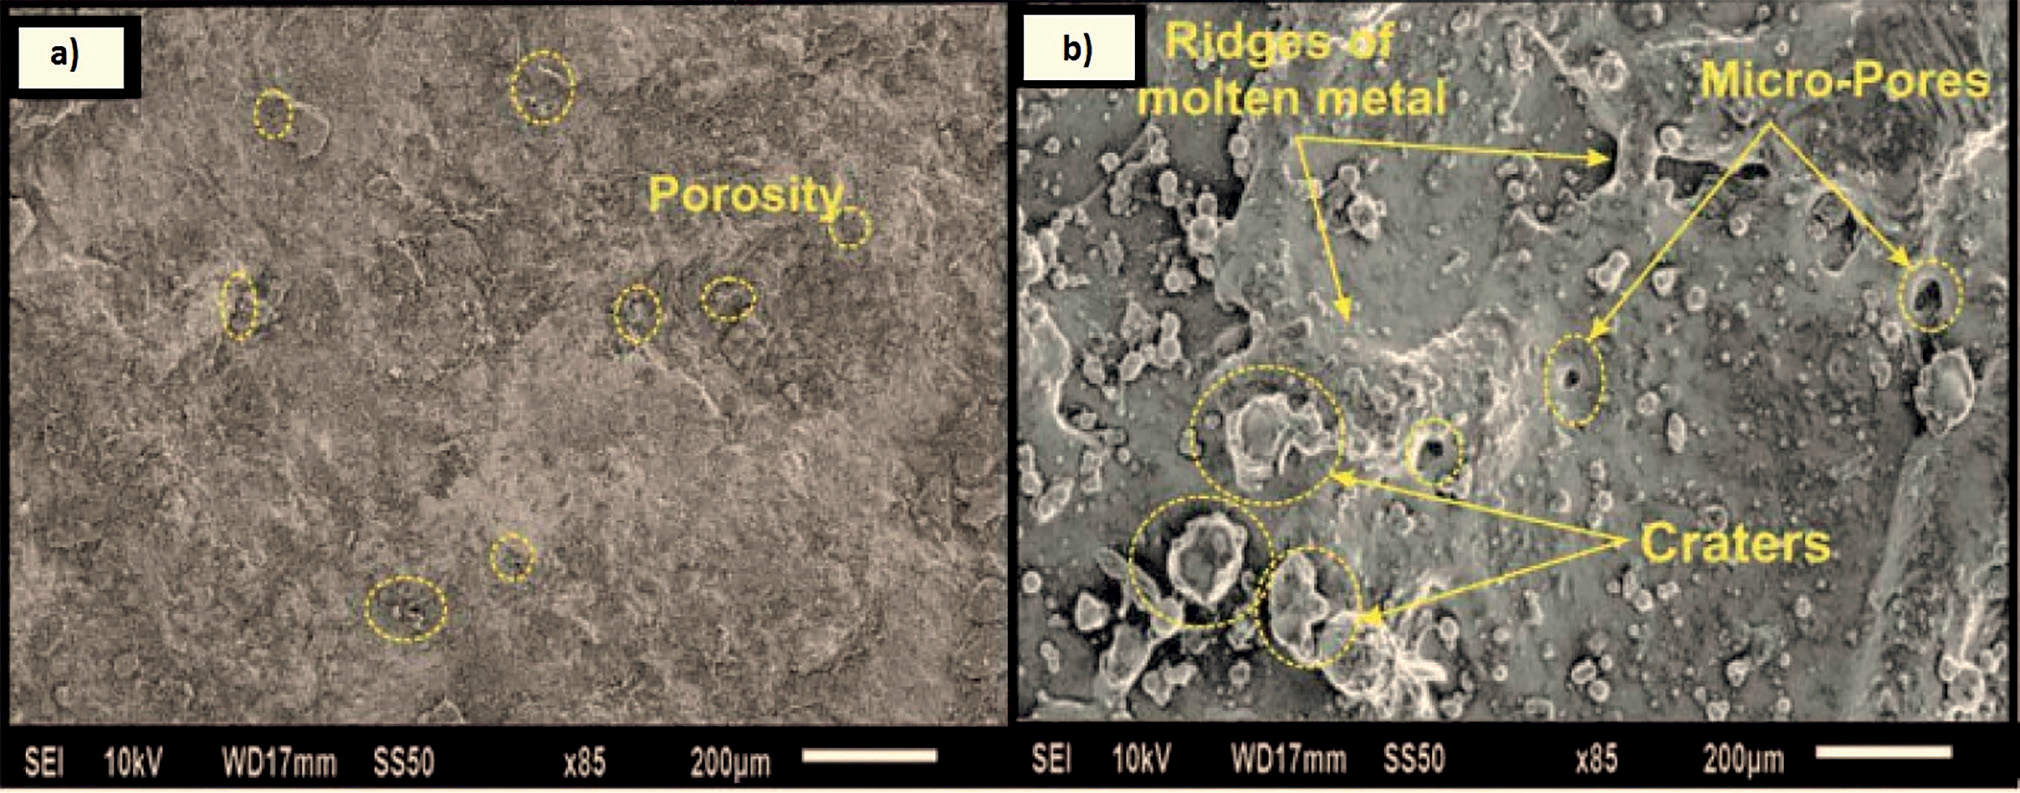
FE-SEM micrographs showing micropores and surface imperfections were seen on the Co-Cr and DSS alloy substrates without treatment (Fig. 6a). However, voids, re-solidified metallic droplets, and craters were seen on the machined DSS alloy surface (Fig. 6b). The treated substrate’s (EDMed) surface roughness, Ra = 0.997 μm, was found to be higher than that of the unmachined substrate (Ra = 0.64 μm). This was caused by the high frequency of spark energy and the appropriate configuration of the flushing system to remove debris from the cutting zone [34, 35]. The existence of micropores (~3 to ~5 mm) and molten metal droplets on the specimen surface supports the successful interaction of body tissues with the bioimplant surface, and these results support the significance of EDM in the biomedical area [36, 37]. Furthermore, the elemental analysis and phase transformation change during the EDM process were investigated for these particular DSS alloy samples.
Electrochemical Corrosion Examination
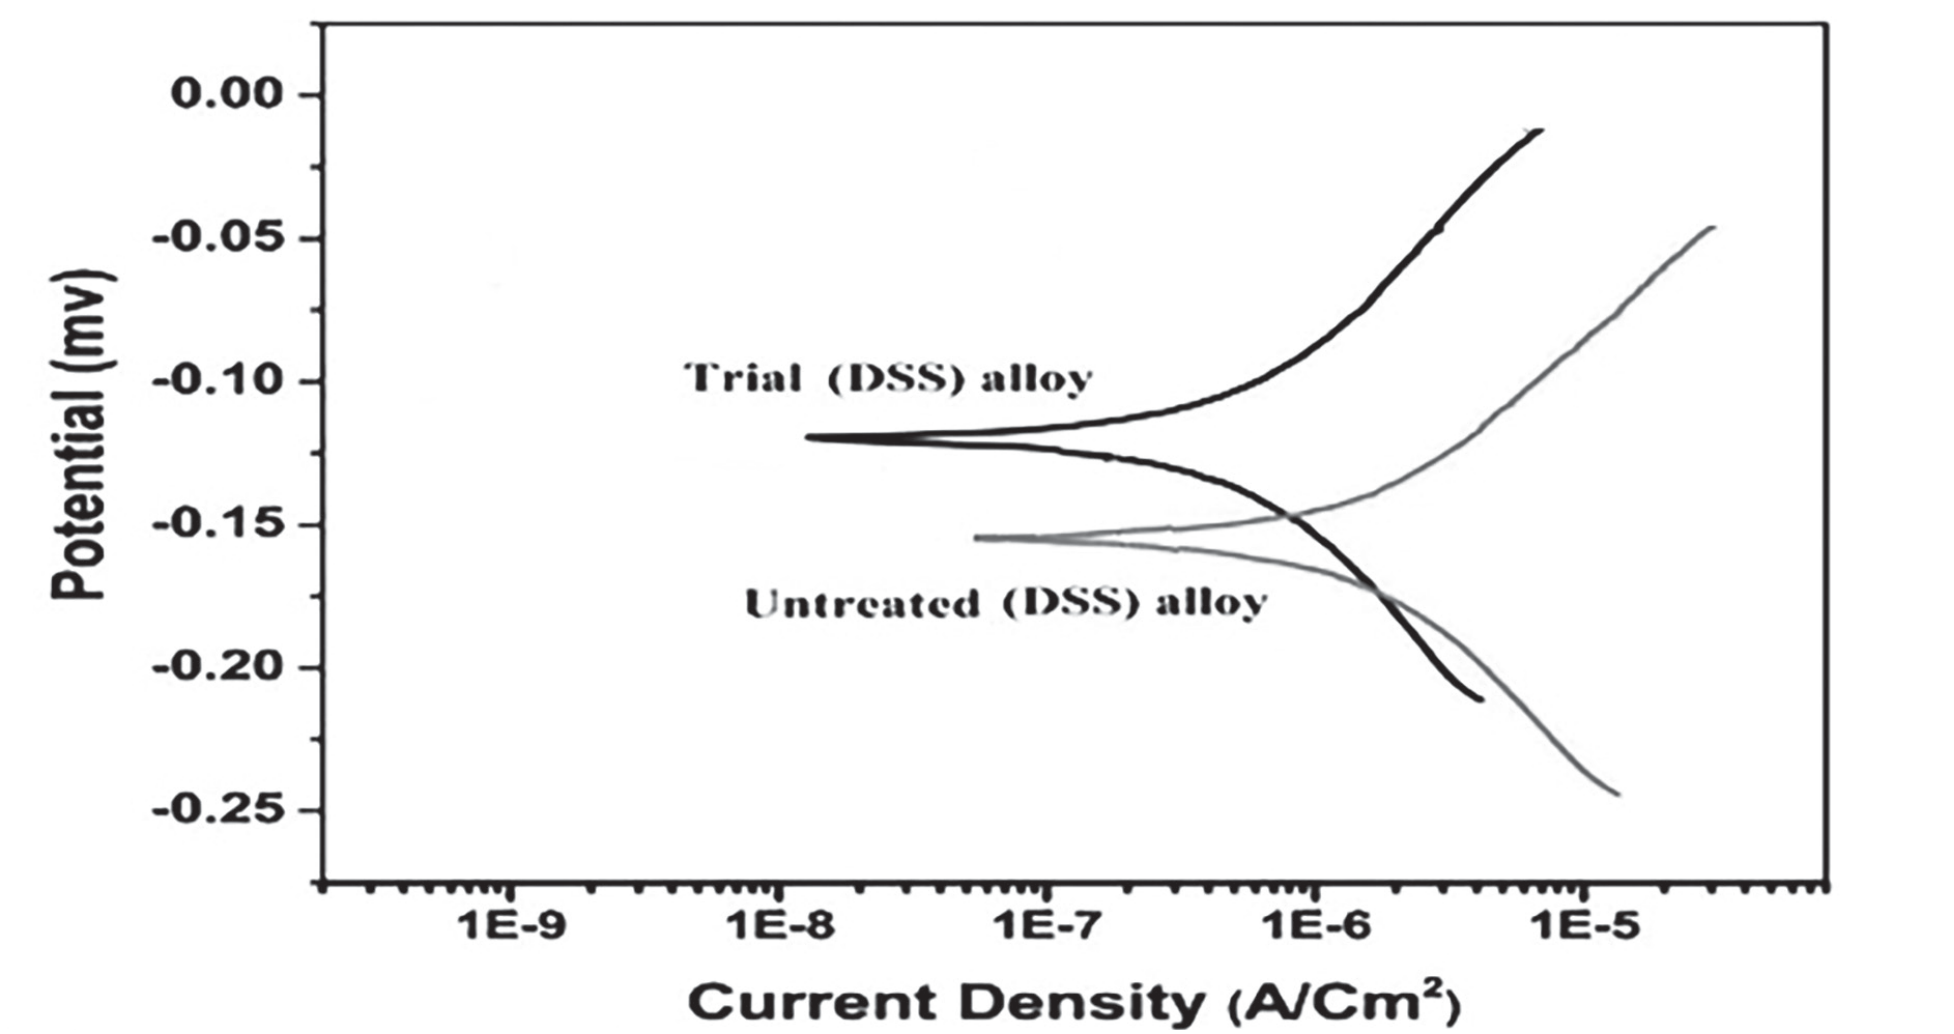
The corrosion performance of the EDMed substrates of the DSS alloy was investigated. In addition, the ways that treated substrates responded to corrosion were contrasted to alloy substrates that had not been machined. The Tafel slopes of the potentiodynamic polarization curves for the untreated and EDM treated DSS alloy substrates are displayed in Fig. 7. Nova computer software evaluated the anodic and cathodic slopes to determine the corrosion characteristics, which included corrosion rate, corrosion current density (Icorr), corrosion potential (Ecorr), and polarization resistance (Rp). The electrochemical parameter values for both alloys’ untreated and EDMed substrates are displayed in Table 6. Compared to an unmachined substrate (0.019157 mm/year), the EDMed substrate of DSS alloy corrodes at a slower rate (0.00763 mm/year).
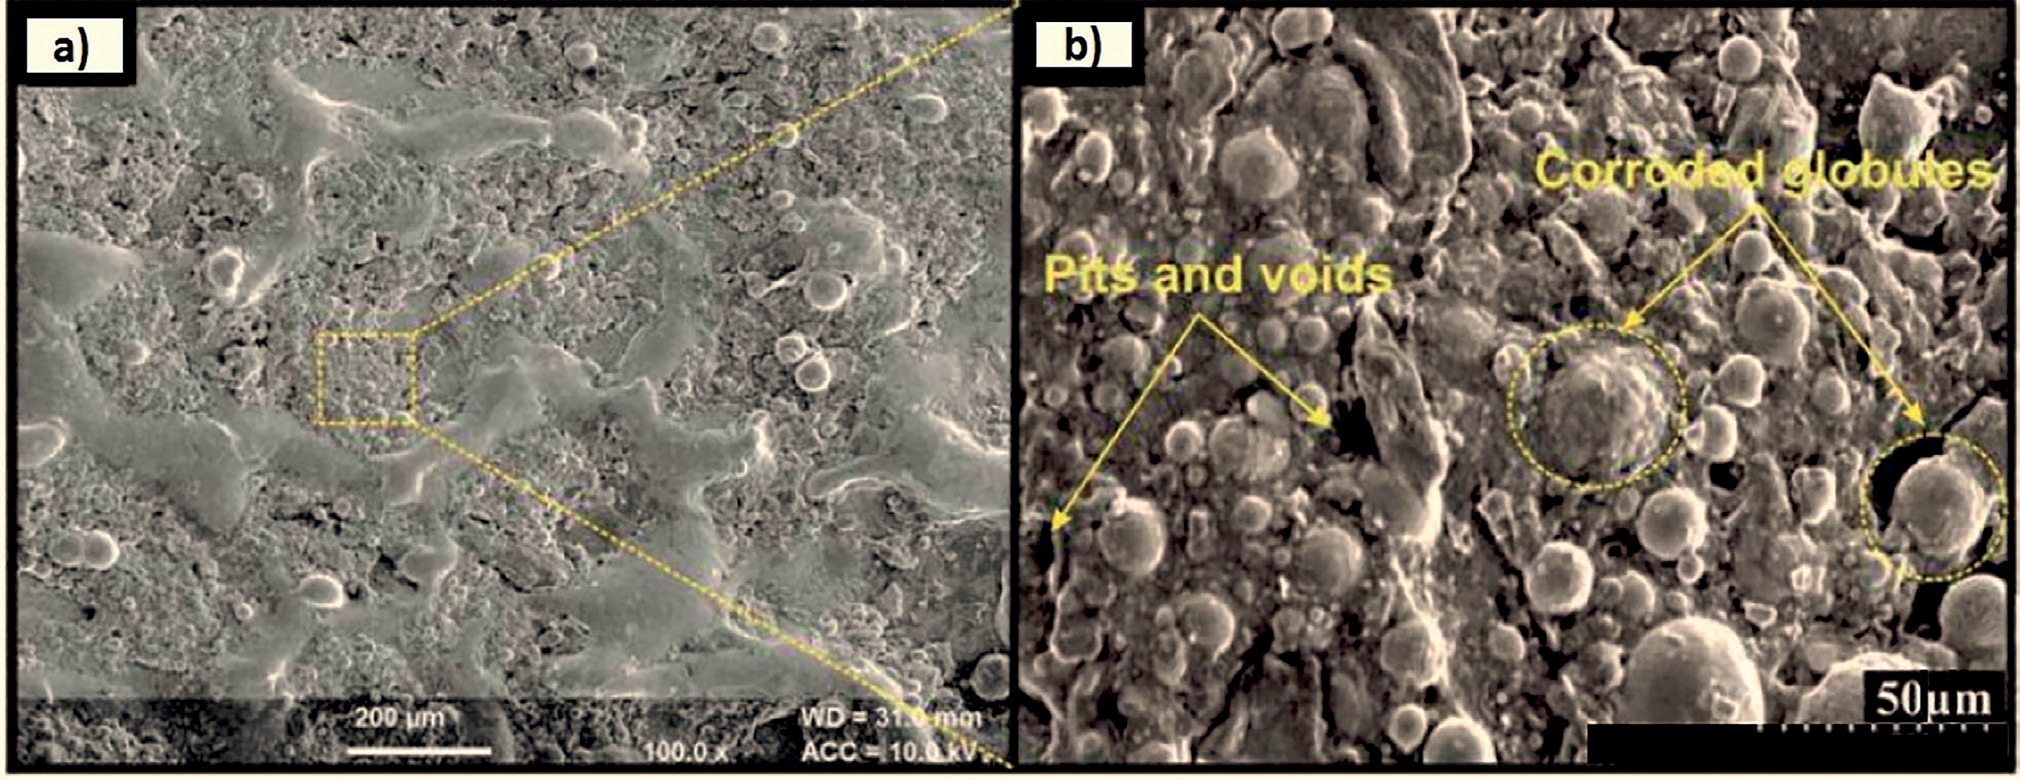
The surface topography of the EDMed substrates during electrochemical corrosion testing is described by FE-SEM images shown in Fig. 8. The surfaces of the corroded EDMed substrates were uneven and possessed micropores. On the other hand, as seen in Fig. 8 (a) and (b), the machined corroded DSS substrates had a notable amount of pits, cavities, and globules on their surfaces. The study concentrated on the functioning and machining of a medical grade alloy. The results showed that the DSS alloy has better corrosion resistance, making it potentially useful in a variety of biological applications [38].
Conclusions
The present work demonstrated how the EDM input settings might be applied to improve the MRR, TWR, and surface quality of the DSS alloys. The experimental study was conducted using a Box-Behnken design based on the RSM and five factors: voltage, current, spark ON time, spark OFF time, and SiO2 levels (g/l). The study’s conclusions are as follows: – Deionized water’s breakdown strength, material
removal rate, and spark delay time are all lowered
when nanoparticles are added, due to their excellent
physical characteristics and electrical conductivity. – Examining the behavior of the discharge current
reveals that the MRR rises at a larger discharge
current as the amount of SiO2 nanoparticles
in the composition increases. An enhancement
of 26.1% is achieved in the MRR by augmenting
the relative composition of SiO2 nanoparticles by
85% during discharge current (9 A), a pulse on time
(100 μs), a pulse off time (50 μs), a voltage (40V),
and a particle concentration (3.5 g/l). – High MRR and low TWR can be attained with
a discharge current of 9 A, pulse-on time of 100 μs,
pulse-off time of 50 μs, voltage of 40V, and relative
composition of 85%. – The SEM images show that a layer of recast
and a surface with the fewest cracks are produced
by a relative composition of 85%. This is because
the nanoparticles’ heat transmission and the plasma
channel’s proper concentration are to blame. – The EDMed surface exhibits micropores, and newly generated intermetallic complexes were confirmed by FE-SEM analysis. As a result, the surface may help the machined substrates function better when exposed to corrosive environments.