

Introduction
The ecological effects of human activities including farming, fishing, raising livestock [1], and the development of infrastructure are known as the "ecological footprint" [2]. A high Ecological Footprint score is associated with significant consumption of natural resources [3], which has an adverse effect on the ecosystem [4]. Few studies take into account the influence of government policy and the broad regulatory environment when analyzing the ecological footprint and its drivers [5]. There may be a geographical relationship between country-level Ecological Footprint indices [6].
Due to its importance in implementing policies connected to climate change and global warming, the analysis of the ecological footprint has drawn a lot of attention in recent years [7]. To supply the needed resources and to absorb waste, mankind currently requires the equivalent of 1.75 planets [8], which indicates that the planet needs an additional year and eight months to restore what is consumed in a year [9]. This problem demonstrates that natural resources and services are being exploited to a greater extent than nature can regenerate them [10]. The pursuit of sustainable development goals, which call for close coordination among the three realms of the economic, social, and environmental sectors, is an urgent priority for many nations [11]. Environmental protection is now a primary goal in this area [12]. People worldwide, especially the poorest and most vulnerable ones, are significantly impacted by environmental challenges including global warming, climate change, and air pollution [13]. As a result, quick responses and solutions are required to stop climate change and global warming and minimize air pollution. The use of renewable energy sources, such as biomass [14], wind, geothermal, and solar energy, in place of fossil fuels [15], which are projected to account for 80% of the world's primary energy consumption and 75% of greenhouse gas emissions, is one of the alternatives [16]. The majority of studies agree that using renewable energy helps to reduce CO2 emissions and reduces environmental damage [17]. Renewable energy has been expanding at an unprecedented rate recently due to advancements in energy efficiency [18], science and technology [19], and supportive legislation [20].
The ecological footprint has recently gained popularity and is frequently used in environmental investigations [21]. However, the relationship between biomass energy and ecological footprint has only been briefly examined in empirical investigations [22]. Additionally, these studies have overlooked the consequences of biomass energy generation in favor of concentrating on the implications of biomass energy consumption [23]. Land degradation, land competition, resource depletion, deforestation, food security, and biodiversity loss are just a few of the problems that biomass energy production may cause [24]. Additionally, the use of fossil fuels as well as CO2 emissions into the atmosphere may be impacted by the generation of biomass energy. As a result, ecology is severely impacted by the generation of biomass energy [25]. To evaluate the link between biomass energy and ecological footprint, we believe that biomass energy production is a better indicator than biomass energy consumption [26]. Additionally, in empirical models, this indicator aids in removing the impact of biomass energy export and import on a region's ecological footprint.
In general, the atmosphere is constantly in danger, even though climate change may bring very severe weather events. Additionally, the widespread usage of nonrenewable energy produces enormous amounts of greenhouse gas emissions, creating a worrisome scenario [27]. The environment must pay the price for economic expansion since resources needed for competition and advancement are disrupted. Economic growth causes ecological exploitation and numerous types of pollutants, including air, water, and land pollution, which ultimately end in the environment [28]. The ecological footprints (hereinafter EF) are regarded as the measure to calculate how much of nature humans have utilized, according to the Global Footprint Network (GFPN). It has to do with guaranteeing the sustainability of nations all over the world. The fundamental tenet of this accounting is to assess the supply and demand of natural resources all over the world. Demand for commodities and services produced by humans is linked to ecological footprints (EF).
According to environmental literature, it is a crucial measure of environmental sustainability and deterioration [29]. All of the natural resources used in production are included in the ecological footprints. For instance, the production necessary to gather marine species each year is included in the footprints of fishing areas. Resources for agriculture, such as crops, oil, cattle feed, fish meals, and rubber, are contained in agricultural footprints. The amount of forest needed to absorb carbon emissions brought on by humans is measured by forest land and carbon footprint quantity [30]. When it comes to national governance, it plays a crucial function in governing the environmental policies of a nation. Long-term economic growth is promoted by better national financial development and governance [31]. If the institutions operate freely while abiding by the local laws, they will undoubtedly make efforts to protect the environment. Even if the nation is developing, a better national government prioritizes the environment [32]. Therefore, lasting economic growth is possible if the governmental institutions are capable and efficient.
Based on the foregoing assumptions, this research adds to the body of literature by examining the relationship between the production of biomass energy and its environmental impact. The exploitation and use of natural resources also escalate the ecological footprint. Although natural resources are crucial for economic development, some of them, like oil, coal, and natural gas, are used at the expense of the environment, leading to deforestation, pollution, and the extraction of natural resources. Hence, such exploitation severely damages the ecology and depletes natural resources. However, there are claims that using natural resources to meet industrial, technological, and globalization demands might have negative effects such as land degradation since it absorbs and recycles pollutants and waste, helping to safeguard the environment [33]. Industry and manufacturing are the pillars of economic growth in China, just as energy is the primary driver of economic activity. Each nation should require new technology and innovation through foreign direct investment, technology transfer, and research for the development of clean technologies and processes to produce commodities, services, nonrenewable energy, and renewable energy.
Corruption, here defined as the "abuse of public power for private benefit" [34], has long been emphasized as a crucial factor in the development of a country and is currently a component of the larger "good governance" agenda supported by aid organizations. The underlying presumption is simple. Corruption can cause resources to be diverted from the public good to private consumption, which ultimately results in the loss of impacts that were meant to be of greater value. Indeed, according to [35], corruption "has distorted development priorities, led to massive exodus of human and financial capital, and undermined social and political stability in the developing world. Corruption is deeply harmful to the social and political fabric, investment, and economic growth. "Given this assertion, [36] contends that "it is difficult to overestimate the societal and economic implications of corruption".
Corruption has been connected to environmental sustainability in addition to social and economic advancement [37]. Although corruption does not generally have a negative impact on the environment, poor governance leads to poor policy formulation, management, and enforcement, which can harm environmental sustainability [38]. There are few empirical evaluations, despite the numerous supposed cause-and-effect links between corruption and environmental sustainability. Carter offers a qualitative illustration centered on environmental control in the New York trash sector and how this interacts with organized crime. Similarly, to how others have attempted to link corruption and economic success, there are cases that take a more quantitative approach by linking indices of environmental sustainability with measures of corruption [39]. This has been made slightly easier after the turn of the century thanks to the advent of the "high-profile" Environmental Sustainability Index (ESI) for sovereign states.
What role has environmental legislation played, what role may it play, and how can it help reverse these alarming trends? is a much more difficult question to answer. The main goal of this study is to stimulate critical research on the topic rather than to provide specific solutions. Law, understood in the traditional sense of official state law, has come to be widely recognized as a pivotal vehicle for pollution prevention due to its capacity to establish authoritative standards and decision-making processes for land use planning, pollution control, and nature conservation, among many other elements of contemporary environmental governance. The selection of legal tools and the design of legal institutions are both topics of continuous debate, though, as is the role of law in sustainability both now and in the future. The appropriate legal response to pervasive uncertainty and risk, the selection of legal intervention targets, the prospects for environmental law in developing nations, the appropriate ethical foundations for environmental law, the role of public deliberation in lawmaking, the relationship between environmental protection and indigenous and other human rights, and the role of different forms of legal ordering "beyond" state law, from corporate voluntarism to international law.
Sustainable development offers a framework for humans to coexist with and profit from nature, as opposed to flourishing, as we have done for centuries, at the expense of the environment. Nevertheless, sustainability currently lacks a strong or supportive legal foundation despite the various environmental and natural resource legislation that is in existence. If we are to make any real progress toward a sustainable society, much less achieve sustainability, we will need to design and implement rules and legal structures that do not now exist or that are implemented in a fundamentally different way. Greater CO2 emissions occur as a consequence of economic expansion (GDP), while a decline in GDP may decrease the rate of environmental damage [40]. When economic activity increases and traditional energy demand follows suit, carbon emissions inevitably climb. Additionally, conventional energy sources in developing nations emit more greenhouse gases [41]. Thus, it is crucial to implement environmentally friendly and clean energy generation techniques to ensure sustainable economic growth [42]. Developed nations are connected to share and utilize modern technology, such as renewable energy consumption (REC) based on wind, solar, biomass, hydropower, or tidal sources. Subsequently, these initiatives may contribute to the realization of the idea of sustainable growth [43].
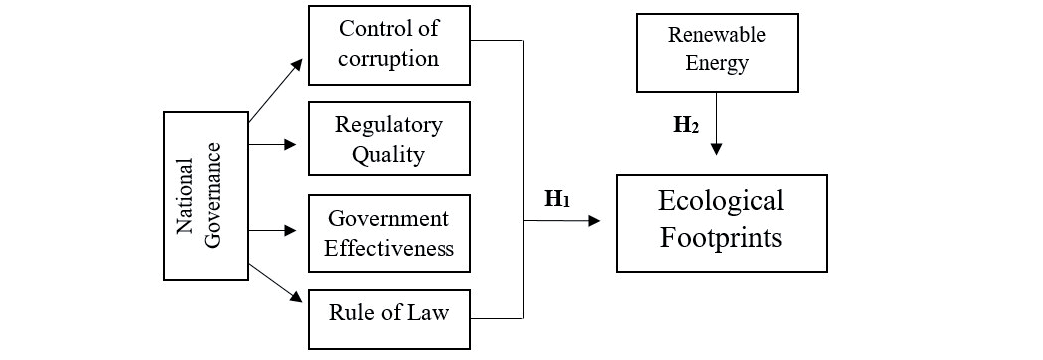
Effective national governance can conserve natural resources even in developing nations [44]. Since the national government has a considerable negative impact on CO2 emissions, independent and established government institutions seem to rescue the environment as a result. The development of renewable energy technologies also reflects the urge of a nation's policy and legislative framework. The inadequate environmental control is an outcome of inconsistencies in accountability and weak governance [45]. Hence, this evidence provides the foundation for the second hypothesis of this study.
H1: National governance quality has a significant impact on China’s ecological footprint.
H2: Renewable energy has a significant impact on China’s ecological footprint.
The ecological footprints, national governance, and renewable energy are the main areas of focus in this study, which intends to make multiple contributions to the extant literature. First, this study is distinctive in that it examines how national governance affects ecological footprints along with renewable energy. Second, to capture the impact of institutional and regulatory variables on the dependent variables such as corruption, rule of law, government effectiveness, and regulatory quality, we employed the Fully Modified Ordinary Least Square (FMOLS) and Dynamics Ordinary Least Square (DOLS) methods, two unique statistical techniques that are used to validate the robustness of empirical findings of ordinary least square methods.
Literature Review
Due to the use of non-renewable energy sources like coal and wood, which ultimately have negative effects on the environment, consumption and burning of energy are therefore seen as key factors that contribute to global warming and climate change [46]. Furthermore, as energy use rises, it intensifies CO2 emissions in the form of environmental pollution [47], whereas renewable energy has less adverse impact on environmental quality than non-renewable energy. As a result, there is a one-way causal relationship between urbanization, economic growth, energy use, and environmental degradation.
Since human activities are linked to the ecological impairment of the environment [48], the ecological footprint is assessed based on how a community uses natural resources to meet its requirements [49]. Natural resources, such as natural gas, minerals, and water resources, are seen as a crucial component of sustainability for both emerging and developed nations, as well as for the preservation of clean energy [50]. Considering this, [51] asserts that natural resources, which include oil, gas, minerals, coal, and forests, may both contribute to economic growth and environmental damage depending on how they are used. As a result of the increased focus on sustainability issues, academics are becoming increasingly interested in observing the connection between natural resources and environmental deterioration. Similarly, it is believed that natural resources have a significant role in CO2 emissions [52].
In a similar vein, [53] found that rising CO2 levels are a direct result of growing natural resource depletion. For instance, a 1% rise in resource depletion will result in an equal increase in CO2 emissions and energy consumption. Additionally, the ecological footprint is dependent on the use of natural resources and biological resources rather than CO2 and greenhouse gas emissions [54]. Similar to how natural resources increase biocapacity, they also have a favorable impact on the ecological footprint, which eventually results in an improvement in environmental quality [55]. Contrarily, it is also believed based on the empirical data that natural resources, renewable energy, and urbanization harm the ecological footprint while having a beneficial impact on the improvement of environmental quality.
Energy consumption and financial development have a favorable impact on greenhouse gas emissions [56]. The impact of urbanization, financial growth, commerce, and energy consumption on GHG emissions was examined in 34 countries. The results of the causative connection showed a one-way causation between carbon emissions and financial development [57]. Additionally, the effects of energy usage, economic growth, and financial development on CO2 emissions were also evident. Results of the VAR model on data from 24 MENA nations showed that there was no association between energy consumption and economic growth in terms of protecting the environment. However, according to [58], the use of clean and renewable energy sources reduces CO2 emissions in the BRICS nations. [59] employed the MMQR approach and observed that renewable energy is substantially and negatively related to GHG emissions.
The findings of renewable energy consumption and forest area demonstrate a substantial long-term negative relationship with ecological footprints, indicating that ecological footprints will decline with increased renewable energy usage and forest area. [60] used the common correlated effects (CCE) and augmented mean group (AMG) processes of estimation to evaluate the EKC hypothesis for the 50 US states between 1980 and 2015. EKC was evident in only 14 out of the 50 states. Similar studies also employed the EKC framework with various other factors, such as capital, labor, energy, energy prices, etc. [61].
Numerous studies have investigated the relationship between renewable energy and environmental deterioration (see [62, 63]). Some earlier studies showed that energy consumption is the main cause of CO2 emissions in the EKC framework [64]. In the context of developing economies, [65] evaluated the EKC hypothesis between 1990 and 2015 and explored the relationship between CO2 emissions and renewable and nonrenewable energy. They found that non-renewable energy has a positive association with CO2 emissions, whereas renewable energy has a negative linkage with carbon emissions. Likewise, [66] further supported the EKC hypothesis in G20 nations by examining the connection between CO2 emissions, agriculture value-added, renewable energy use, and per capita GDP. [67] validated the reliability of the EKC hypothesis for Pakistan between 1970 and 2012. Besides, [68] also substantiated the EKC hypothesis in the USA by employing the ARDL bounds testing technique.
Previous studies have contributed to the extant literature about the ecological footprint by examining the influence of carbon emissions and the use of renewable energy on the environment [69, 70]. The current study is innovative in the sense that it analyzes the role of the four pillars of national governance, such as government efficacy, the rule of law, corruption control, and regulatory quality, on the ecological footprint along with the use of renewable energy. Against the backdrop that China is the second most populated country, the pressure on ecological footprints can be reduced by the implementation of effective environmental governance. The current study significantly contributes to the literature by empirically exploring each pillar of governance and its resulting impact on the control of an escalating ecological footprint in China. Besides, we also observe how the increased use of renewable energy by China assists in reducing overall carbon emissions.
Material and Method
Sampling, Procedure, and Technique
With the help of moderating impacts of economic growth and renewable energy, the study assesses the impact of national governance on ecological footprints. The study is based on China’s yearly data from 1996 until 2021. Table 1 presents a description of the variables. The data on ecological footprints (EF), economic growth (GDP), and renewable energy have been extracted from the World Bank’s (WDI) indicators. World Governance Indicators are used to gather information about country governance (WGI). The four pillars of national governance are government efficacy, the rule of law, corruption control, and regulatory quality. We include GDP as a control variable that has been recognized as an important factor in previous studies concerning the Chinese economy. Because China’s cultivated land resources and other variables may have a certain effect on China’s cultivated land investment, we used cultivated land resources as arable land as a proxy of ecological footprints along with other variables representing national governance and renewable energy.
This research used fully modified ordinary least square (FM-OLS) and dynamic OLS (D-OLS) approaches to empirically examine the study's hypotheses. By allowing for uneven serial correlation of mistakes across individual members, the FM-OLS approach solves these issues [71]. In the small sample, it has been shown to be impartial when compared to other estimators like D-OLS and FM-OLS. In D-OLS estimation, the endogeneity may be controlled by taking the lagged and lead differences.
Results and Discussion
Unit Root Analysis
It is essential to examine the order of integration of the series before conducting further analysis. Thus, the study evaluates the integration features of the series by employing unit root tests. First, the study uses the conventional augmented Dickey-Fuller (ADF) unit root tests. The Kwiatkowski–Phillips–Schmidt–Shin (KPSS, 1992) test figures out if a time series is stationary around a mean or linear trend or is non-stationary due to a unit root. A stationary time series is one where statistical properties — like the mean and variance — are constant over time. The null hypothesis for the test indicates that the data is stationary. The alternate hypothesis for the test suggests that the data is not stationary. If the data is stationary, it will have a fixed element for an interceptor, and the series will be stationary around a fixed level [72]. The test uses OLS to find the equation, which differs slightly depending on whether one wants to test for level stationarity or trend stationarity [73]. The results of KPSS reported in Table 2 indicate that all the variables of the study are stationary at level, and these results are also validated by the ADF test.
Table 1.
Introduction of Variables.
Table 2.
Unit Root Test.
Descriptive Statistics
By creating summaries of data samples, descriptive statistics are used to describe the characteristics of a data set. It is frequently presented as a summary of data that explains the data's contents. Measures of variability concentrate on the dispersion of data, whereas measures of central tendency concentrate on the average or middle values of data sets. A collection of data's distribution's dispersion may be determined using measures of variability (also known as spread). For instance, while a measure of central tendency can provide the average value for a group of data, it cannot characterize the distribution of the data within the set. According to [74], data falls between the positive and negative values 2 for skewness and 7 for kurtosis, indicating the normality of data. The findings in Table 3 demonstrate that the data do support the assumption that each variable has a normal distribution, as the null hypothesis is rejected based on a p-value that is greater than 0.1 for all variables.
Table 3.
Descriptive Statistics.
Correlation Matrix
A table displaying correlation coefficients between variables is called a correlation matrix. The correlation between the two variables is displayed in each cell of Table 4. Data are summarized using correlation matrices, which are also utilized as inputs for more sophisticated studies and as diagnostics for such analyses. A linear relationship between two predictors is known as collinearity. Multicollinearity refers to the relationship between two or more predictors that is mostly linear [75]. Multicollinearity is often indicated by an absolute correlation value of greater than 0.85 between two or more predictors or independent variables. A strong indicator of improved predictability is a correlation between a "predictor and reaction." To create a trustworthy model, there must be a solution to the issue of correlation "among the predictors." If we closely observe the values of the correlation matrix presented in Table 4, we can see the variables of the study are showing values below 80% association pairwise.
Ordinary Least Square
Arable lands have limited capability to produce agricultural products, and the limits to crop production are determined through climate and soil conditions as well as the management practices applied. On this basis, productivity could be improved by matching crop requirements with land potential and teaching management to overcome limitations. For years, farmers and solar companies have debated which land use is more sustainable, solar fields or farm fields. Using more land for renewable energy is a controversial topic. Why take the farm out of production when it could work symbiotically with the energy field? Engineers and farmers are working together to find solutions that focus on collaboration, not competition. Creating a new type of farmland that raises crops or livestock while also producing energy may protect agricultural lands from development while keeping them in food production. This shows a negative relationship between renewable energy and arable land and can be seen in Table 5 that a 1% increase in renewable energy leaves 0.3% percent of arable land without production. While GDP has a positive impact on ecological footprints. If determinants of national governance are considered, then it reflects that Law and COR as negative determinants of ecological footprints. Corruption and violations of the law in planning and zoning processes are employed to regulate the use and development of land. These processes are vulnerable to corruption since decision-makers are required to balance the competing interests of various stakeholders by placing limits on landowners’ rights to urban land use and their discretion to construct buildings.
Table 5.
Ordinary Least Square.
Fully Modified Ordinary Least Square and Dynamic Ordinary Least Square
To solve the issues raised by the long-term connection between the co-integrating equations and stochastic regressor innovations, [76] suggests an estimator that makes use of a semi-parametric adjustment. The resultant Completely Modified OLS (FMOLS) estimator has a fully efficient mixture of normal asymptotic and is asymptotically unbiased, enabling conventional Wald tests with asymptotic Chi-square statistical inference. The symmetric and one-sided long-run covariance matrices of the residuals are used as initial estimates by the FMOLS estimator. Furthermore, forecasting and modeling solutions using an equation estimated by DOLS are also based on the long-run relationship. If you wish to construct forecasts that incorporate the short-run dynamics, you may use least squares to estimate an equation that explicitly includes the lags and leads of the co-integrating regressors.
The study employs the FM-OLS and D-OLS tests. While various econometric approaches can be used to evaluate the long-run interconnection between variables, the Fully Modified OLS (FM-OLS) introduced by [76] and the Dynamic OLS (D-OLS) approach developed by [77] are used in this analysis. These methods permit asymptotic coherence to be obtained by considering the impact of serial correlation. FM-OLS and D-OLS can only be done if there is proof of co-integration between the series. The evidence of co-integration among variables is provided by the results of OLS. Therefore, long-term elasticity is calculated with FM-OLS and D-OLS estimators in this study.
The findings from the FM-OLS and D-OLS are reported in Tables 6 and 7. The outcomes show that keeping other indicators constant, a 1% increase in renewable energy decreases EF by 0.3% and a 1% increase in economic growth increases EF by 0.2%, respectively. The model fitness is illustrated by R2 (0.81) and adjusted R2 (0.87), suggesting that 81% of the changes in EF are explained by national governance and renewable energy. The remaining unexplained variations are attributed to the error term. Furthermore, the outcomes of the diagnostic tests revealed that there is no serial correlation, residuals are normally distributed, and there is no misspecification in the model.
Conclusion
The objective of this research was to uncover the nexus between ecological footprints, national governance factors, and renewable energy in the context of China. We employed two distinct statistical methodologies, namely FM-OLS and D-OLS, to accurately capture the effects of regressors on the dependent variable. In this research, our baseline econometric models are fully modified OLS and dynamic OLS regression analyses. The FMOLS and DOLS are performed by taking into account the existence of co-integration among the variables in an OLS-based model. Our empirical findings reveal that national governance and renewable energy significantly help to curtail ecological footprints in China. Moreover, we find a positive relationship between GDP and EF, which implies that heightened economic activity tends to escalate the ecological footprint in China. As far as the determinants of national governance are concerned, government effectiveness plays a negative role in the control of ecological footprints in China. The reason behind these outcomes is that an effective regulatory and governance framework ensures that regulations are in place to curtail the adverse impact of human activities on the environment. According to results reported in Table 4, a 1% increase in renewable energy results in 0.3% less use of arable land, demonstrating a favorable impact of renewable energy on arable land.
The use of planning and zoning procedures to control the usage and development of property sometimes involves corruption and legal violations. Because decision-makers must balance the competing interests of several parties by limiting landowners' rights to utilize urban property and their discretion to erect structures, these systems are susceptible to corruption. Moreover, our result indicates that the rule of law and control of corruption variables pose a negative influence on ecological footprints, suggesting that better law enforcement and control of corruption considerably help the Chinese government to reduce its ecological footprint. The use of planning and zoning procedures to control the usage and development of property sometimes involves corruption and legal violations.
Policy Implications
By means of arable land, China can alleviate the pressure on its domestic arable land resources and can, to a certain extent, ensure food security [78]. At the same time, it can effectively allocate domestic and foreign resources [79]. According to our findings, this paper proposes the following three policy implications. First: Chinese enterprises should protect the local ecological environment to pursue long-term benefits. Because the period of investment in cultivated land is long and the quality of cultivated land accounts for an important part of the evaluation system of cultivated land resources, Chinese enterprises should take good care of local land and water resources and should take their social responsibilities seriously in order to increase the proportion of locals in employment, for example, and create a good ecological environment for their project’s operations [80]. In addition to their ethical merits, these actions will support the sustainability of long-term investments in arable land.
Second, Chinese enterprises shall pay more attention to the areas with abundant land resources for many years. Thus, more attention should be paid to less-developed areas with sufficient investment in agricultural production in China. While profits may be low in the short term and losses may even arise initially, firms will be profitable in the long run and ecological footprints will be larger. Third, in addition to considering situations of local government corruption, more information should be collected regarding the wider cultural context of China, such as local religious beliefs, before investment decisions are made. Chinese enterprises should make a detailed plan and fully examine the investment environment, choose the appropriate mode of investment, protect the legitimate rights and interests of local farmers, and reduce their investment risks.
The study offers a framework for understanding the ecological footprint in the context of national governance and renewable energy. The study's findings highlight the importance of various components of governance, as an increase in government effectiveness, law and order, and corruption control can lead to a decrease in human pressure on China's ecological resources, which is the world's second-highest-populated country. Additionally, the inclusion of renewable energy usage in the context of good governance plays a crucial role in formulating a policy framework that aims to reduce China's ecological footprint.”
Future studies in this domain can advance this body of knowledge in the following ways: The rapid advent of artificial intelligence has increased the use of energy required by these platforms. However, these AI technologies are also helping to find creative ways to reduce emissions and ecological footprint. Therefore, it would be interesting to see the net effect of AI on ecological footprints. Besides, it would be interesting to contrast and compare different governance systems adopted by advanced and emerging economies to promote clean energy technologies and the effectiveness of such policies in curtailing carbon emissions.

