

Introduction
The West Liao River Basin serves as a critical ecological barrier, underpinning regional economic development and influencing the ecological security of the Yellow River, Haihe River basin, and Beijing-Tianjin-Hebei region. Located upstream of the Liao River, it traverses the Horqin Sandy Land, playing a vital role in combating desertification in the Horqin and Hunshandak sandy land. The basin includes remediated and unremediated areas, such as the Horqin Desert, Naiman, and Jarud mining region, with ongoing illegal forest and grassland occupation challenges. In 2023, water quality in sections like Erdaohezi and Dawafang declined to below ClassV [1], with significant wastewater discharge violations. In response, the Chinese Ministry of Ecology and Environment issued the “Implementation Opinions on Accelerating the Establishment of a Modern Ecological Environment Monitoring System” [2] in March 2024, emphasizing the need for advanced technologies, such as artificial intelligence, to enhance environmental quality prediction and risk monitoring.
The concept of “ecological security”, first recognized in 1987 amid rising environmental pressures, highlights the critical importance of ecological security [3-5] and the need for accurate early warning systems to predict potential short- and long-term risks from natural and anthropogenic hazards [6, 7]. Early warning systems hinge on prediction, which can be driven by mathematical methods (e.g., fuzzy mathematics [8, 9], rough set [10], and gray system theory [11]) or by artificial intelligence techniques (e.g., random forest [12], ARIMA [13], RNN [14-17], and transformers [18, 19]). Transformer-based models have demonstrated remarkable accuracy in time-series forecasting, including precipitation [20- 23], PM2.5 [24, 25], temperature [26, 27], gross primary productivity [28], gross domestic product [29] and evapotranspiration predictions [30, 31].
At present, there is little research on prediction and ecological security early warning, especially focusing solely on river basins. The neural network-based approach dates back to 1999. Shao etc. [32] studied ecological early warning of the arid inland river basin, using artificial neural networks to predict green equivalent areas as an early warning index to analyze the ecological environment from 2000 to 2020. In 2013, Li et al. [33] proposed a multi-model approach by integrating cellular automata (CA) and artificial neural networks (ANN) to predict the warnings of illegal development for 2015, 2020, and 2025, respectively. The integrated model is calibrated using empirical information from remote sensing and handheld global positioning systems. In 2017, Chen et al. [34] introduced a PSR-based land ecological security early warning index system, which used an RBF neural network to predict the ecological security index from 2013 to 2017. In 2022, Zou etc. [35] constructed a cultivated ecological security assessment index system based on the PSR model and utilized random forest (RF) and multilayer perceptron (MLP) models to predict evaluation indices from 2019 to 2028 in order to calculate warning results. In 2023, Wang etc. [36] studied coastal wetland ecosystems in the eastern Fujian province employing DPSIR and BP-ANN models. They evaluated the potential ecological hazard posed by invasion through an early warning indicator system, exhibiting a graded distribution pattern ranging from significant risk in the central inland urban areas to progressively lower risk in neighboring regions. Also, in 2023, the work [37] constructed a new ecological security early warning integrated system by the Bayesian network and DPSIRM (Driver-Pressure-State-Impact-Response-Management) model. Then they set up a comprehensive index to assess the early warning system in the East Liao River Basin, China, from 2000- 2020.
Few countries outside of China have published studies on ecological security assessment and early warning systems, with the majority of the research concentrated in developing countries like Iran and India. This focus is likely due to the heightened ecological pressures these nations experience, which drives government and research priorities toward assessing ecological security. In 2018, Bahraminejad et al. [38] utilized the PSR model to develop an early warning system for the Darmiyan protected area, analyzing key indicators – such as a thirty-year precipitation average, vegetation cover, and soil brightness—with a 95% confidence level for each. In India, Das et al. [39] applied the PSR model to West Bengal’s wetlands (2013–2020), highlighting population density, urbanization, and road density degradation. Similarly, Subhasis et al. [40] employed the PSR model and the Analytical Hierarchy Process (AHP) to examine the Malda district's wetlands at the block level, revealing a slight health decline from 2011 to 2018. Further, in 2022, Sadeghi et al. [41] evaluated Shiraz City’s Darwazeh Qur'an Watershed using the PSR framework to examine check dam impacts on flood mitigation. The finding indicated minimal effects, with health indices of 0.55 (with dams) and 0.53 (without dams). Recently, Chamani et al. [42] assessed the ecological security of subwatersheds in the Sharghonj Watershed. Using 20 PSR-based indicators, they found significant impacts from flood-related variables, with health indices ranging from 0.53 to 0.83 and ecological security indices from 0.27 to 1.01.
However, current research on the West Liao River Basin is limited, often overlooking ecosystem complexity and lacking in-depth analysis of multi-scale obstacle factors. Existing early warning methods also suffer from low accuracy in time-series predictions, failing to fully explore complex patterns like seasonality and multi-scale correlations. In response to the above issues, we developed an ecological security (ES) model for the West Liao River Basin based on the PSR framework, incorporating meteorological, remote sensing, soil, topographic, and socio-economic data. We identified key obstacle factors at various scales and utilized transformer-based AI technology for time-series prediction. This integrated approach aims to enhance intelligent monitoring and prevention measures for ecological security, offering a comprehensive data preprocessing, assessment, prediction, and early warning system.
Materials and Methods
Overview of the Study Area
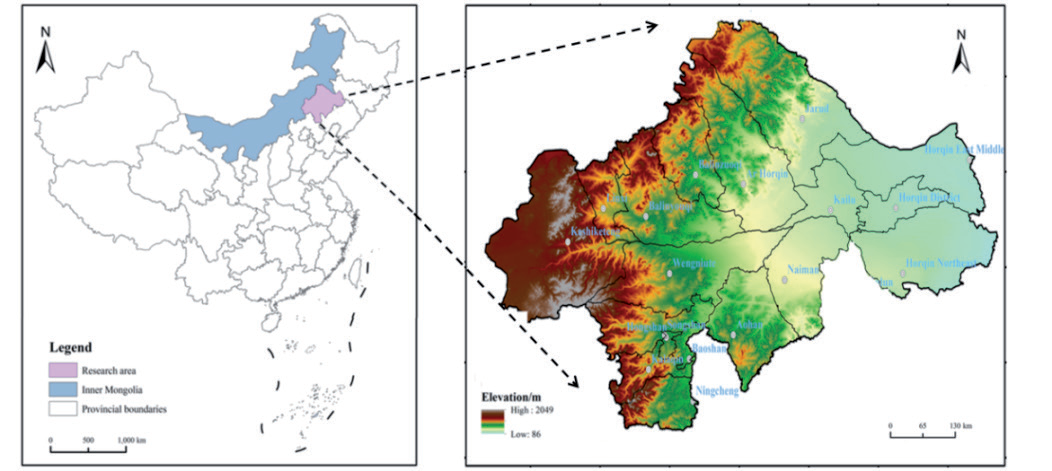
The West Liao River, a tributary of the Liao River, is located in the northern part of Liaoning Province and the southeastern part of the Inner Mongolia Autonomous Region in China. This river is a typical ecotone area for agriculture and animal husbandry, as illustrated in Fig. 1. The region is situated in a semi-arid area, belonging to the grassland, sandy, agricultural, and pastoral ecological zone. This study focuses on 18 counties and cities in this region. The annual mean temperature increased from northwest to southeast, and the average annual precipitation was 381 mm. The per capita water resources are 851 m3, indicating a typical water shortage and ecologically fragile area.
Data Sources
Our research utilizes a multi-source dataset, detailed in Table 1. Meteorological data, including temperature and precipitation, were obtained from the National Meteorological Science Data Center covering the period from January 1, 2010, to December 31, 2021 [43]. The NDVI (normalized vegetation index) data were sourced from the NDVI sequence data of remote sensing products fused by the Moderate Resolution Imaging Spectroradiometer (MODI13A3) of NASA [44]. Topographic data were selected from the Geospatial Data Cloud 30 m resolution DEM dataset. Soil data were acquired from the Cold and Arid Regions Science Data Center of the Chinese Academy of Sciences [45]. Socioeconomic data were obtained from the statistical yearbooks of Chifeng, Tongliao, and the Inner Mongolia Autonomous Region.
Ecological Security Evaluation System
The PSR model is utilized to construct a risk assessment system for ES in the study area. The components of pressure, state, and response are intricately interconnected, exerting mutual influence and constraint on each other. Among them, the pressure indicators reflect the causes and potential impacts of ecological problems, focusing mainly on the impact of human activities on the ecosystem. State indicators imply changes in the natural environmental conditions caused by human activities and assess the status and resilience of the ecosystem. Response indicators reflect the ability and actions of humans or nature to overcome ecological and environmental problems. The ESI system is constructed as shown in Table 1.
Data Processing
Different indicators possess distinct units and dimensions, making it impossible to compare them within a single system. Therefore, all the units and dimensions in the system should be removed, and the data should be standardized so that all the data is between [0,1] [34]. The data standardization formulas are shown below.
Table 1.
Ecological security index of the study area.
Where Xij and Xij are the initial and normalized values of the jth indicator in the ith evaluation unit(year), respectively.
Index Weights Calculation
In our paper, we used an objective method called the entropy method to calculate weights, which is mainly based on the index data itself. The entropy method is adopted to determine the weight of the indicator by constructing a judgment matrix. This matrix can reflect the hidden information in the data, enhance the discrepancies and differences among various indicators, and avoid analysis difficulties and other drawbacks caused by slight differences between selected indicators. The specific steps are as follows:
1. Standardization of data:
Where Xij is the attribute value of the jth indicator in the ith evaluation unit.
2. Calculation of information entropy Hj for each indicator:
Where Hj is the entropy value of the jth indicator, n represents the number of evaluation units, and it is assumed that if Pij = 0, then Pij ln Pij = 0.
3. Calculation of weight Wj of each indicator:
Where m represents the number of evaluation indicators.
Ecological Security Evaluation
The comprehensive index method is used to obtain the ESI, or early warning index, of the evaluation object through weighted summation of the index data to complete the quantitative evaluation. The expression of this method is as follows:
Where Pij is the normalization of the jth indicator data in the ith evaluation unit, Wj is the weight coefficient of the jth ecological security indicator, and n is the total number of indicators.
Ecological Security Standards
Due to different study areas, large differences in selected indicators, and complex index systems, the range of the ecological security index calculated by traditional methods cannot effectively reflect the internal differences in the West Liao River Basin. Therefore, the nature break method reclassifies the ESI and adjusts the results. The natural discontinuity method reduces the intra-class differences and maximizes the inter-class differences, better reflecting the internal differences in ES. The ESL is demonstrated in Table 2. The values for different stages of the warning system were determined by calculating ΔESI (changes of ESI) between adjacent years and grading ESI, as shown in Table 3.
Prediction Method of Ecological Security Index
Given a chronologically ordered sequence with a length of L,
Multi-Dimensional Information Extraction
Seasonal Information Extraction
The Fourier transform model was utilized for seasonal trend information extraction 0. Fs is calculated as follows:
Where
Evolutionary Information Extraction
Considering its simplicity and low computational resources, we use a linear transformation model to capture evolutionary information. The calculation formula is as follows:
Where Wt is learnable weight parameters, and bi is a learnable bias term.
Multi-Scale Information Extraction
The multi-scale correlation information between variables is extracted according to the following formula:
Where xi and xj represent two different variables,
Table 3.
Classification of ecological security early warning (ESEW) in the study area.
Fig. 2.
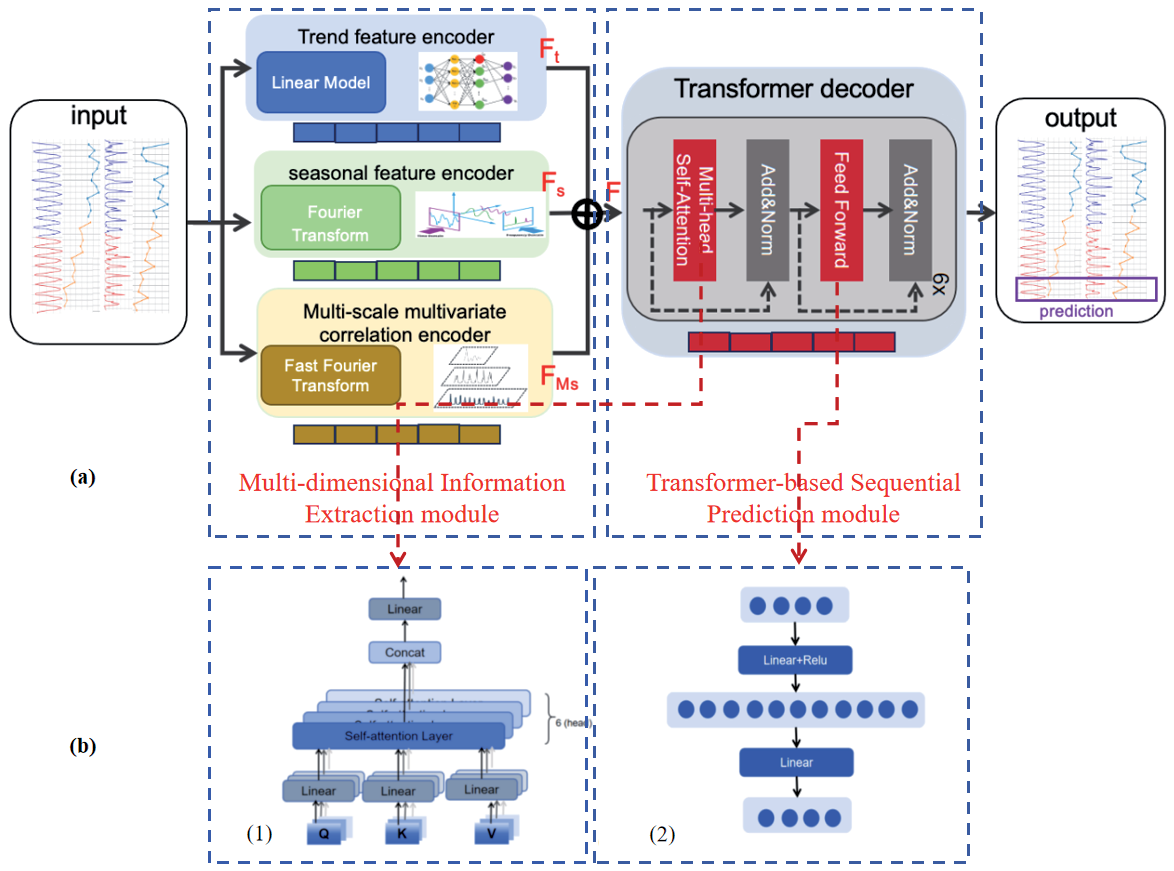
(a) The overall framework of the prediction model. (b) The detailed part of the transformer decoder includes: (1) The structure of the multi-head self-attention mechanism. (2) The structure of the FFN.
Then, extracting multi-scale information, it is calculated as follows:
(11)
Where
Transformer-Based Sequential Prediction
The prediction part of this model mainly used the decoder module of the transformer [46], which includes six identical modules, each of which mainly contains the Multi-Head Self-Attention mechanism and Feed-Forward Network(FFN) [47, 48] parts, as shown in Fig. 2(b).
Results
Evaluation Metrics and Compared Methods
The experiments were conducted in a Python environment with the deep learning framework PyTorch 1.12.1; the hardware environment Intel(R) Core(TM) i9 CPU 5.8 GHZ; memory 24 GB; and GPU NVIDIA GeForce RTX 4090. The batch size was set to 32, the learning rate was set to 1e-4 and between 1e-2, the sliding window of the sequence was set to 96, the prediction length was set to 96, the number of training rounds was set to 10, the early stopping mechanism was used and its parameter was set to 3, and the optimizer used was the ADAM optimizer. In this paper, four SOTA time series data prediction methods, namely Informer [49], LightTS [50], Dlinear [51], and TimesNet [52], are compared to demonstrate the effectiveness of our proposed model. In order to verify the accuracy of the model, mean square error (MSE) and mean absolute error (MAE) are used as evaluation metrics. The smaller value of MSE and MAE indicates the more accurate prediction, which is defined as:
Ecological Safety Results and Analysis
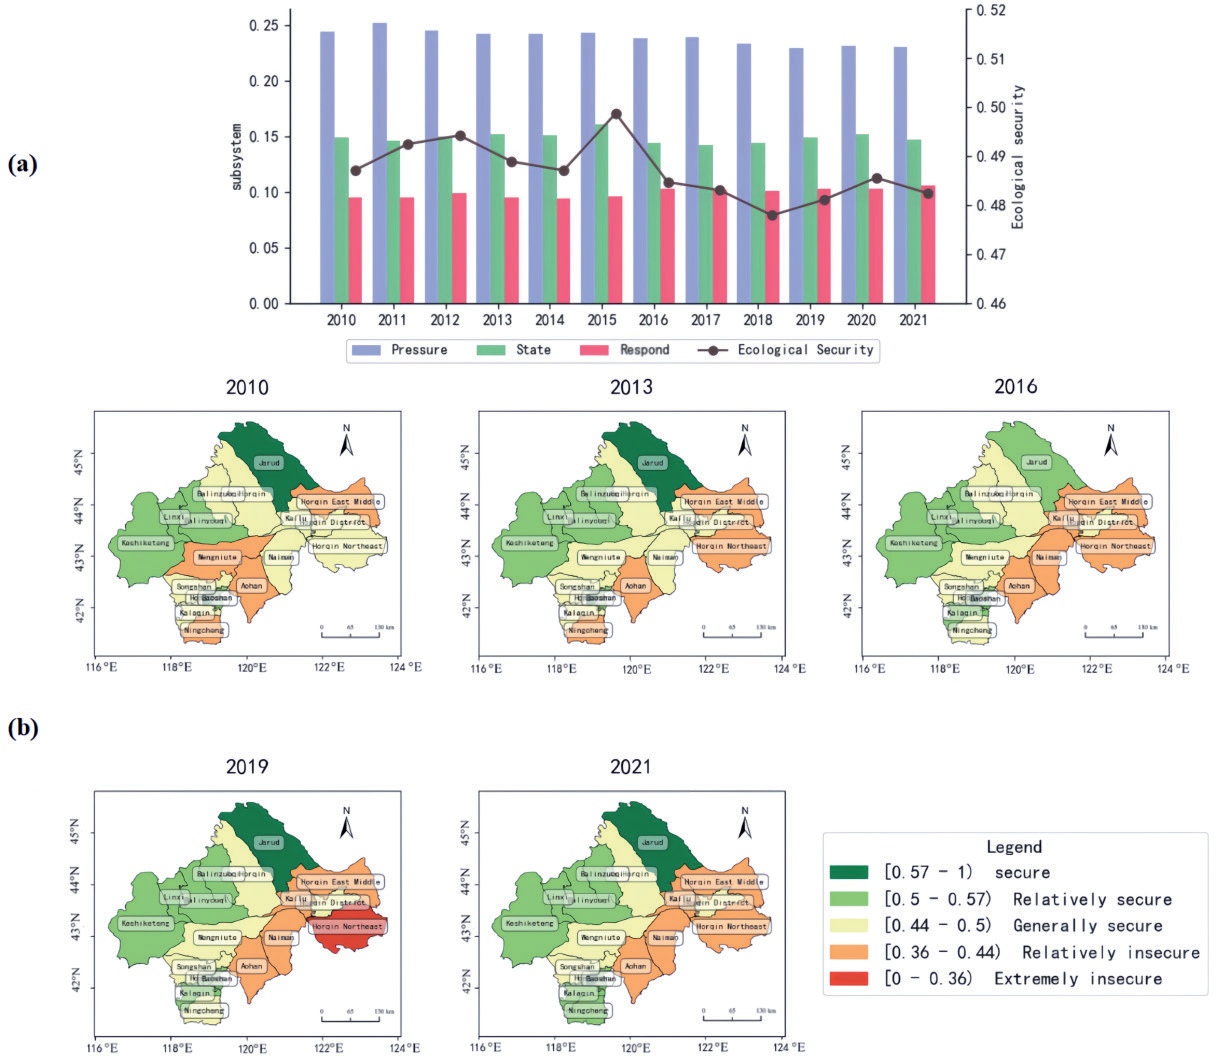
From the temporal scale, according to the classification of ES (Table 2), the comprehensive index method was used to calculate ES indexes of the West Liao River region from 2010 to 2021. As depicted in Fig. 3(a), the ESI fluctuated within the “Generally secure” range, showing a decreasing trend (“up-down-up-down-up”), that is, likely a W-shaped curve, with the range between 0.478 and 0.499. The pressure, response, and state layer index slightly decreased, increased, and hovered, respectively.
Fig. 4.
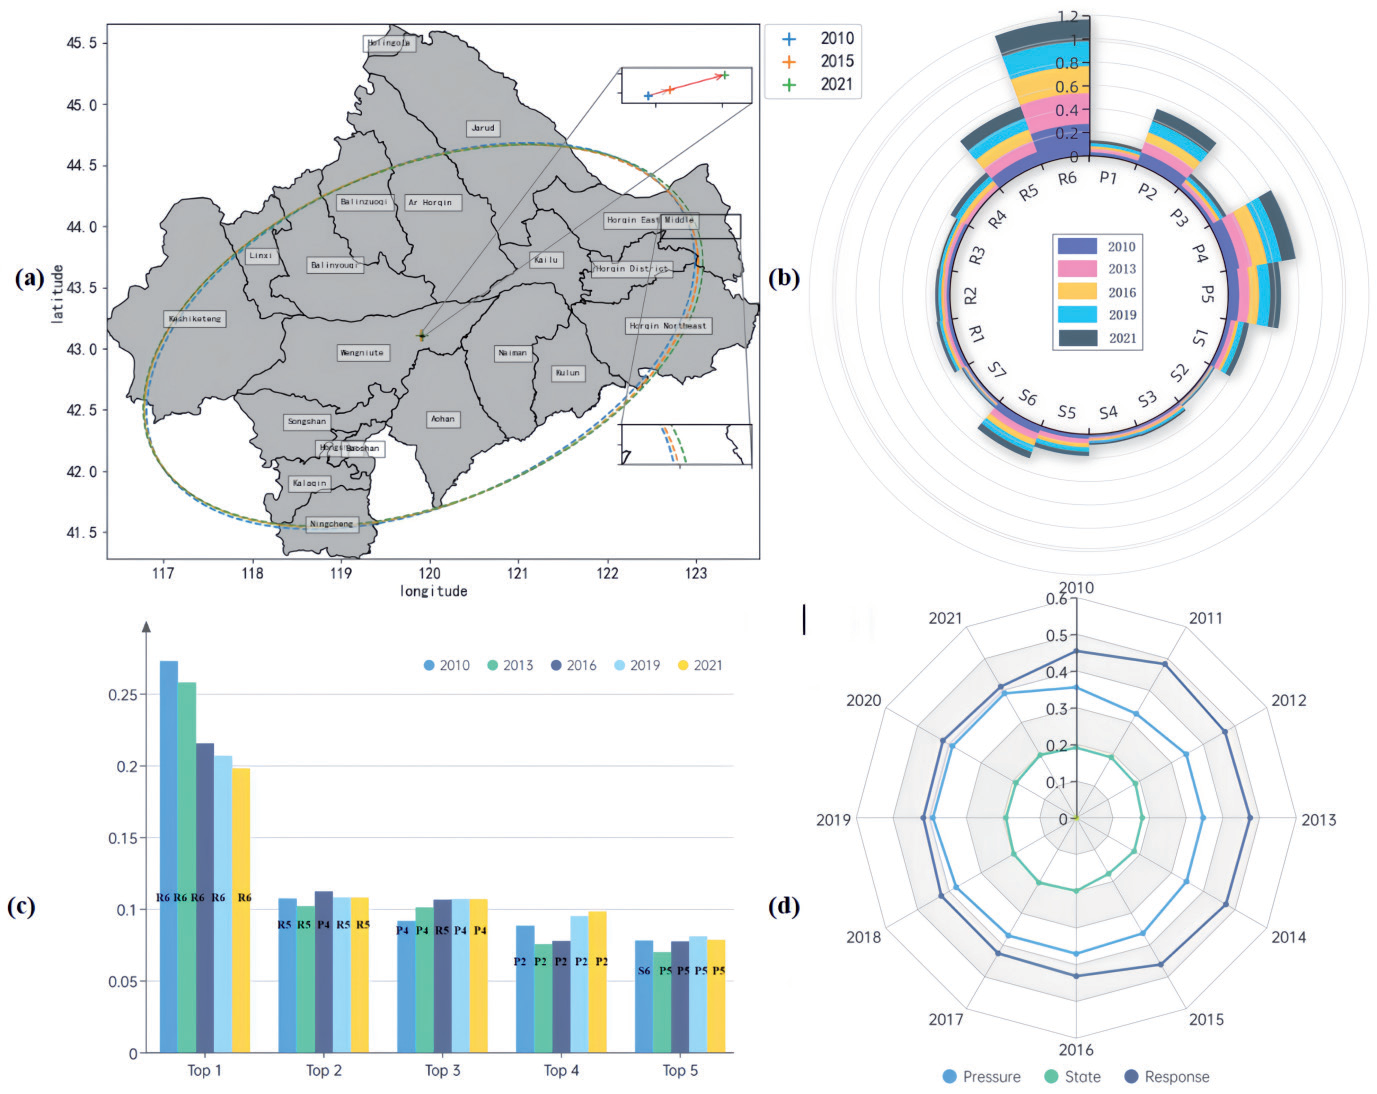
(a) Results of standard deviation ellipse and gravity center shift from 2010 to 2021. (b) The distribution of obstacle degrees in the index layer in 2010, 2013, 2016, 2019, and 2021. (c) Top five obstacles in 2010, 2013, 2016, 2019, 2021. (d) The variation of obstacle degrees of criterion layers.
The pressure layer, which declined by 0.014, is mainly due to the growth of total chemical fertilizer, the power of agricultural machinery, and the proportion of cultivated land to land area. The slight growth of the response layer, which grew by 0.012, is primarily due to the growth of the proportion of the non-agricultural population and effective irrigated area. The state layer fluctuated between 0.142 and 0.16. It denotes that the security status and resilience of the ecosystem fluctuate, meaning that pollution and destruction still exist, and protection and supervision need to be strengthened.
In terms of spatial scale, as illustrated in Fig. 3(b), it can be seen that the ES of the northwest area was generally better than the southeast in the township scale of the West Liao River Basin from 2010 to 2021. The “Relatively insecure” area was mainly concentrated in the southern margin of the Horqin desert, including the Horqin East Middle Banner and Horqin Northeast Banner. Furthermore, it is one of the areas with severe desertification and a fragile ecological environment in China. Recently, with the continuous advancement of sand control projects, the ecological environment has continued to improve, but the ecological problem still needs strengthening.
In 2010, 2013, 2016, 2019, and 2021, county-level ecological security was mostly concentrated between “Relatively secure” and “Relatively insecure”. Among them, Jarud and Hongshan were at or near “Secure”, while Aohan, Horqin East Middle, and Horqin Northeast were stable at “Relatively insecure”. Kailu and Naiman declined from “Generally secure” to “Relatively insecure” in 2016.
As Fig. 4(a) shows, the moving scope of the gravity center was mainly concentrated in the Wengniute Banner. The gravity center shifted from southwest to northeast, pointing to the degradation direction, and the opposite direction meant ecological improvement. The total moving distance was 2.39 km, and the average annual speed was 1.2 km per year. The standard deviation ellipse [53] presented a slightly southeast-moving trend and continued to expand to the south along the main axis.
Table 4.
Top five obstacle degrees of indicators at the township scale.
Fig. 5.
The actual and predicted precipitation of TimesNet (a), LightTS (b), Informer (c), Dlinear (d), and Ours (e) models.
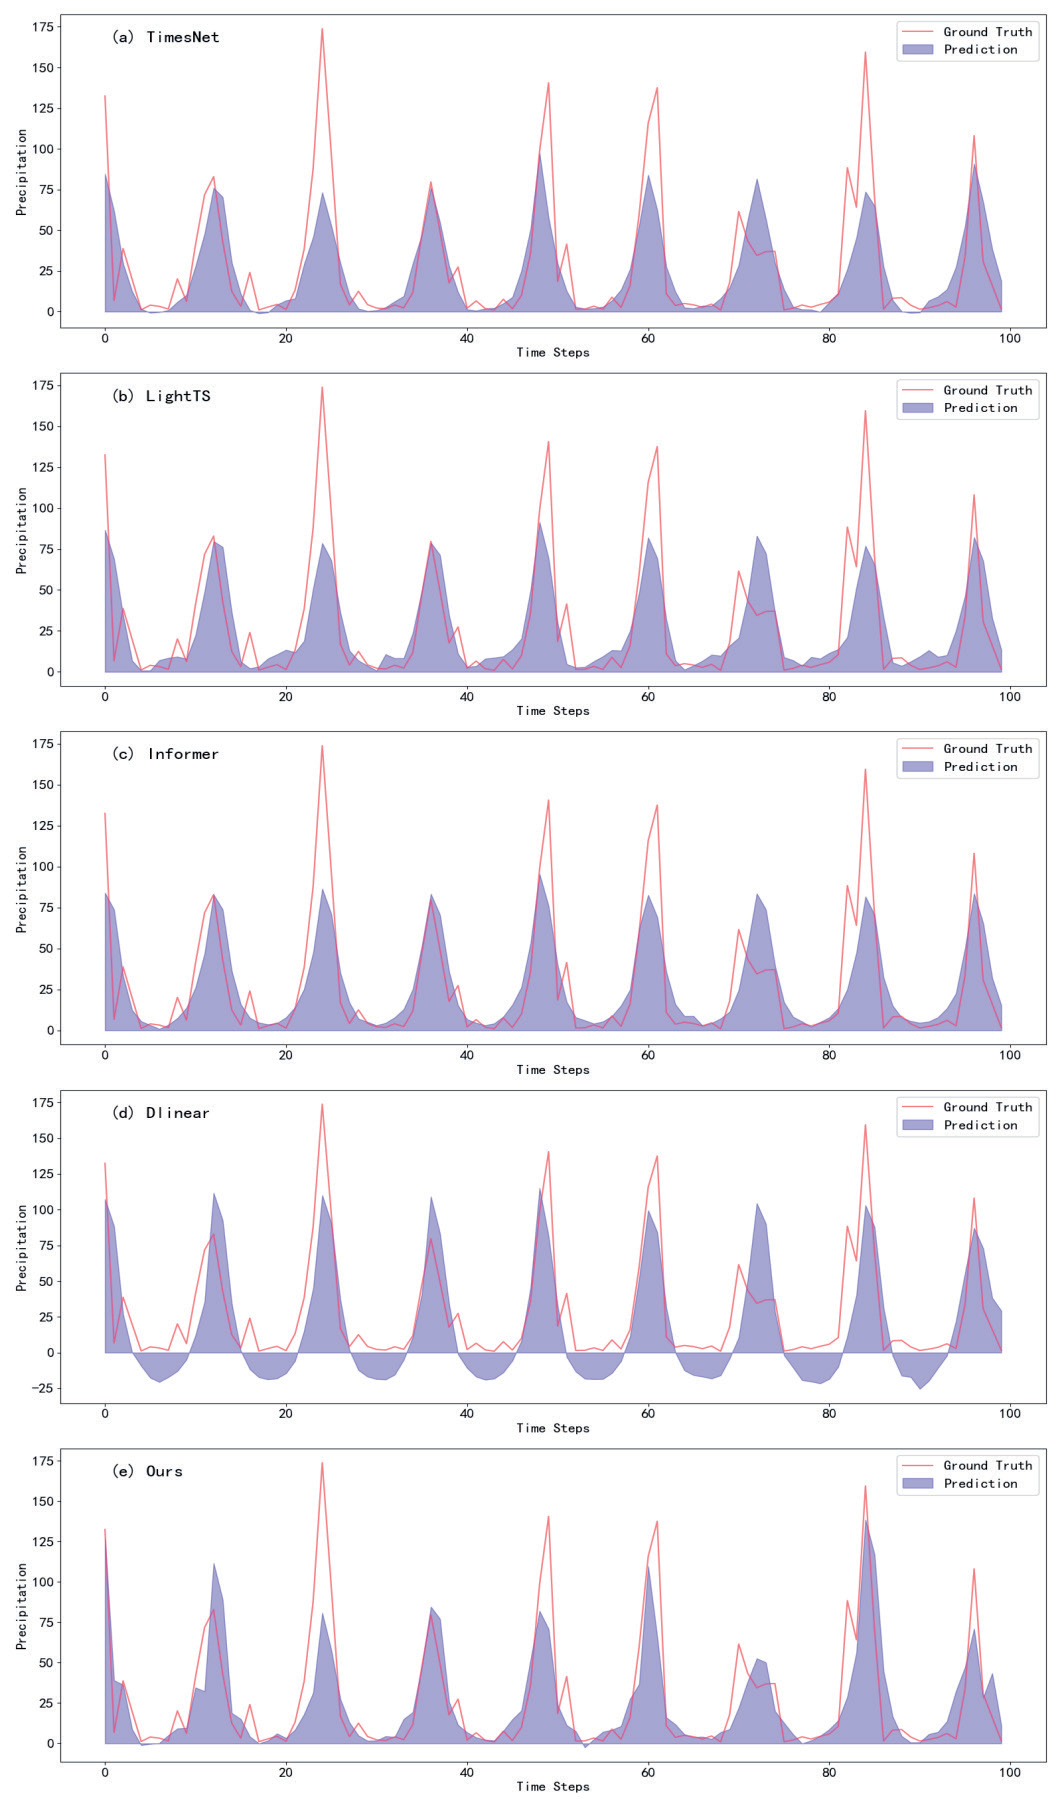
Table 5.
Comparison of TimesNet, LightTS, Informer, Dlinear, and Ours model performance.
| Model | Informer [49] | TimesNet [52] | Dlinear [51] | LightTS [50] | Ours |
|---|---|---|---|---|---|
| MAE | 0.3513 | 0.3731 | 0.3863 | 0.3818 | 0.3409 |
| MSE | 0.5126 | 0.5535 | 0.5672 | 0.5514 | 0.4721 |
Fig. 6.
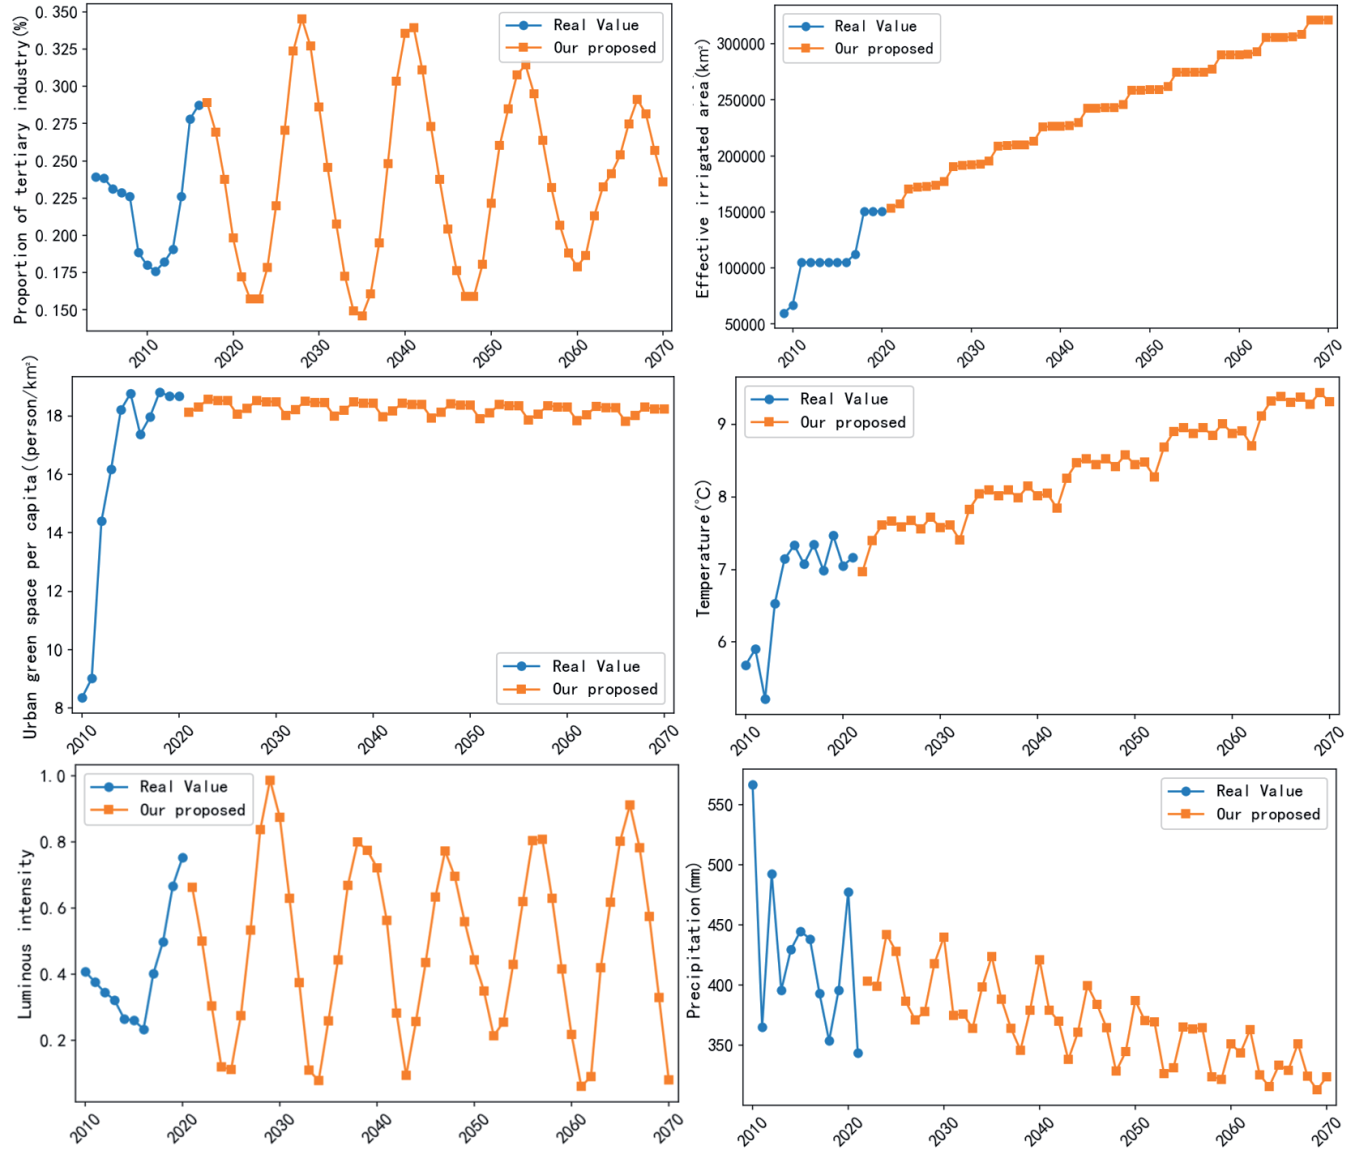
Actual data was depicted in a blue line, while the predicted values of yearly data from 2022 to 2070 are shown in an orange line.
On the whole, the main obstacles affecting ecological security in 2010, 2013, 2016, 2019, and 2021 were illustrated in Fig. 4(b). The top five obstacles were the proportion of the non-agricultural population (R6), power of agricultural machinery (P4), effective irrigated area (R5), GDP per capita (P2), and proportion of cultivated land to land area (P5). Then, we calculated the obstacle degrees [54] in the PSR layer, as shown in Fig. 4(d). The obstacle values of the response layer have consistently illustrated a downward trajectory over the years; on the contrary, there was an upward trend in the obstacles of the pressure layer, and these two obstacles grew gradually closer to each other. The obstacle degrees of the state layer were relatively stable, around 0.2.
Fig. 4(c) exhibited the main obstacles in five distinct years. Among them, the proportion of the non-agricultural population emerged as the primary obstacle factor for all five provinces. Effective irrigated area and agricultural machinery power ranked second and third in 2010, 2013, 2016, 2019, and 2021, but these two indicators swapped positions in 2016. GDP per capita was in fourth position. After 2010, PM2.5 concentration was replaced by the proportion of cultivated land to land area in the fifth place.
Table 4 presented the top 5 ranks of obstacle factors on the township scale in 2010, 2016, and 2021. In general, the proportion of the non-agricultural population accounted for 83.3% of all counties ranked in 1st position, the proportion of the effective irrigated area took up 11.1%, and the rest was the proportion of cultivated land to land area. In the second position, the number of impacting factors increased to include the power of agricultural machinery (40.7%), effective irrigated area (38.9%), GDP per capita (5.6%), population density (5.6%), proportion of cultivated land to land area (3.7%), PM2.5 concentration (3.7%), and proportion of non-agricultural population (1.9%).
Prediction Results and Analysis
Our proposed model predicted the future indicators from 2022 to 2070. We took precipitation as an example to illustrate the prediction process. The input dataset of our model was the time-series precipitation of the West Liao River Basin collected from the observatory establishment to December 2021. We divided the dataset into the training, testing, and validation sets, with a ratio of 8:1:1 to train the proposed model. The comparison results with the current SOTA models are depicted in Fig. 5, which shows the comparison between the predicted values of different models and the real values. From the table, we can observe that our model is better than other methods, and the quantitative results are shown in Table 5. In particular, the MAE values of our model were 1.04%, 4.09%, 3.22%, and 4.54% higher than those of Informer, LightTS, TimesNet, and Dlinear, respectively.
Fig. 6 displays part of the county-level yearly data collected from the statistical yearbooks and forecasted bvy the proposed method. Actual yearly data is depicted in a blue line, while predicted values of yearly data from 2022 to 2070 are shown in an orange line.
Early Warning and Analysis
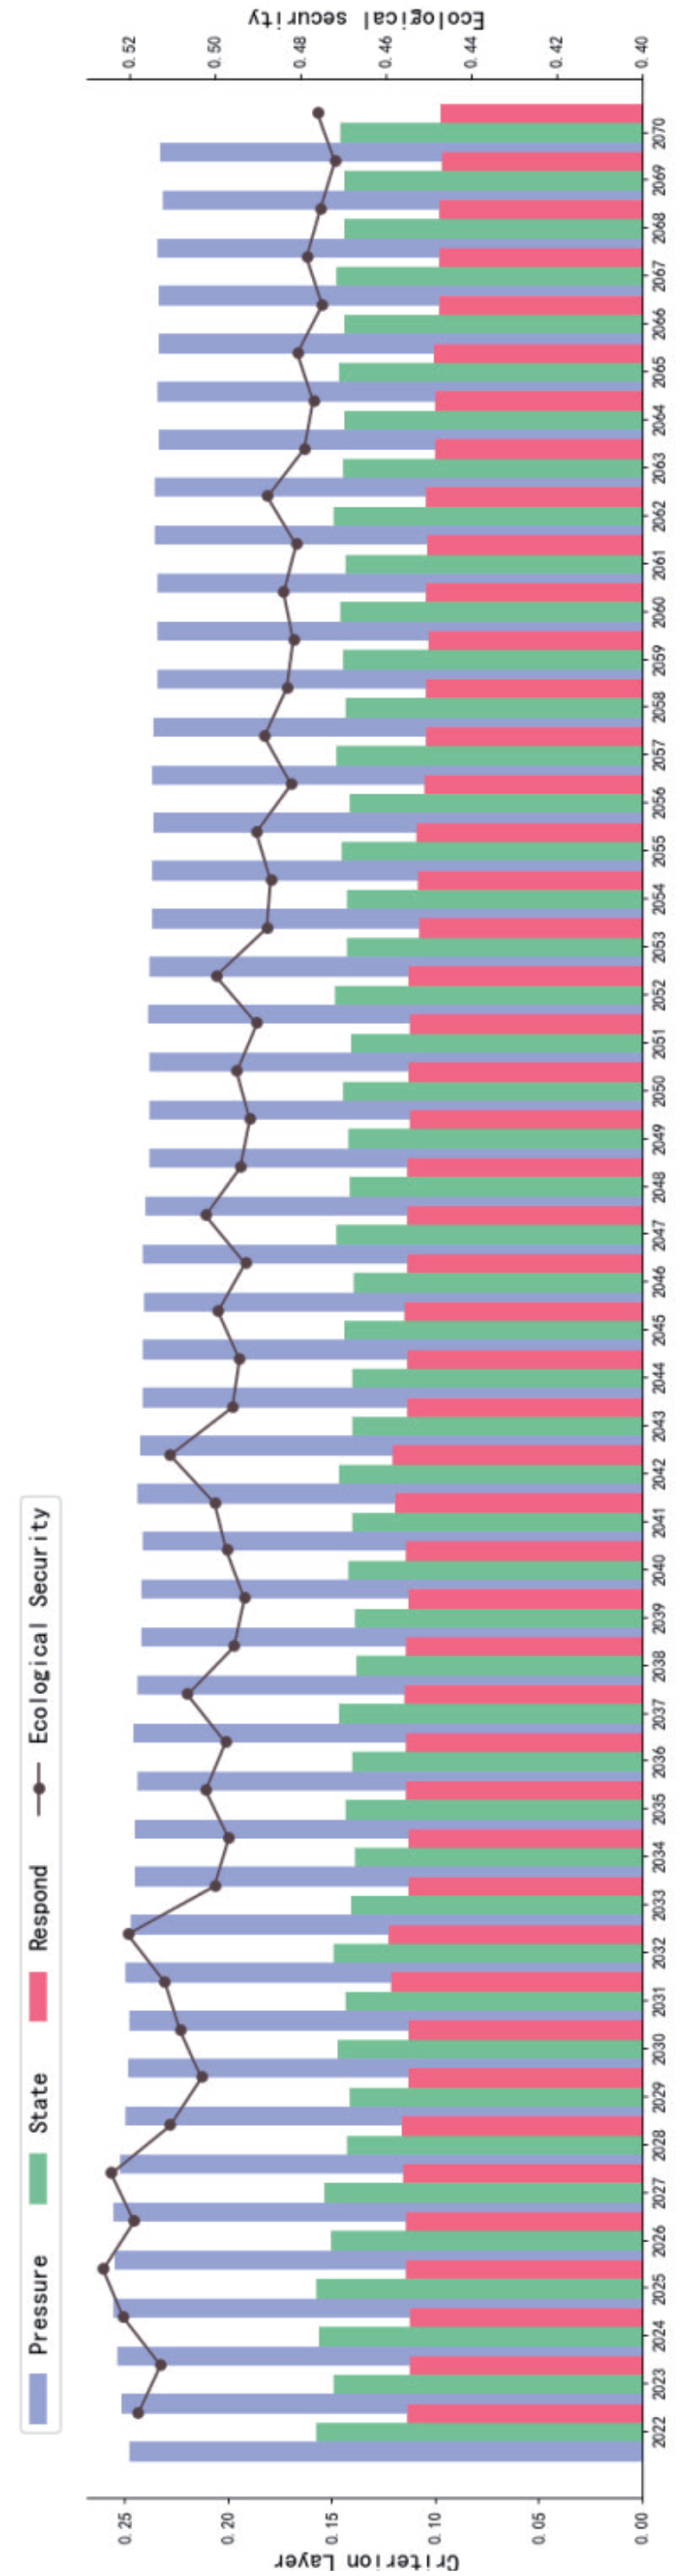
The proposed algorithm was used to predict the data of time series indicators from 2022 to 2070. We calculated the composite index value of these 48 years and then conducted early warning based on the index that has been obtained. According to the classification of ecological security, the comprehensive method was used to calculate the variation of future ES in the West Liao region from 2022 to 2070. As depicted in Fig. 7, the security index declined with fluctuation between 0.526 and 0.472, transferring from “Relatively secure” to “Generally secure”. The pressure and response layer index decreased, while the state layer undulated with an increasing trend.
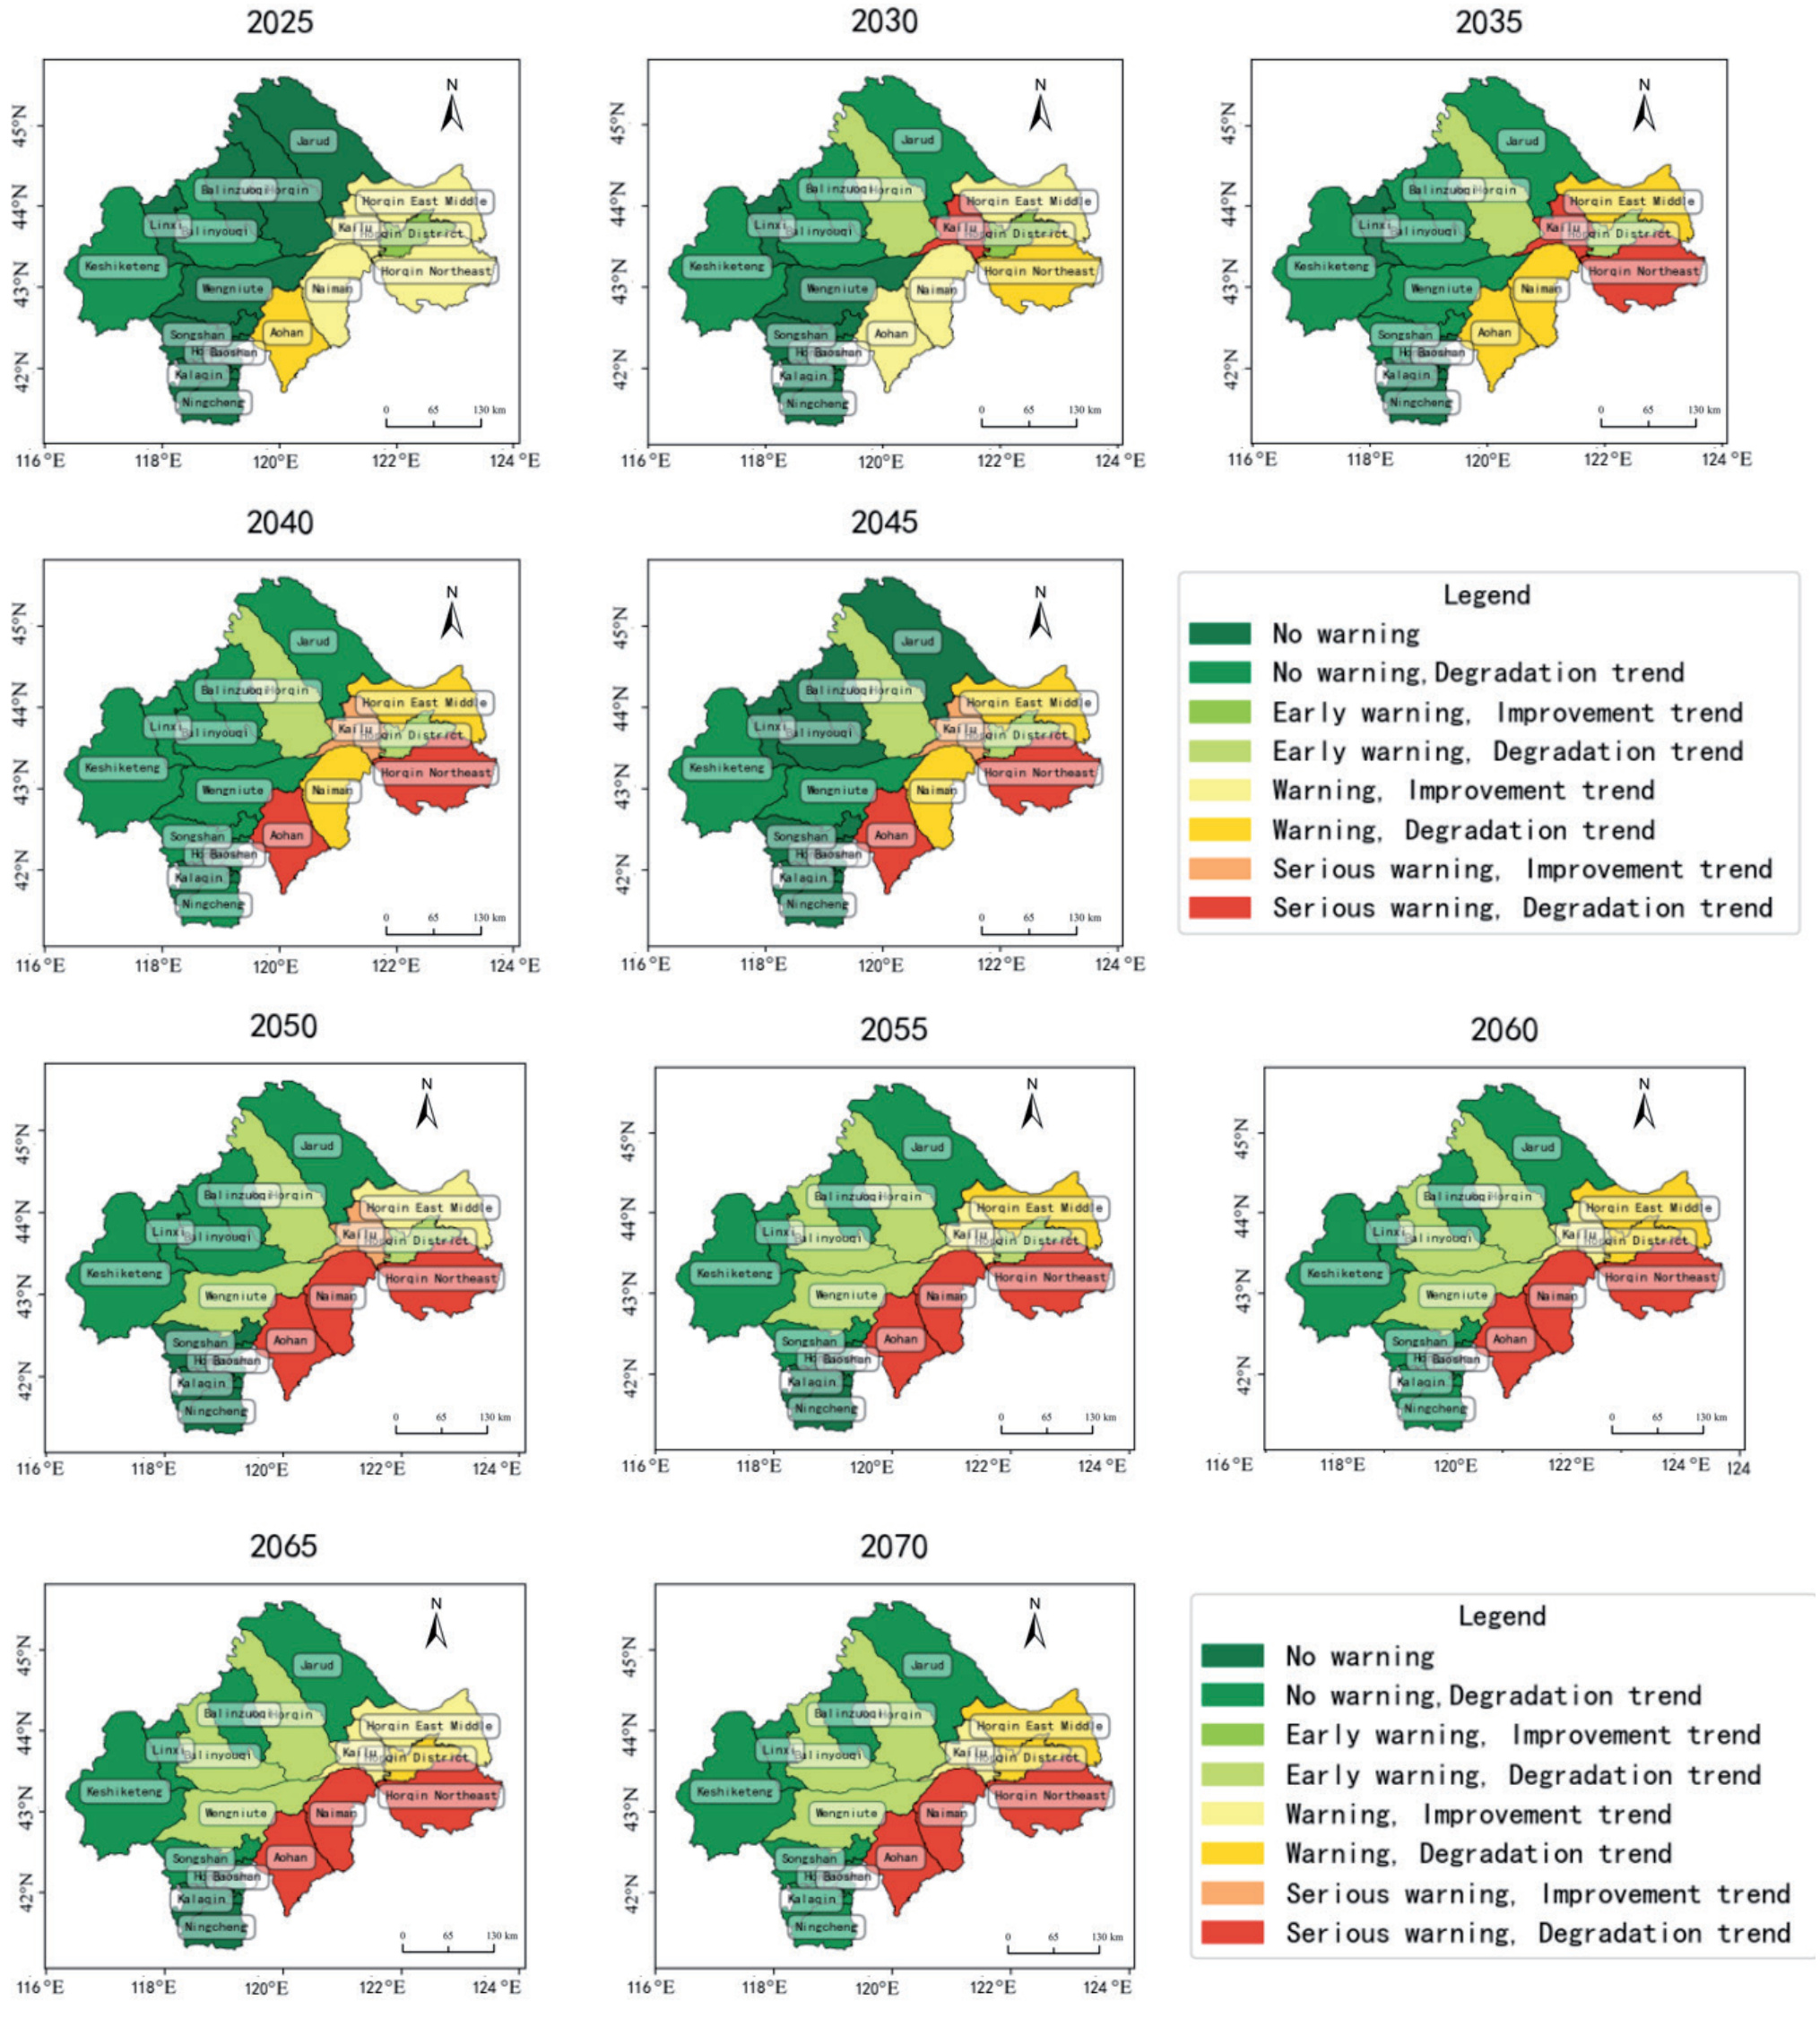
In terms of spatial scale, Fig. 8 shows that the early warning level of the western area is still better than the southeast township scale of the West Liao River Basin from 2025 to 2070. The “No warning” area decreases from 2025 to 2070; the middle region transforms from “No warning” into “Early warning” with a degradation trend, while “Serious warning” expands, concentrated in the southern margin of the Horqin desert. In terms of the ecological security assessment results from 2010 to 2021, it can be seen that the ecological environment in the southeast is fragile and will continue to deteriorate, as shown in Fig. 8, if there is no strengthened pollution control.
Discussion of Results
Main Findings
This paper overcomes the limitations of unitary social statistical data by utilizing comprehensive datasets, including meteorological, remote sensing, soil, terrain, and socioeconomic data, to evaluate ecological security based on a comprehensive ecological security index (ESI). In terms of index construction, a scientific index evaluation system is essential for ecological security evaluation. This study references previous works [55, 56] and selects 18 indicators to build a “pressure-state-response”(PSR) model, combined with the entropy method and hierarchical analysis process, to determine the weight of each indicator. The ESI for each assessment unit is determined using the comprehensive index method. As illustrated in Fig. 4, from 2010 to 2021, the ecological security index fluctuated within the “Generally secure” category, showing a slight declining trend with a range between 0.478 and 0.499.
Most studies on the West Liao River Basin have been conducted at a macro scale. Considering that counties are the basic units for policy-making, we analyzed the ecological security level at the county level, providing operational suggestions for improving the ES of the river basin. Our research indicates that the ecological security level in the northwest is higher than in the southeast, with pastoral areas generally having a higher ESI than agricultural areas. Due to increased population density, the proportion of cultivated land, agricultural and animal husbandry machinery power, and total chemical fertilizer usage, ecological issues in agricultural areas remain serious, necessitating stronger ecological supervision and increased awareness of green agriculture.
Previous research often used regression equations or qualitative surveys [57] to explain ES. This paper uses the obstacle degree model to determine the impact degree and identify the main obstacles to ES in the West Liao River Basin. The main obstacles identified are the proportion of the non-agricultural population (R6), power of agricultural machinery(P4), effective irrigated area(R5), GDP per capita (P2), and proportion of cultivated land to total land area (P5).
Implications and Limitations
The present study, while insightful, has certain limitations. Firstly, no authoritative quantitative standard for classifying ES and early warning levels may lead to inconsistent research results. Establishing scientific and authoritative classification standards is necessary. Secondly, although the proposed prediction method based on transformers is slightly better than current time series prediction algorithms in artificial intelligence, further improvement is needed to enhance prediction accuracy. Thirdly, this paper conducts ES and early warning at the county scale, which cannot detail the security status of different regions within a county. Finally, the regional ES situation is complex and dynamic, influenced by multiple factors. Future research should gradually improve the evaluation index system and develop a scientific, stable, and universal ES prediction and early warning mechanism using multi-source, detailed, and long-term serial index data.
Conclusions
The West Liao River Basin, located near the Beijing-Tianjin-Hebei Capital Economic Circle, has critical ecological importance. However, as part of the agro-pastoral Intertwined Zone, it faces unique vulnerabilities. Thus, assessing and forecasting ecological security in this region is essential for future ecological protection. This study employs a transformer-based AI model to predict 18 key ecological security indicators alongside a PSR model to assess, provide early warnings, and analyze obstacles to ecological security from 2010 to 2070.
Key Findings and Conclusions
Our transformer-based prediction model demonstrated superior performance, achieving Mean Absolute Error (MAE) reductions of 1.04%, 4.09%, 3.22%, and 4.54% compared to the Informer [49], LightTS [50], TimesNet [52], and Dlinear models [51], respectively. The Ecological Security Index (ESI) fluctuated within the "Generally Secure" range, showing a gradual decline from 0.499 in 2022 to 0.472 by 2070, with the most significant deterioration in southeastern and central areas. Key obstacle factors identified include the non-agricultural population proportion, agricultural machinery power, effective irrigated area, GDP per capita, and cultivated land proportion.
Actual data from 2010 to 2021 shows that the ES of the northwestern counties is better than the southeast. This is because the southeastern region, particularly the agricultural agglomeration area near the Horqin Desert, has a more fragile ecosystem. The results of obstacle factor analysis indicate that the top five factors are related to agriculture and population, with the proportion of the non-agricultural population as the top rank. In southeastern counties like Horqin East Middle, Horqin District, Kailu, and Naiman Banner, the non-agricultural population decreases with the agricultural population increasing. This shift has led to more people relying on the same agricultural land, resulting in higher agricultural machinery usage and fertilizer consumption, exacerbating ecological damage. If no policies are taken, the ecology in the Southeast will continue to deteriorate from 2025 to 2070, with the warning level rising from “warning” to “serious warning”, and the central region will shift from “no warning” to “early warning”.
Novelties
Our method focuses on the comprehensive extraction of seasonal patterns, trends, and intra- and inter-variable relationships of the long time series dataset instead of considering only unilateral features [49- 52]. With the development of Large Scale Models, AI models will become more convenient, enabling point-by-point predictions for each indicator, and yielding more accurate results than traditional methods while consuming less manpower and resources.
Recommendations for Sustainable Management
Enhance agricultural ecological protection: We recommend promoting sustainable, technology-driven agriculture by government and related agencies. This includes enhancing food production, optimizing irrigation, and improving the use of fertilizers and agricultural machinery. Implementing soil testing and tailored fertilization for different crops will reduce the use of chemical fertilizers and pesticides. Organic fertilizers should be encouraged to improve soil health, increasing water retention and fertility.
Broaden employment opportunities: Expanding job training and skill development programs for agricultural workers can reduce dependency on farming, enhance rural livelihoods, and alleviate pressure on the land.
Integrate environmental, population, and economic planning: Policymakers should prioritize ecological conservation while supporting economic and population growth. This includes raising public awareness, investing in water management, and fostering agricultural innovation. Additionally, real-time monitoring and early warning systems are essential for timely responses to ecological changes.

