

Introduction
The total area of the black soil region in Northeast China is about 1.03 million square kilometers [1]. This is the main commodity grain base in China. Due to the thinness of the black soil layer and fertile soil, people always use the phrase "one pound of soil is equivalent to two pounds of oil" to describe its fertility and preciousness [2].
The main heavy metal pollutants in soil include Hg, Cd, Pb, Cu, Cr, As, Ni, Zn, etc. In terms of the needs of plants and human health [3], metal elements can be divided into two categories: one is elements that are not needed for plant growth and development but pose significant harm to human health, such as Hg, Cd, Pb, etc. Another type is the elements required for normal plant growth and development, which have certain physiological functions for the human body, such as Cu, Zn, etc. However, excessive amounts can cause pollution and hinder plant growth and development [4]. Heimann et al. conducted a study on the current distribution of pollutants in agricultural soils in suburban Beijing. The pollutants in the soil include the elements required for plant growth and development, as well as elements not required for plant growth and development, and proposed prevention and control suggestions [5].
Ecological risk refers to the potential impact of uncertain accidents or disasters within a certain area on the ecosystem and its components, which may damage the ecosystem’s structure and function, thereby endangering its safety and health [6]. Olatundea et al. conducted an ecological risk assessment on the distribution of heavy metals in the soil around a large cement plant in Nigeria. They found pollution and potential ecological risks of cadmium, chromium, nickel, and lead in the soil of the study area. The research results provide valuable information on the heavy metal pollution status of the soil around the cement plant and propose a thorough reform of the waste management process of the plant and strengthening the regulatory activities of relevant institutions [7].
Heavy metals in soil mainly enter the human body through the "soil-crop-human" or "soil-crop-animal-human" food chain system [8-10], posing a threat to health. The accumulation of heavy metal pollutants such as chromium, arsenic, mercury, cadmium, lead, copper, nickel, and zinc in the soil can cause varying degrees of harm to human health [11]. Ali et al. conducted an assessment of heavy metal pollution and human health risks in soil from solid waste dumping sites in Saudi Arabia. They found that Co, Ni, Pb, Cu, Cr, Mn, and Zn pollution is severe. Co, Ni, and Zn pose an acceptable risk of cancer, while Cr has a cancer risk level in children and adults [12]. Awoke et al. studied the health risks of heavy metals in vegetables grown on soil irrigated with untreated and treated wastewater in Ethiopia. They found that the lead and cadmium values of vegetables irrigated with wastewater were greater than 1, which may lead to short-term/lifelong exposure to non-carcinogenic diseases in adults and children. Growing vegetables with treated wastewater is safer than growing vegetables with untreated wastewater [13]. Mirzai et al. evaluated the ecological and health risks of heavy metals in long-term fertilized vineyard soil and grapes in Iran and concluded that there is no noncarcinogenic risk of heavy metals in soil for adults and children, while some heavy metals have carcinogenic risks. In order to ensure food chain safety, it is necessary to raise awareness of the standard dosage of fertilizers and pesticides and strengthen the monitoring of heavy metal pollutants [14].
With China’s highly developed industry, agriculture, and science and technology [15], the ecological and health risks of heavy metals in soil have received significant attention from relevant departments such as natural resources, agriculture, and environmental protection. It is particularly important to scientifically prevent and control heavy metal pollution, identify the current situation of heavy metal pollution, and evaluate the ecological and health risks of heavy metal pollution. This work is the scientific basis for pollution prevention and risk avoidance.
Regional Overview
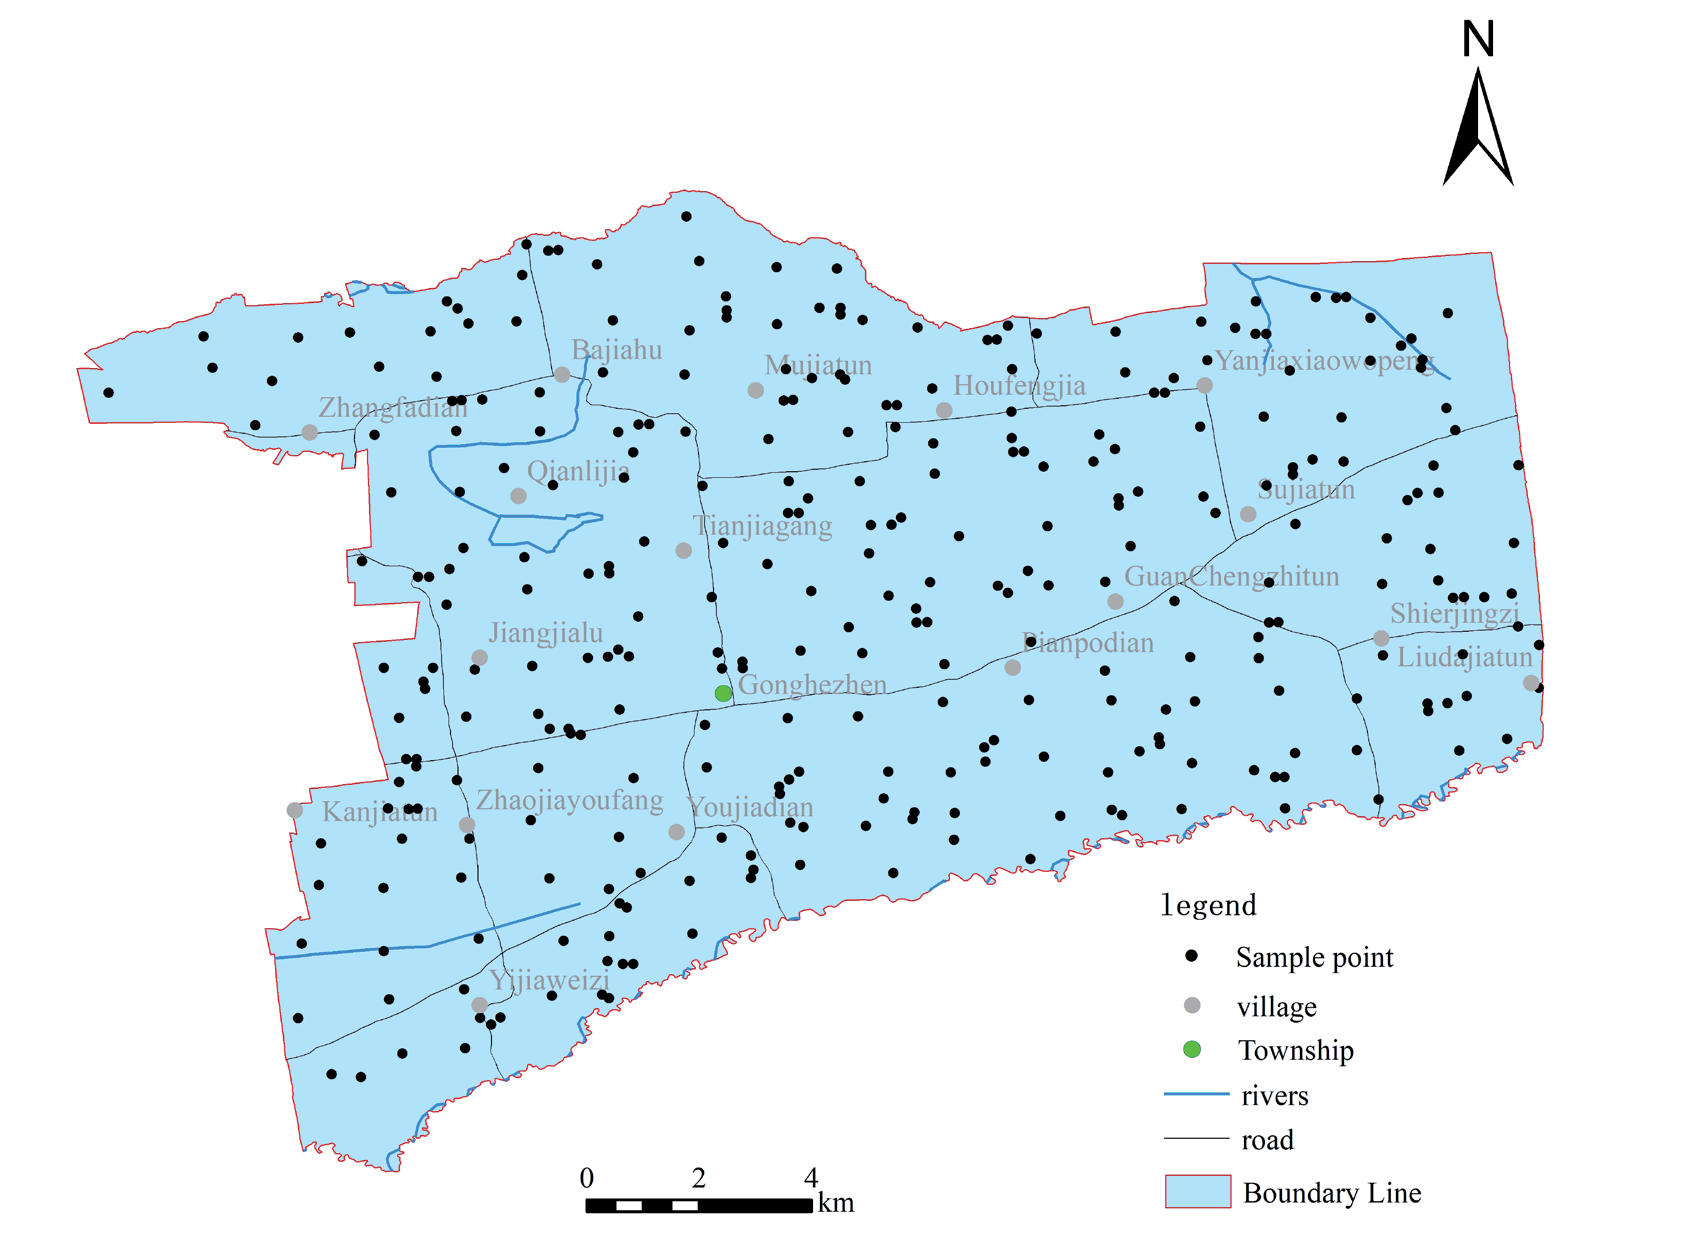
Gonghe Town is located in the western part of Hailun City, Suihua City, Heilongjiang Province. It is adjacent to Qianjin Town to the east, facing Haixing Town and Xiangfu Town across the Hailun River to the south, bordering Lianfa Town to the west and Yonghe Township to the north. The town government is located in Fuda Fangzi Tun, Gongxiang Village. The area is 174.16 square kilometers (2018). Gonghe Town is located in a plain area, with a terrain high in the east and low in the west. The terrain is gentle, and the slopes from east to west mainly consist of plain landforms. The northeast is wider and gradually narrows towards the west, forming a triangular shape. The lithology of the strata mainly consists of Quaternary silty clay and loess-like silty clay from the Upper Barren Mountain Formation. The highest peak within the territory is located in Gaojiatun, Communist Youth League Village, in the northeast, with an altitude of 192 meters; the lowest point is located in Dingjiaweizi, Yufuzhong Village, in the southwest, with an altitude of 102 meters. Gonghe Town belongs to the cold temperate monsoon climate, with cold and dry winters and warm and humid summers. The Helen River flows through the southern end of Gonghe Town and belongs to the Tongken River system. From northeast to southwest, it flows through Yongjun Village, Zhujin Village, and Fuzhong Village within the territory, with a length of 28.5 kilometers and a drainage area of 49.8 square kilometers. Most of its soil types are black soil, with good water and nutrient conditions and high potential fertility. Gonghe Town is regarded as a core production area for commodity grains, with main grain crops including corn, soybeans, and rice, as well as economic crops including mushrooms, melons, and vegetables. Animal husbandry mainly focuses on raising pigs, cows, and sheep. To study the situation and risks of heavy metal pollution in the soil of Gonghe Town, based on the sufficient collection of geological, soil, land use, industrial production, agricultural production, and other relevant information in the study area, 316 soil sample collection points were deployed in the surface farmland soil, according to the needs of soil heavy metal research (Fig. 1).
Evaluation Method
The assessment of soil heavy metal pollution adopts the Geoaccumulation Index (Igeo) method proposed by German scientist Müller (1979) [16], the Ecological Risk Assessment adopts the Potential Ecological Hazard Index (RI) method proposed by Swedish scientist Hakanson [17], and the Health Risk Assessment adopts the Health Risk Assessment Model (BHRA) recommended by the United States Environmental Protection Agency (USEPA, 2011) [18]. Based on the above model methods and combined with the actual risk of soil heavy metal pollution in China, calculation models are constructed separately. The relevant calculation formulas are shown in Table 1, and the meanings of each symbol are shown in Table 2. The symbol meanings and parameters in the heavy metal health risk exposure formula are shown in Table 3 [19, 20], the reference measurement and carcinogenic slope factor of different exposure pathways are shown in Table 4 [21, 22], and the pollution level classification comparison table is shown in Table 5. The hazard classification comparison table is shown in Table 6.
Explanation: The toxicity coefficients (T ir ) of certain heavy metals Zn, Cr, Cu, Ni, Pb, As, Cd, and Hg are 1, 2, 5, 5, 10, 30, and 40, respectively. The background matrix correction factor (k) is set to 1.5; HQ or HQi<1 indicates that the non-carcinogenic risk of heavy metals can be ignored; otherwise, there is a non-carcinogenic risk. 10-6~10-4 is an acceptable range for the Cancer Health Risk Index (CR or CRi).
Results and Discussion
Distribution and Variation Characteristics of Heavy Metals in Soil
It can be seen from the characteristics of heavy metal content in the surface soil of the study area (Table 7) that the average values of the eight heavy metal contents in 2021 are higher than their background values, indicating that the heavy metals in the study area have accumulated in the soil to a certain extent. Among them, Zn has the highest accumulation degree, with content between 51.66 and 106.81 mg/kg, with an average of 66.12 mg/kg. The order of accumulation size of each element is Zn > Cr > Ni > Pb > Cu > As > Cd > Hg; the increase factor of Cd is the largest, which is 1.56 times the soil background value in Gonghe Town; Cr, Zn, Hg, Ni, Pb, Cu, and As are 1.03-1.54 times higher than the soil background values in Gonghe Town. The order of increase for each element is Cd > Cr > Pb > Cu > Zn > As > Ni > Hg. Overall, Zn has the highest cumulative value with a moderate increase, while Cd has the highest increase multiple with a smaller cumulative value. From the perspective of the variability of heavy metal elements, the coefficient of variation ranges from 5% to 35%, and the distribution of each element is shown in Fig. 2.
Table 1.
Formulas for Pollution Assessment, Ecological Risk Assessment, and Health Risk Assessment.
Table 2.
The meanings of each symbol in the formula.
[i] Explanation: The toxicity coefficients (T ir ) of certain heavy metals Zn, Cr, Cu, Ni, Pb, As, Cd, and Hg are 1, 2, 5, 5, 10, 30, and 40, respectively. The background matrix correction factor (k) is set to 1.5; HQ or HQi<1 indicates that the non-carcinogenic risk of heavy metals can be ignored; otherwise, there is a non-carcinogenic risk. 10-6~10-4 is an acceptable range for the Cancer Health Risk Index (CR or CRi).
Table 3.
Meaning and Parameter Table of Heavy Metal Health Risk Exposure Symbols.
Table 4.
Reference calculated values and carcinogenic slope factors of different exposure routes of different heavy metals.
Table 5.
Igeo index and the criteria of pollution grade.
Table 6.
Indices used to assess the potential ecological risk status.
Table 7.
The characteristic value of heavy metal content in surface soil.
[i] Note: The background value of heavy metals in the surface soil of Gonghe Town is obtained from the Statistics of China Geochemical Survey data [23]; the coefficient of variation is dimensionless. Min- Minimum value, Max- Maximum value, Ave- Average value, Sd- Standard deviation, Cv- Coefficient of variation, Bg- Background value.
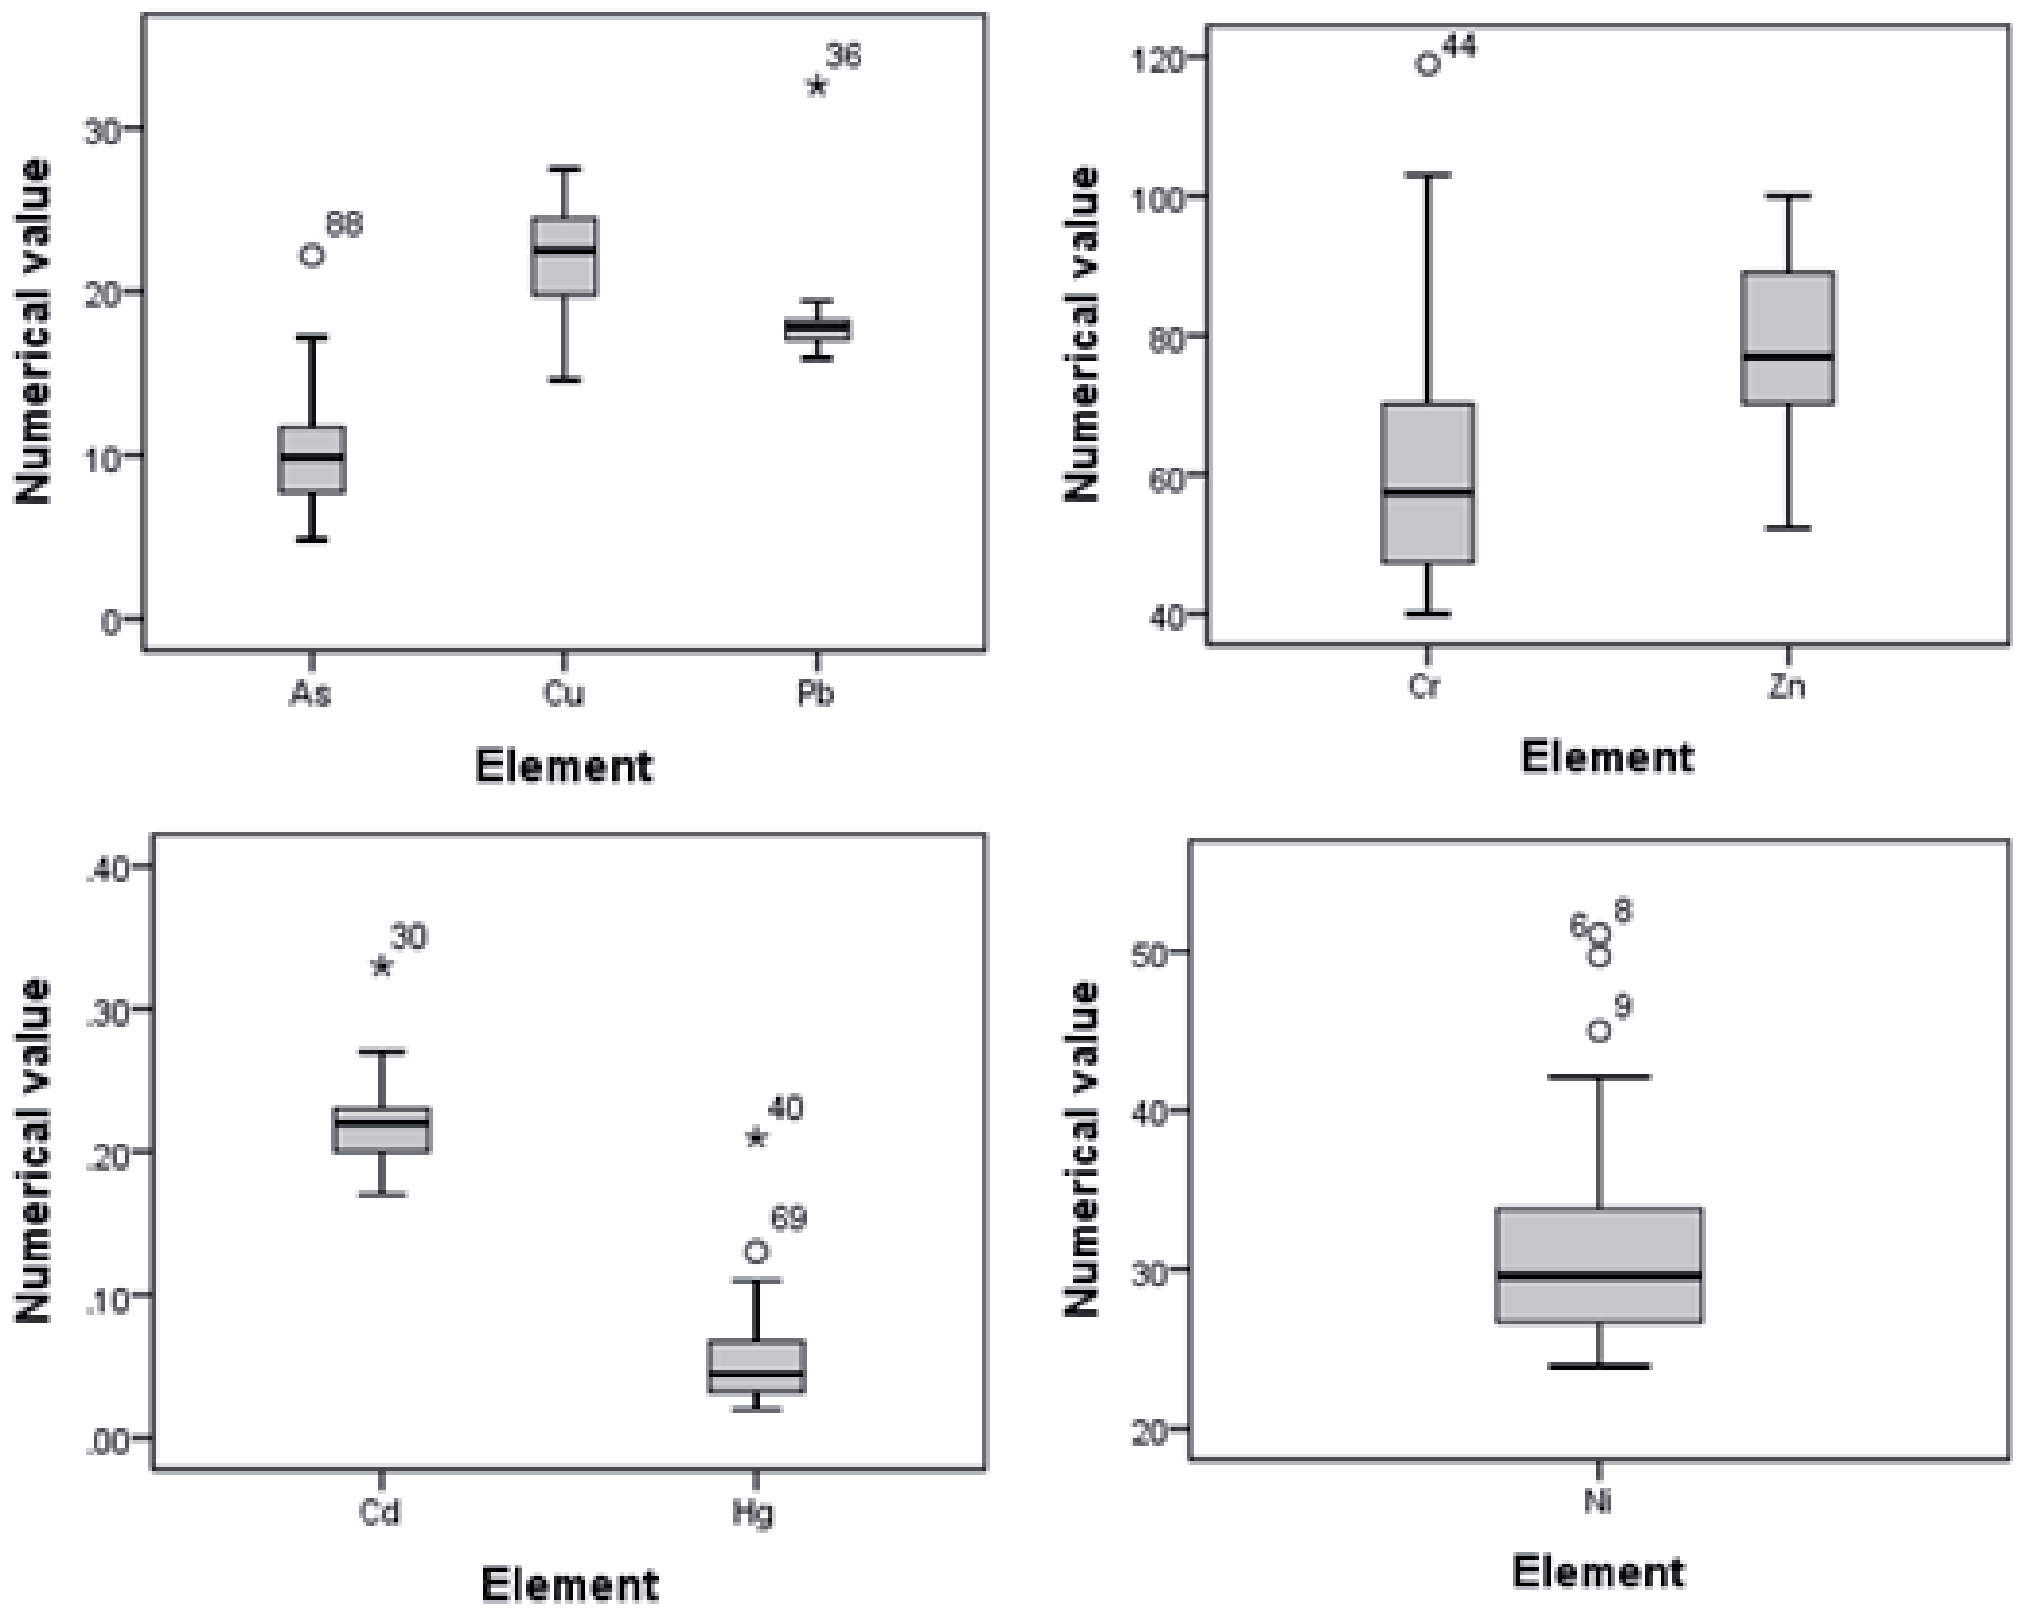
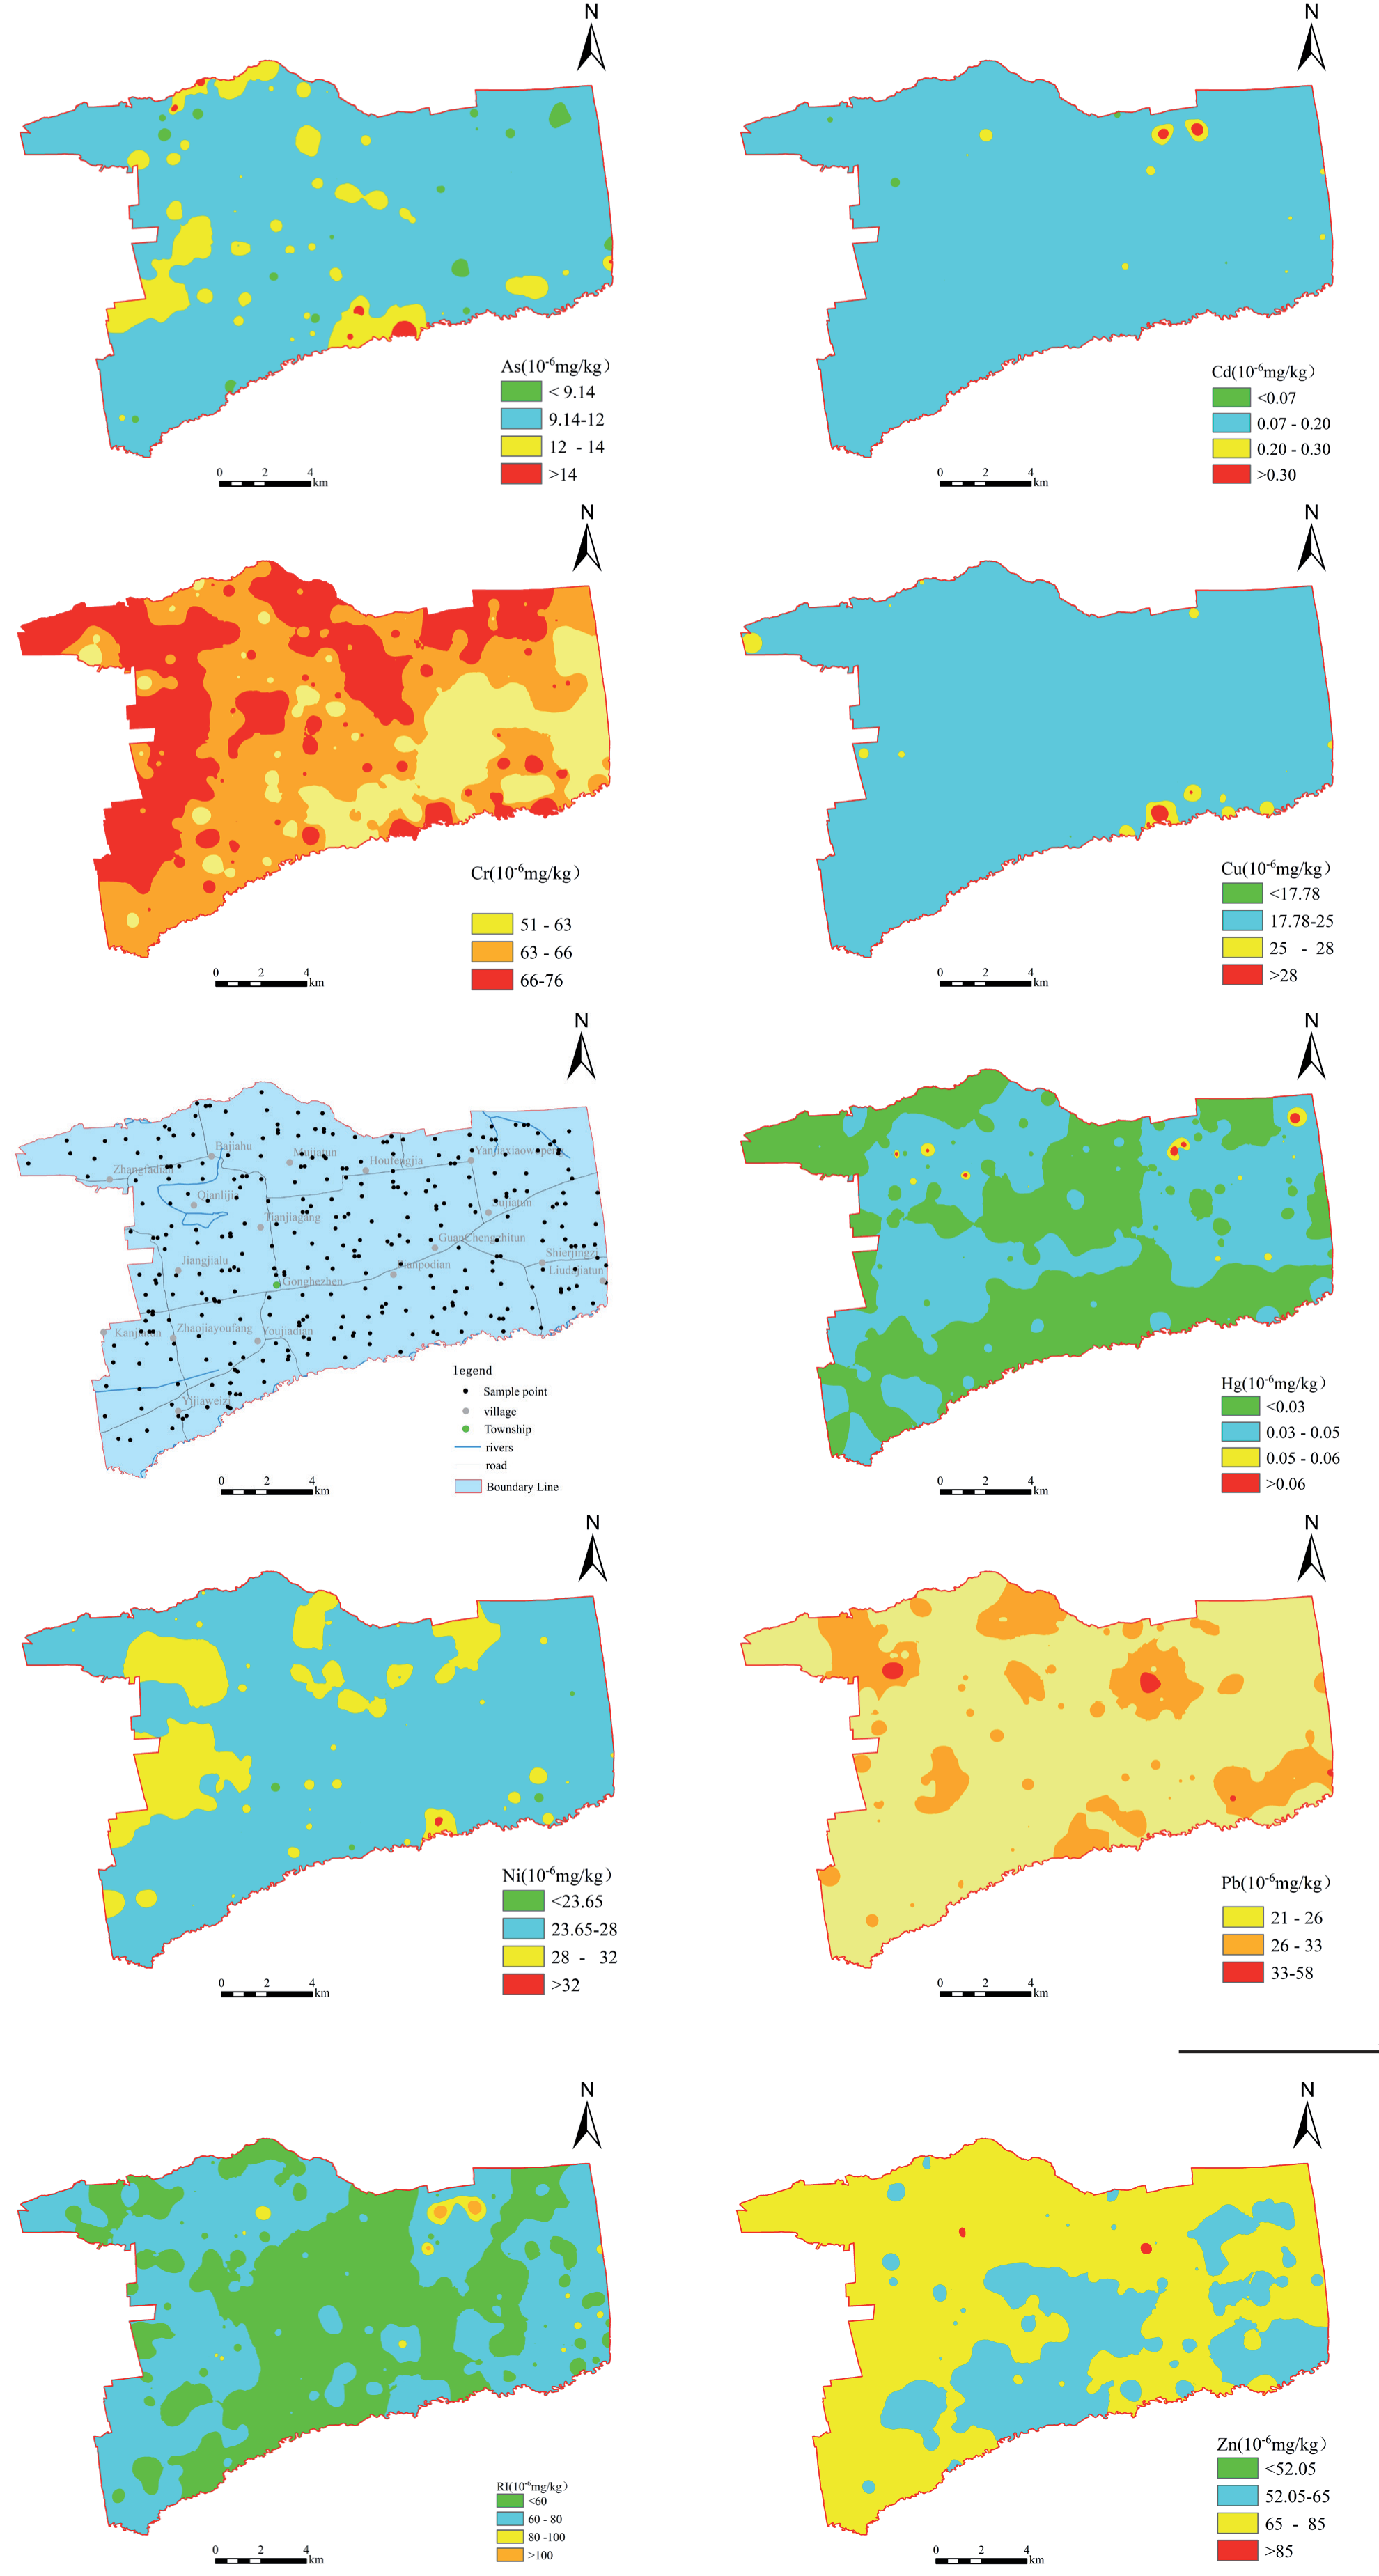
Table 8.
Classification of the heavy metal pollution index of surface soil.
From Fig. 2, it can be seen that the variability of Cd and Hg is significantly higher than that of other elements, with coefficients of variation reaching 35% and 30%, while the coefficients of variation of As and Pb are 13% and 11%, respectively. The variability of other elements is relatively small, with coefficients of variation ranging from 7% to 5%. To observe the distribution of each element and the location of high values in detail, element distribution maps of 8 different element contents were drawn (Fig. 3).
From Fig. 3, it can be seen that all sample data of Cr and Pb in the soil exceed the background values of the soil, while the values of Zn in the vast majority of samples exceed the background values to a large extent, and other heavy metals have varying degrees of exceedance. The high values of Cr are mainly distributed in the northwest of the study area, including Zhangfadian Village, Kanjiatun, Mujiatun, and Yanjia Xiaowopeng; the high-value points of Pb are scattered in the study area, mainly in Zhangfatun and the southern area of Houfengjia; the high-value points of Zn are mainly located in the northern part of the former Li family and the southeastern part of the later Feng family. Other high-value heavy metal points are distributed to varying degrees in the southeastern part of Youjiadian near the Hailun River, as well as in the Xiaowopeng area of Houfengjia and Yanjia.
Table 9.
Potential ecological hazard index of heavy metals in surface farmland soil.
Analysis of the Heavy Metal Pollution Degree
Analysis began by evaluating the cumulative index of heavy metal pollution in the soil of Gonghe Town (Table 8), and the order of the heavy metal pollution index from high to low in Gonghe Town is Pb>As>Cr>Zn>Ni>Cu>Cd>Hg. From the average pollution index, only Pb belongs to light pollution, and other heavy metals are not polluted. However, due to the different coefficients of variation of heavy metal elements, there are different pollution levels in different regions. Pb has 2 moderate pollutants, accounting for 0.63%, and 292 light pollutants, accounting for 92.41%; Cd has 2 moderate pollutants, accounting for 0.63%, and 11 light pollutants, accounting for 3.48%; As has 4 light pollutants, accounting for 1.27%, while other heavy metal elements show no pollution levels.
Potential Ecological Risk Assessment of Heavy Metals
According to the evaluation of the potential ecological risk level of soil in Gonghe Town (Table 9), from the perspective of potential ecological risk of single heavy metals, the Cd hazard index ranges from 13.12 to 109.68, with slight, moderate, and strong ecological risks. The main risk types are slight and moderate, with slight risk accounting for 95.25%, moderate risk accounting for 4.11%, and strong risk accounting for 0.63%. All other elements pose slight ecological risks, accounting for 100%. Overall, Cd is the main element causing ecological hazards in shallow soil.
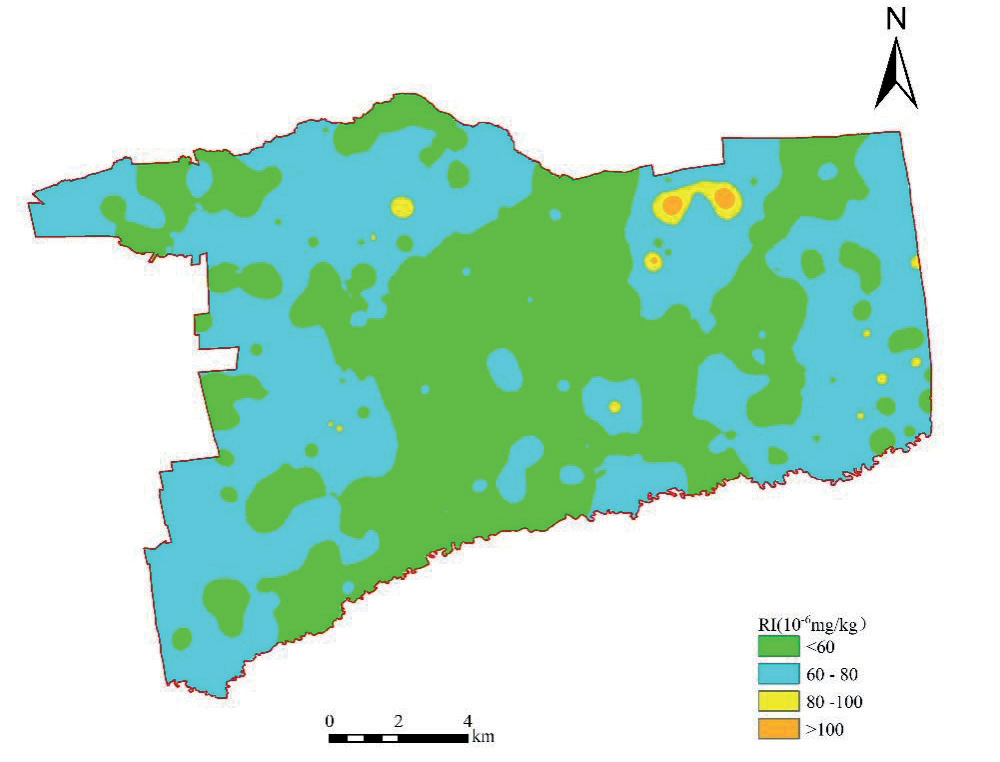
From the overall potential ecological index RI, the distribution range of the hazard index is 45.79~142.73, with the highest value of 142.73, less than 150. All heavy metal elements have slight ecological risks, accounting for 100%. Overall, the ecological risk in the study area is very low (Fig. 4).
Human Health Risk Assessment
Assessment of Heavy Metal Exposure
The results of the daily exposure assessment of soil heavy metals are shown in Tables 10 and 11. The order of non-carcinogenic and carcinogenic average daily exposure for oral intake, skin contact, and respiratory inhalation is as follows: ADDing>ADDderm>ADDinh, with oral intake being the main method and far higher than any other heavy metal intake. Children have higher average daily exposure for oral intake, skin contact, and respiratory inhalation than adults. The order of average daily exposure for non-carcinogenic elements is Zn>Cr>Ni>Pb>Cu>As>Cd>Hg. The order of average daily exposure to carcinogenic elements and average daily intake of different heavy metals is Cr>Ni>As>Cd. The order of the maximum daily exposure of noncarcinogenic elements and the average daily intake of different heavy metals is Zn>Cr>Pb>Cu>Ni>As>Cd>Hg, which differs from the average daily exposure. This is mainly reflected in the order of the average values being Ni>Pb>Cu and the order of the maximum values being Pb>Cu>Ni. The order of maximum daily exposure to carcinogenic elements and average daily intake of different heavy metals is Cr>Ni>As>Cd, the same as the average value.
Table 10.
Average daily non-carcinogenic exposure of heavy metals in soil (mg / (kg / d)).
Health Risk Assessment
The evaluation results of the non-carcinogenic health risk index of heavy metals are shown in Table 12.
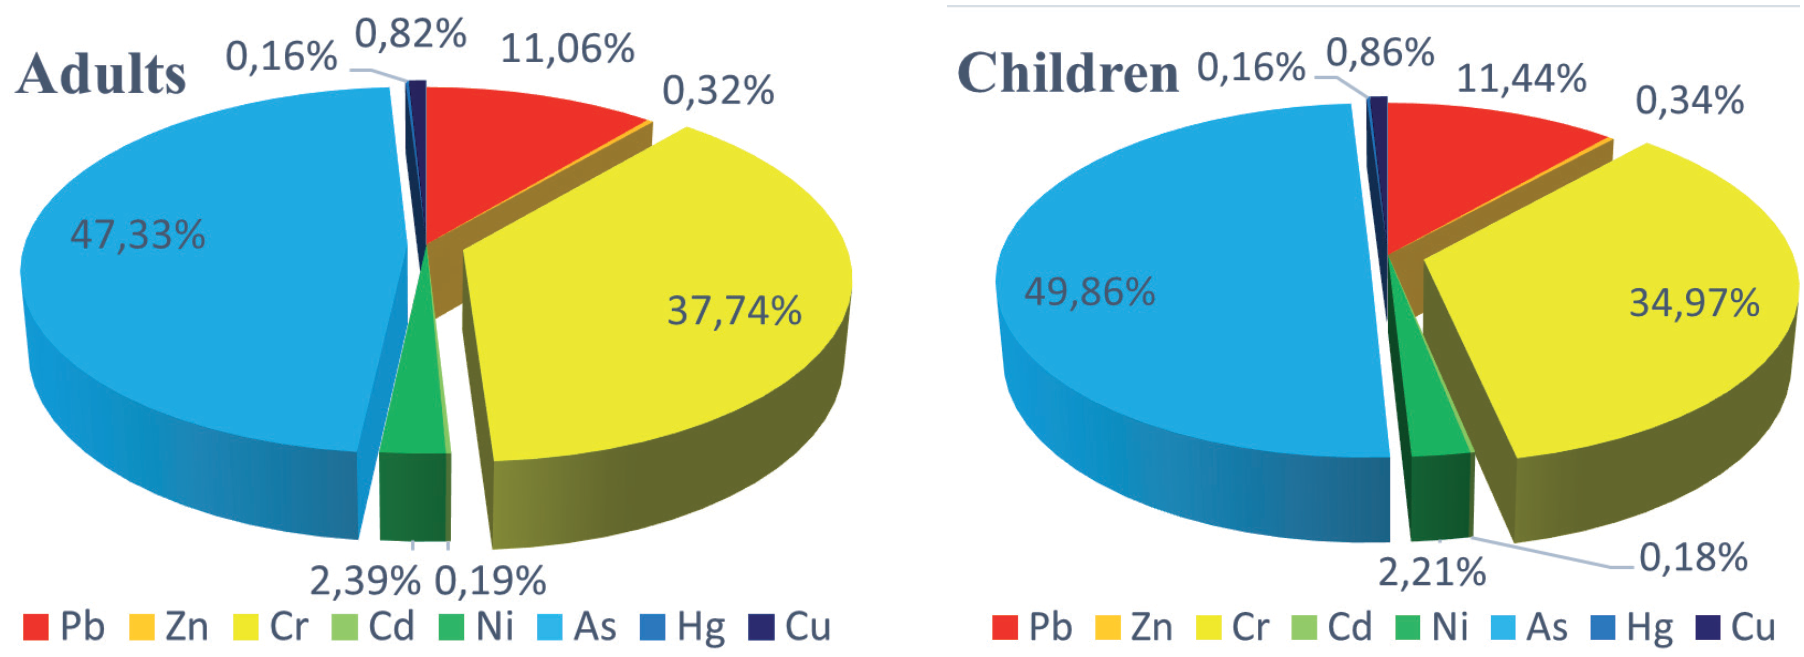
From the results in Table 11, it can be seen that the non-carcinogenic risk of the same element through oral intake, skin contact, and respiratory inhalation is HQing>HQderm>HQnah. Oral intake is the main pathway for non-carcinogenic health risks of soil heavy metals. The order of the average values of noncarcinogenic health risks for different heavy metals is As>Cr>Pb>Ni>Cu>Zn>Cd>Hg. As is the most important influencing element for non-carcinogenic health risks, with an average impact index of 5.55E-02 and 3.95E-01 for adults and children, respectively. The average range of non-carcinogenic health risks for adult elements is 1.83E-04~5.55E-02, with a maximum range of 5.04E-04~6.51E-02. The average non-carcinogenic health risk index for each element is 1.17E-01, with a maximum value of 1.51E-01. The average range of non-carcinogenic health risks for various elements in children is 1.24E-03~3.95E-01, with a maximum range of 3.43E-03~4.62E-01. The average value of the total health risk index for heavy metals in each element is 7.92E-01, with a maximum value of 1.02E+00. The average and maximum values of the single noncarcinogenic health risk index for heavy metals in adults and children are both less than 1, indicating no health risk for single heavy metals. The total health risk index for heavy metals in adults is less than 1, and the maximum value of the total health risk index for heavy metals in children is greater than 1, indicating that heavy metals do not yet pose non-carcinogenic risks to adult health and have already posed non-carcinogenic health risks to children. Therefore, prevention should be strengthened (Fig. 5).
The evaluation results of the carcinogenic health risk index of heavy metals are shown in Table 13.
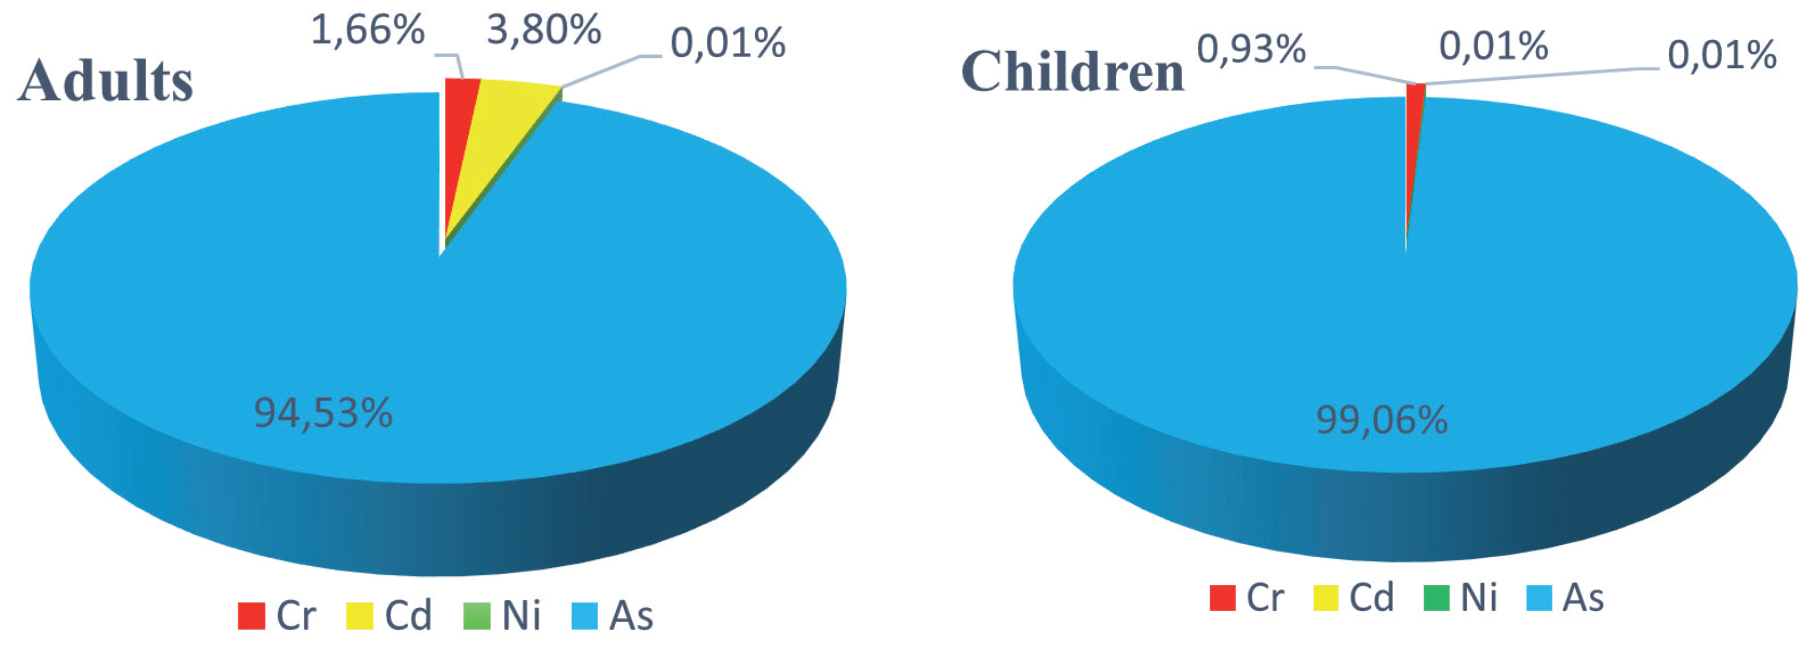
From the results in Table 12, it can be seen that the carcinogenic risk of the same element through oral intake, skin contact, and respiratory inhalation is CRing>CRderm>CRinh. Oral intake is the main pathway for carcinogenic health risks in adults and children. The carcinogenic risk of each element exists as As>Cd>Cr>Ni, and As is the element with the greatest impact on carcinogenic risk (Fig. 6), with an average impact index of 1.03E-05 and 2.78E-05 for adults and children, respectively. The average range of the impact of each element on adult cancer risk is 1.42E-09~9.78E-06, with the maximum range being 1.85E-09~1.49E-05. The average adult cancer risk total index is 1.03E-05, with the maximum value being 1.68E-05. The average range of the impact of each element on children's cancer risk is 2.06E-09~2.65E-05, with the maximum range being 2.67E-09~4.04E-05. The average child cancer risk total index is 2.78E-05, with the maximum value being 4.53E- 05. All element cancer risk indices are less than 10-4. The cancer risk caused by heavy metals in the soil of Gonghe Town is within an acceptable range. However, the carcinogenic risk index for both adults and children exceeds the soil remediation benchmark value of 10-6 proposed by the US EPA, and prevention measures should be strengthened.
Table 11.
Average daily exposure to carcinogenic heavy metals in soil (mg / (kg / d)).
Table 12.
Non-carcinogenic health risk index of soil heavy metals.
Discussion
With the rapid development of rural industrialization in China, some areas of farmland soil have been subjected to varying degrees of heavy metal pollution. There is a certain degree of accumulation of heavy metal content in the soil of Gonghe Town, which is greater than that in 2008 [24]. In 2008, the soil Cd content was still below the background value, but in 2021, it was higher than the background value.
The spatial variation of heavy metals is significant, and there are also differences in the spatial distribution of different heavy metal element contents. The coefficient of variation of Cd reaches 35%, which is lower than the research results of Song Hengfei and Liu Jian [25, 26]. The research area of Liu et al. has a high coefficient of variation due to the excessive use of fertilizers and the extensive use of fungicides. The variability is much smaller than that of Qianjin Town, which reaches 79%, indicating that Gonghe Town is relatively less affected by human activities [27].
Ecological risk refers to the possibility of an ecosystem being threatened by all elements outside the ecosystem, which may damage the structure and function of the ecosystem, thereby endangering its safety and health. The range of the Cd hazard index in the research area is 13.12~109.68, with slight, moderate, and strong ecological risks (these are mainly slight and moderate). From the overall potential ecological index RI, the distribution range of the hazard index is 45.79~142.73, with the highest value less than 150, indicating that the ecological risk in the research area is very low. In the ecological evaluation of soil heavy metals in the Ramsar region of Assam, India, China's neighboring country, it was found that Zn and Mn have low ecological risks [28], while the Chaharmahal and Bakhtiari Province of Iran has high ecological risks for Cd elements [29]. The elements with ecological risks vary among countries. Individual elements of heavy metals in the soil of Gonghe Town have different ecological risks in certain areas, and the ecological risk level of Cd has reached a strong level. It is recommended that measures be taken for prevention and control.
Table 13.
Health risk index of soil heavy metal carcinogenesis.
As is the most important influencing element for non-carcinogenic health risks in the study area, with an average impact index of 5.55E-02 and 3.95E-01 for adults and children, respectively. The total health risk index for heavy metals in adults is less than 1. The maximum value of the total health risk index for heavy metals in children is greater than 1, indicating that heavy metals do not yet pose non-carcinogenic risks to adult health but pose non-carcinogenic health risks to children. As is the element with the greatest impact on carcinogenic risk, with an average impact index of 1.03E-05 and 2.78E-05 for adults and children, respectively. The carcinogenic risk index of all elements is less than 10-4. The carcinogenic risk caused by heavy metals in the soil of Gonghe Town is within an acceptable range. Still, the carcinogenic risk index for adults and children exceeds the soil remediation benchmark value of 10-6 proposed by the US EPA, and prevention measures should be strengthened. Considering the importance of the research area and the current situation of heavy metal pollution, it is recommended that prevention and control mechanisms be introduced. Scholars such as Feng et al. [30] and Wu et al. [31] proposed a plan to introduce biomass to reduce the risk of heavy metal pollution to human health. Practice has shown that this method can greatly reduce the non-carcinogenic and carcinogenic risks of heavy metals to adults and children. Deep et al. [32] and Dalia et al. [33] proposed the use of algae for bioremediation of heavy metal-contaminated soil, stating that algae bioremediation has a significant effect and can be widely applied. Fassler et al. [34] used sunflowers and other plants to manage heavy metal pollution in farmland. The study suggests that using plant extracts for soil purification takes several centuries, indicating that the prevention and control of heavy metal pollution should start from the source and cannot wait until soil pollution occurs before proceeding with artificial remediation.
In summary, heavy metal pollution in soil is widespread around the world and can be treated through methods such as algae and biology. However, remediation is difficult and costly, and heavy metals can pose a threat to human health throughout the food chain. Strengthening pollution protection and restoring soil cleanliness is recommended.
Conclusion
The soil in Gonghe Town has been polluted to varying degrees by heavy metals. The main influencing elements are Pb, Cd, and As, respectively achieving moderate pollution, moderate pollution, and light pollution, while other heavy metal elements show no pollution levels. There is variability in heavy metal pollution, with Cd and Hg showing significantly higher variability than other elements, with coefficients of variation reaching 35% and 30%, respectively. The two heavy metals are unevenly distributed in different regions. In terms of ecological risks associated with heavy metals, the Cd hazard index ranges from 13.12 to 109.68, with slight, moderate, and strong ecological risks, with slight and moderate risks being the main ones. Mild risks account for 95.25%, moderate risks account for 4.11%, and strong risks account for 0.63%. All other elements pose slight ecological risks, with Cd being the main element causing ecological hazards in shallow soil. As is the most significant element affecting both carcinogenic and non-carcinogenic risks. The carcinogenic risk index of all elements is less than 10- 4, and the carcinogenic risk caused by heavy metals in the soil of Gonghe Town is within an acceptable range. Single heavy metals do not pose non-carcinogenic health risks to adults and children, while total heavy metals pose non-carcinogenic health risks to children, and prevention measures should be strengthened.

