

Introduction
Climate change seriously threatens the sustainable development of human society and economy [1-2]. Greenhouse gas emissions, such as carbon dioxide (CO2) and methane (CH4), are the main factors leading to global climate warming [3-5]. In order to mitigate climate change, China put forward a new target of “reaching carbon neutrality by 2030 and carbon peaking by 2060”, called the “dual carbon” target, to better fulfill its carbon reduction responsibilities [6]. As China is a major agricultural producer and consumer, the agricultural sector accounts for about 17% of the total carbon emissions [7]. Consequently, carbon reduction in the agricultural sector should not be ignored, and the development of low-carbon agriculture is essential for sustainable socio-economic development and achieving China’s dual-carbon goals. As an important agricultural production base and ecological barrier in China, the HQD of the Yellow River Basin is not only related to the sustainable development of the regional economy but also directly affects national food security and carbon emission control. The agricultural production in the Yellow River Basin not only constitutes a significant portion of the country’s total agricultural output but also faces multiple challenges, such as land degradation, water scarcity, and carbon emission pressure. In this context, researching how to promote low-carbon transformation in agriculture has become a focus for the current academic community and policymakers.
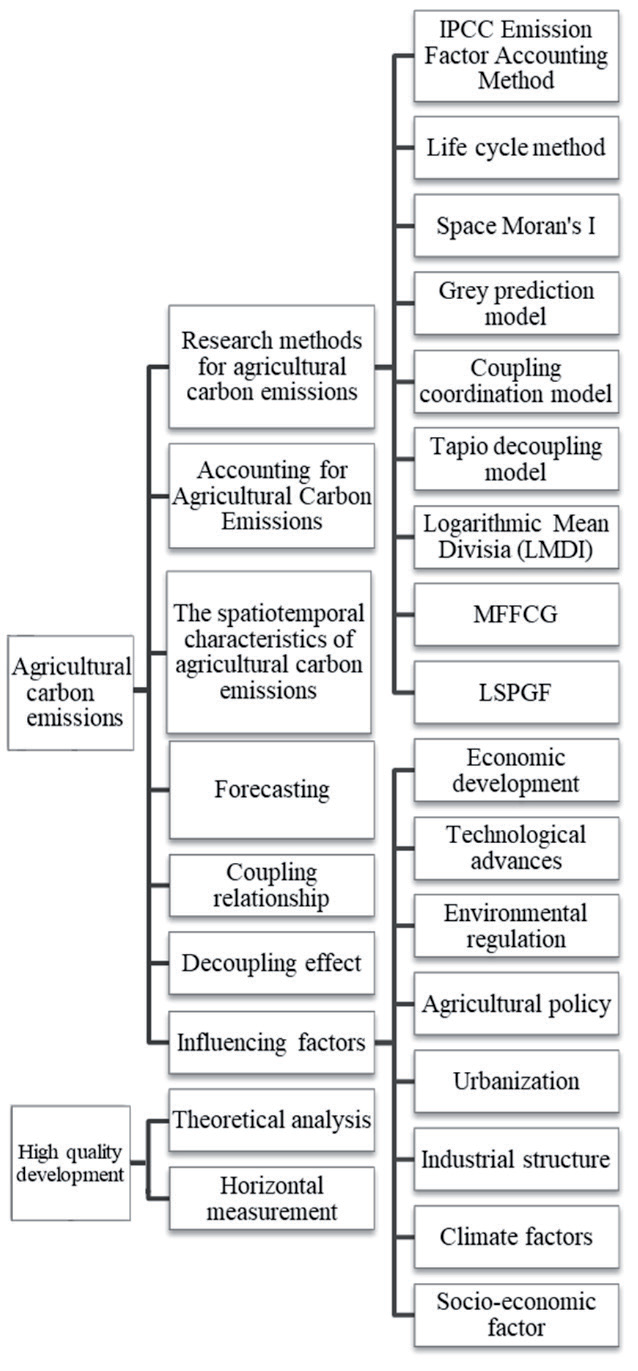
The existing studies on agricultural carbon emissions have achieved fruitful results, including agricultural carbon emissions accounting [8], spatio-temporal characteristics [9], prediction analysis [10], coupling relationship [11], decoupling effect [12], and analysis of influencing factors [13]. From the view of research methods, the main approaches include the IPCC emission factor accounting method, life cycle method, spatial Moran’s I, gray prediction model, XGBoost prediction model, logarithmic mean Divisia index (LMDI), coupled coordination model, Tapio decoupling model, Multi-Feature Fusion of 3D-CNN and Graph Attention Network MFFCG [14], local similarity projection Gabor filtering (LSPGF) [15], etc. As for the drivers of agricultural carbon emissions, the major concerns are economic development, technological progress, agricultural policies, environmental regulations, urbanization, industrial structure, climate factors, socio-economic factors [16], etc. The existing literature has fruitfully explored agricultural carbon emissions from multiple angles and revealed paths and mechanisms of various factors in reducing agricultural carbon emissions.
China’s economy has transitioned from the stage of high-speed development to the stage of high-quality development, as stated in the report of the 19th National Congress [17]. The core connotation of high-quality development (HQD) consists of innovation, coordination, greenness, openness, and sharing, which covers all fields of the social economy. Academics hold varying views on HQD. For example, Zhang et al. [18] argued that HQD should contain the scale of economic development as well as the quality of economic development. Lu et al. [19] held the view that HQD should prioritize quality and foster new development dynamics. Comprehensively, HQD has multidimensional connotations and should be balanced in various aspects, such as economy, society, ecology, and culture [20]. In addition, there is a growing consensus that HQD should include resource conservation and environmental protection. Consequently, HQD has rich connotations and far-reaching significance for the socio-economic transformation and low-carbon development. However, studies on HQD mainly focus on theoretical analysis [21] and level measurement [22], with less attention paid to the relationship between HQD and agricultural carbon emissions. The outline of the literature review is shown in Fig. 1.
The Yellow River Basin, one of the key areas for economic development and ecological fragility in China, has seen its ecological protection and high-quality development become a national strategy [23]. However, despite the long-standing implementation of the HQD strategy in the Yellow River Basin, its specific impact on ACE still lacks quantitative evaluation. Previous studies often overlooked the dynamic relationship between the HQD strategy and ACE. To fill this knowledge gap, this article innovatively combines the HQD strategy of the Yellow River Basin with ACE, using multidimensional quantitative analysis methods. In addition, this article also considers the mechanism of the impact of HQD on ACE and the non-linear relationship between the two, providing a more comprehensive perspective for sustainable regional development. 76 prefecture-level cities in the Yellow River Basin are selected as the research object, and panel data from 2005 to 2021 are used to quantitatively analyze the degree and direction of influence of HQD on ACE. The static and dynamic Durbin models are adopted to explore the relationship between the short-term and long-term effects of HQD on ACE. The mediating effect model is used to reveal the mechanism of HQD on ACE, and the threshold panel model is employed to examine the non-linear relationship between them, aiming to offer insights and a theoretical foundation for low-carbon agriculture and HQD in the Yellow River Basin, China.
Theoretical Analysis and Hypothesis
High-Quality Development (HQD) and Agricultural Carbon Emissions
From an economic perspective, HQD represents a developmental approach aimed at satisfying the genuine needs of the populace [24]. Resource environment changes hinder economic development, illustrating that a development strategy reliant solely on material inputs is unsustainable [25]. To achieve HQD in the new era, it’s imperative to prevent environmental deterioration and mitigate carbon emissions. The advantages of “demographic dividend” and “capital accumulation” are gradually diminishing, making it imperative to shift the drivers of economic development towards innovation and technological advancements [26]. Since the reform and opening up, significant progress has been achieved in China’s economy. However, it still faces challenges such as spatial discordance of development and imbalance between urban and rural regions. Therefore, there is an urgent need to prioritize coordinated strategies in high-quality development initiatives in the new era. Local governments should particularly emphasize green and sustainable development practices. This includes increasing subsidies for peasant households to adopt environment-friendly practices in agricultural planting, such as cultivating green agricultural products and reducing the use of pesticides and chemical fertilizers [27]. By doing so, we can reduce agricultural chemical pollution, enhance environmental sustainability, and contribute to coordinated development. Additionally, further opening up helps to attract foreign investment and promote scientific innovation and technological progress, which helps to cut down agricultural carbon emissions [28]. Finally, HQD emphasizes the concept of “sharing” development. In the agricultural sector, the sharing economy can promote resource recycling and reduce the pressure on environmental resources, while the sharing of information technology can facilitate technology advancement, which is beneficial to reducing agricultural carbon emissions and sustainable development in agriculture. HQD is recognized as an effective way to reduce carbon emissions [29, 30]. In summary, this paper proposes the following hypotheses:
H1: HQD presents a reducing effect on agricultural carbon emissions.
Spatial Spillover Effects
In geography, everything is related, with closer things exhibiting stronger relationships. The spatial spillover effects of HQD on agricultural carbon emissions occur through various channels, including interregional resource allocation optimization, synergy between regions, coordination of policies across regions, and dissemination of knowledge between regions. Firstly, HQD can optimize inter-regional resource allocation by sharing agricultural technology and management experience, effectively preventing neighboring regions from “taking a detour” and facilitating the direct use of advanced technology and effective management experience, which reduces agricultural carbon emissions. Secondly, HQD can promote inter-regional cooperation, realize the complementary effect between regions, and boost the overall production efficiency in agriculture, thereby reducing carbon emissions from agriculture. In addition, HQD requires strengthening inter-regional environmental policy cooperation, facilitating the integration of environmental governance, and enhancing the management efficiency of agricultural carbon emissions. Finally, HQD encourages the diffusion of interregional knowledge, which contributes to the application of low-carbon technology, promotes the transformation of production mode, and reduces agricultural carbon emissions in neighbors. As a consequence, the following hypothesis is proposed:
H2: HQD poses a negative spatial spillover effect on agricultural carbon emissions.
Mediating Effects of Industrial Structure Upgrading (ISU)
It has been argued that industrial structure upgrading (ISU) is feasible to realize HQD [31]. ISU is mainly characterized by the decline in primary industry and the ascent of secondary and tertiary industries. Meanwhile, industrial structure evolves towards advanced and coordinated development [32]. ISU is also a green development approach with low energy, less pollution, and high yield, which meets the requirements of HQD. When upgrading the industrial structure, agricultural modernization is further promoted. More advanced technology and equipment are used in agricultural production, raising efficiency and reducing agricultural carbon emissions. Meanwhile, literature has revealed that ISU can significantly reduce carbon emissions [33, 34]. Consequently, this paper proposes the following hypothesis:
H3: HQD can go through ISU to reduce agricultural carbon emissions.
Threshold Effects of Urbanization and Economic Development
An increase in the urbanization rate is one of the characteristics possessed by HQD [35]. In the primary stage of urbanization, rural areas send out a large number of young and strong laborers. The increased urban population now stimulates the demand for agricultural products. Consequently, pesticides and chemical fertilizers are used to boost output and satisfy market demand. Meanwhile, the concept of HQD could not be fully implemented, leading to increased agricultural carbon emissions. However, when urbanization reaches a critical level, cities begin to have a positive spillover effect on rural areas. Specifically, cities provide modern technology and systems to support agriculture [36], promoting intelligent and low-carbon development. This transition enhances management and production efficiency, reduces the consumption of agricultural resources, and increases farmers’ awareness of environmental protection. The conditions for HQD can be satisfied, thus reducing agricultural carbon emissions. In summary, this paper puts forward the following assumptions:
H4: Urbanization manifests a threshold effect on the influence of HQD on agricultural carbon emissions.
Environmental degradation is often prioritized in exchange for economic growth during the initial stages of economic development, leading to numerous environmental issues [37]. At that time, the promotion of local officials was also linked to the local economy [38]. As a result, local governments increased the use of traditional energy sources to boost GDP growth in the short term, often at the expense of environmental protection. Moreover, the concept of HQD was not fully recognized. These factors collectively led to increased agricultural carbon emissions. Environmental problems caused by extensive economic growth are increasingly prominent when the economy develops to a certain extent. To address these problems, the country has introduced corresponding policies. At the same time, the environmental protection awareness of farmers has been improved [39], and more farmers are willing to accept green agricultural production methods, which helps reduce the dependence on traditional production methods and further raises the efficiency of agricultural production and reduces agricultural carbon emissions [40]. In summary, this paper makes the following hypothesis:
H5: Economic development poses a threshold effect on the influence of HQD on agricultural carbon emissions.
Materials and Methods
Methodology
Spatial Autocorrelation
The global Moran’s I is adopted to test the degree of spatial patterns of HQD and agricultural carbon emissions. The formula is as follows:
where I is the global Moran’s I; n denotes the number of cities; xi and xj are the level of HQD or agricultural carbon emissions of city i and city j; x̅ is the mean value; Wij denotes the spatial weight matrix. I>0 means the positive spatial autocorrelation, and I<0 denotes the negative spatial autocorrelation. The larger the value, the more obvious the agglomeration characteristics.
Spatial Econometric Model
The spatial econometric model can measure the influence of drivers on dependent variables, considering spatial factors among variables. To reveal the direct and indirect influences of HQD on agricultural carbon emissions, the spatial Durbin model is adopted (Eq. (2)). In addition, given that agricultural carbon emissions are also influenced by the prior period, the dynamic spatial Durbin model is constructed as Eq. (3).
where C represents the agricultural carbon emissions; HQD is the core explanatory variable, that is, high-quality development; X presents control variables; W denotes the spatial weight matrix; i and t refer to city and time, respectively; σ, λ, and δ stand for the corresponding coefficients; ui and vi are spatial individual fixed effects and time fixed effects; eit indicates a random error.
Models of Mediating Effects
Based on previous theoretical analysis, HQD has the potential to influence agricultural carbon emissions using ISU. The mediation effect model is constructed in order to verify the mechanism:
where M denotes the mediating variable.
Panel Threshold Models
To reveal the non-linear curve between HQD and agricultural carbon emissions at varying degrees of urbanization and economic development, a panel threshold model is used:
where TH denotes the threshold variable. I(·) is the indicator function, and the value is 1 when it satisfies the condition in the parentheses; otherwise, it is 0.
Selection of Variables
Agricultural Carbon Emissions
Carbon emissions in agricultural production principally originate from chemical fertilizers, pesticides, and agricultural films, as well as the energy consumption of agricultural machines, agricultural land tilling, and agricultural irrigation [39]. Therefore, agricultural carbon emissions mainly cover agricultural material inputs (fertilizers, agricultural films, pesticides, agricultural land tilling, total power of agricultural machines, agricultural irrigation, etc.). The specific Equation is constructed as follows:
where Ci denotes the emissions of the i-th carbon source, Ti is the activity of the i-th carbon source, and τi is the carbon coefficient of the i-th emitter. The coefficients of carbon emissions for each emitter are displayed in Table 1.
Core Explanatory Variables
This paper takes high-quality development (HQD) as the core explanatory variable. Referring to existing results [41-43], an index system is constructed to evaluate the level of HQD, covering five categories: innovative development, coordinated development, open development, green development, and shared development. Considering the data availability, 21 indicators are listed in Table 2, and the entropy weighting method is applied to calculate the weights of indicators.
Control Variables
Considering the potential influencing factors affecting carbon emissions in agricultural production [44, 45], this paper chooses the following control variables: (1) Fertilizer application intensity (FI) adopts the ratio of fertilizer utilization to the sown area; the process of fertilizer application will generate greenhouse gases, which will play a direct role in agricultural carbon emissions. (2) Rural Energy Infrastructure (RE): Rural electricity consumption is strongly associated with agricultural activities in production progress, which will generate carbon emissions [46]. (3) Agricultural economic development (AED) adopts agricultural GDP (processed in 2005 as the base period); agricultural economic development usually boosts the technological progress in agricultural production, leading to changes in agricultural carbon emissions. (4) Agricultural technology progress (AT) adopts fertilizer application discounted amounts; fertilizer can increase crop yields, promote agricultural modernization, and improve agricultural production efficiency, which is related to agricultural carbon emissions.
Table 1.
Carbon coefficients for each agricultural emitter.
Table 2.
Evaluation index system for high-quality development.
Mediating Variables
Industrial structure upgrading (ISU) is selected as the mediating variable. Based on Lin and Zhou [47], ISU is calculated as follows:
where Yj denotes the output value of the j-th industry; Y means the gross output value of three industries; and Lj indicates the number of employees in the j-th industry.
Threshold Variables
Urbanization and economic development levels are selected as threshold variables. Urbanization is depicted by the proportion of the urban population to the total population. The level of economic development is deemed as the real total GDP of the study area (processed with the base period of 2005).
Study Area and Data
Study Area
The Yellow River Basin covers Qinghai, Sichuan, Ningxia, Gansu, Inner Mongolia, Shaanxi, Shanxi, Henan, and Shandong. However, Sichuan is now part of the Yangtze River Economic Belt, and the four leagues of Inner Mongolia are included in the Northeast region [48]. Further, considering data availability, 76 prefecture-level cities in the Yellow River Basin were finally selected as the study area.
Data
This paper uses panel data from 2005-2021, mainly from provincial statistical yearbooks, prefecture-level city statistical bureaus, and the China Urban Statistical Yearbook. Interpolation is adopted to complete some missing values.
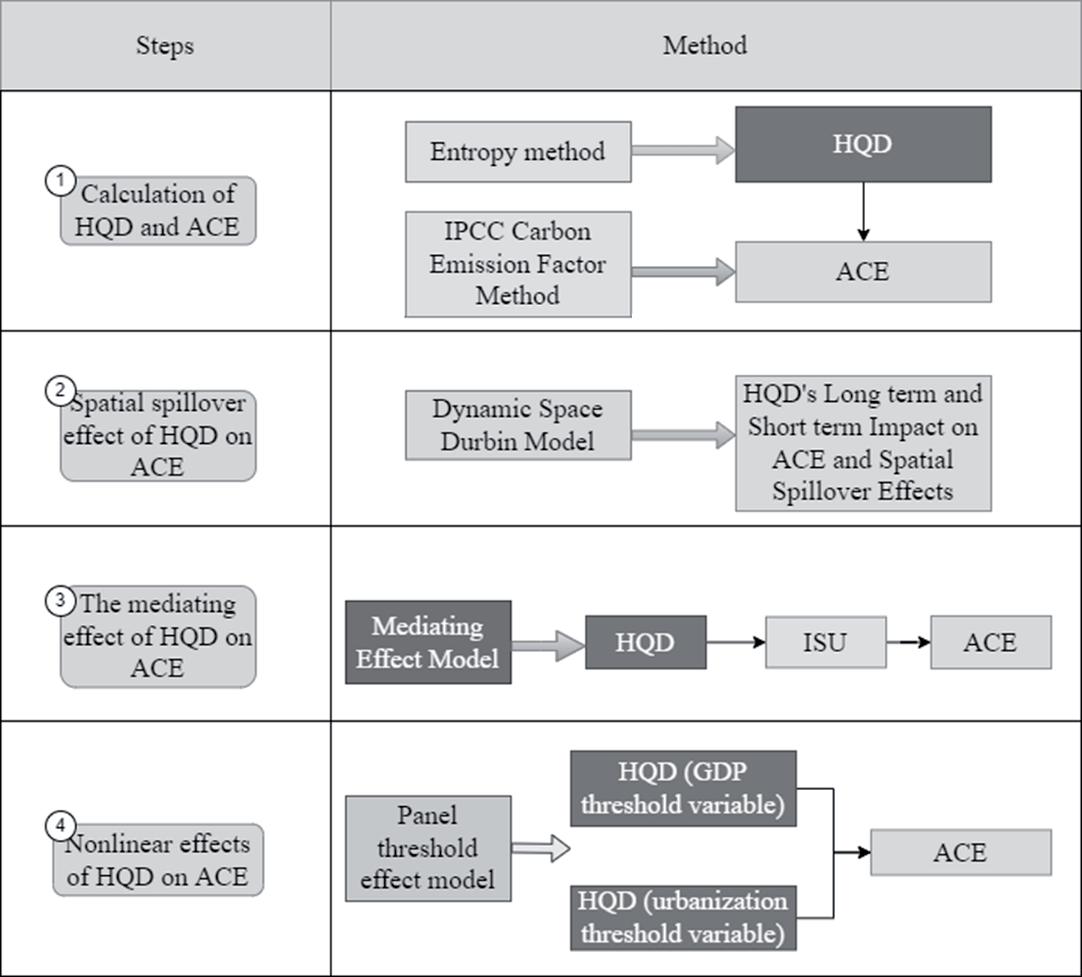
The methods and steps used in this article are shown in Fig. 2.
This study has important social and policy value in evaluating the key determinants of ACE in the Yellow River Basin for HQD. By using the dynamic spatial Durbin model, the mediation effect, and a threshold effect model, this study explores the impact of HQD in the Yellow River Basin on ACE while controlling for variables such as fertilizer application intensity, rural energy infrastructure, agricultural economic development, and agricultural technological progress. By evaluating the impact of HQD on ACE and exploring whether industrial structure upgrading has a mediating effect, this study may provide a scientific basis for agricultural green transformation, industrial structure optimization, and efficient resource utilization. At the same time, threshold effect analysis can reveal key threshold values for economic development and urbanization, helping to implement precise policies and promote regional coordinated development. In addition, the research findings may provide a reference for global agricultural carbon reduction and climate change response, with economic, social, and environmental benefits.
Results
Spatio-temporal Characteristics of Agricultural Carbon Emissions
Temporal Trends
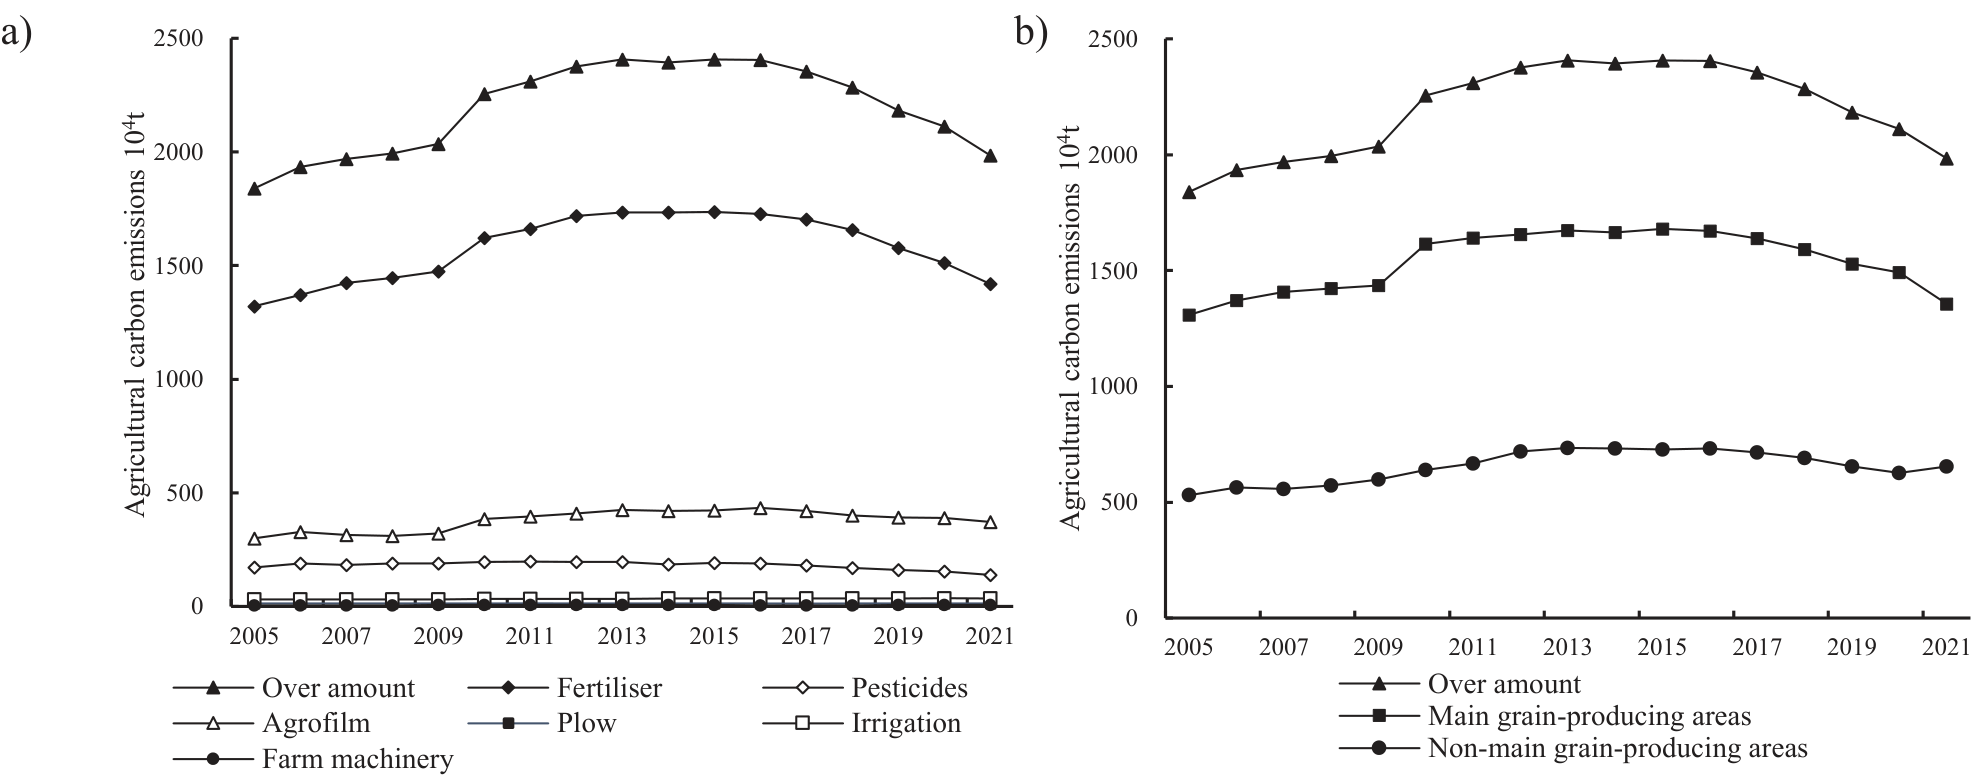
Carbon emissions from agricultural production in the Yellow River Basin present an inverted U-shaped increase curve, first rising and then descending over time, as displayed in Fig. 3a). Carbon emissions from chemical fertilizers are the highest, while agricultural machinery contributes the least to emissions. Fig. 3b) demonstrates the main grain-producing areas show a similar trend in agricultural carbon emissions with the total trend, and the carbon emissions in these areas are significantly higher than those in non-grain-producing areas. Notably, the degree of carbon reduction has been pronounced in recent years, which is mainly caused by the decrease in emissions from main grain-producing areas.
Spatial Characteristics
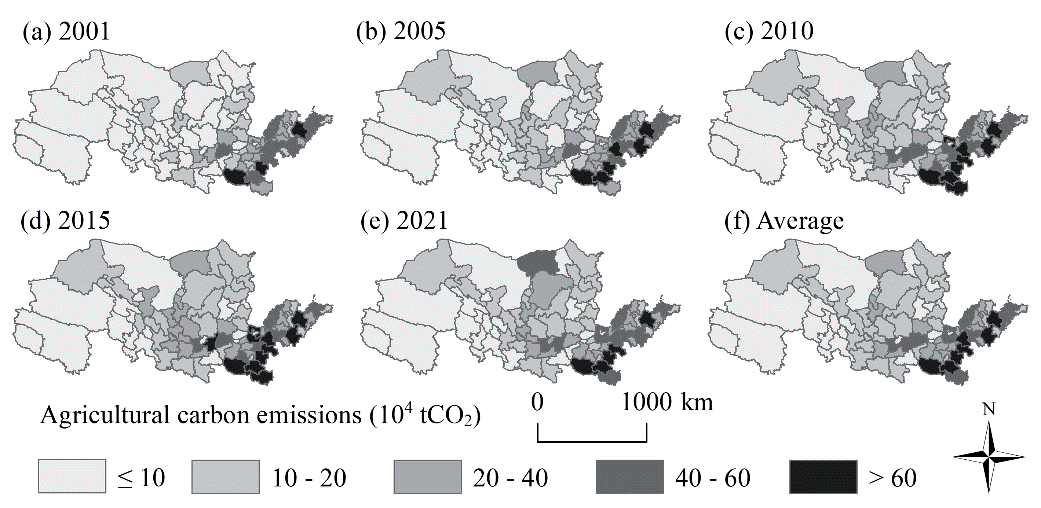
From the perspective of spatial distribution, ACE in the Yellow River Basin shows a trend of higher levels in the western part and lower levels in the eastern part (Fig. 4). Areas with high carbon emissions are primarily located in Henan and Shandong provinces. In terms of temporal characteristics, the agricultural carbon emissions in the western region consistently remained relatively low, while the central region has shown a significant increase. The eastern region has exhibited a trend of an initial increase followed by a decrease.
Both HQD and ACE display positive spatial agglomeration characteristics. Moran’s I of ACE shows a decreasing trend, from 0.383 in 2005 to 0.271 in 2021, indicating a decrease in their spatial agglomeration over time. Similarly, the spatial agglomeration of HQD also decreased from 0.341 in 2005 to 0.104 in 2021 at a faster speed, possibly due to government support policies and the increasing role of human factors in HQD.
Spatial Regression Analysis
Model Selection
Based on the previous content, it is known that both HQD and agricultural carbon emissions exhibit significant spatial agglomeration. Therefore, spatial effects need to be considered when analyzing the influence of HQD on agricultural carbon emissions. Results show that all the LM values pass the significance test at the 1% level, demonstrating that the spatial Durbin model (SDM) should be selected, which is a combination of the SAR and SER models. The Hausman test shows that the null hypothesis is rejected at the 1% significance level, which declares that a fixed-effect model is suitable for regression fitting. Both the Wald and LR tests refuse simplification from the SDM models to the SAR or SEM models. Therefore, the SDM model with fixed effects is used in this paper.
Regression Analysis Results
Both the static and dynamic Durbin models show that HQD plays a significant role in reducing agricultural carbon emissions. Table 3, Model (3), shows that the regression coefficient of time lag of agricultural carbon emissions (L.lnC) is 0.653, passing the 1% significance test, indicating that the agricultural carbon emissions correlate positively with the emissions of the previous period, which manifests that the agricultural carbon emissions possess the “time inertia”. It may be because some agricultural technologies and practices will only show their advantages after being used in the current period, as they require time to accumulate. The coefficient of spatio-temporal lag of agricultural carbon emissions (L.WlnC) is -0.072, significant at the 1% statistical level, showing that the previous carbon emissions in the surrounding areas negatively affect the local emissions. This result supports ACE’s spatial and temporal dependence, suggesting that the spatial spillover effect is dynamic and continuous. This may be because high ACE in neighboring areas triggers local government attention, prompting them to take measures to mitigate high emissions. Meanwhile, these measures can also serve as a reference for surrounding areas.
The estimated coefficients of HQD are -0.638 and -0.263 in the static Durbin and dynamic Durbin models, respectively, passing the 5% significance test. These results indicate that HQD has a negative effect on carbon emissions, supporting Hypothesis 1. For the control variables, fertilizer application intensity, rural energy infrastructure, and agricultural technological progress all positively affect carbon emissions, with significance tests at the 1% statistical level. Specifically, increasing fertilizer intensity signifies greater fertilizer use per unit area, thereby increasing agricultural carbon emissions. Similarly, increasing rural energy infrastructure implies higher energy consumption, which, given its reliance on fossil fuel combustion, also contributes to increased carbon emissions. While technological advances in agriculture have improved agricultural productivity, they may also expand the scale of cultivation, leading to an increase in the consumption of agricultural factors, thereby increasing agricultural carbon emissions. Nevertheless, agricultural economic development has no significant influence on carbon emissions, which is likely due to the weak effect on technological innovation.
Table 3.
Results of the static and dynamic Durbin models with the adjacency weight matrix.
[i] Note: C: agricultural carbon emissions; HQD: high-quality development; FI: fertilizer application intensity; RE: rural energy infrastructure; AED: agricultural economic development; AT: agricultural technological progress. *, **, *** indicate significance at the 10%, 5%, and 1% levels, respectively.
Spatial Decomposition Effects
Studies have demonstrated that the dynamic Durbin model exhibits superior significance and fit compared to the static Durbin model, thereby justifying its selection for further analysis. Based on LeSage and Pace [49], the model requires differential processing when assessing the spatial effect of factors on the explained variable.
Fig. 5 gives an intuitive presentation of the effects of HQD on agricultural carbon emissions. The direct effects of HQD are -0.263 and -0.771 for the short-term and long-term, respectively, both passing the 5% significance level. The results confirm that HQD can significantly reduce agricultural carbon emissions. Notably, the long-term coefficient is higher than the short-term coefficient, suggesting a more profound and enduring negative impact of HQD on agricultural carbon emissions. This can be attributed to the fact that HQD promotes the adoption of agricultural production methods and technological innovations, such as high-efficiency water-saving irrigation and intelligent agricultural management systems, and introducing these technologies will continue to reduce agricultural carbon emissions.
In terms of the indirect effect of HQD on carbon emissions, the short-term and long-term coefficients are -0.469 and -1.461, respectively, both passing the statistical significance test at the 1% level. This result suggests that HQD exhibits significant negative spatial spillover effects, meaning that HQD in surrounding areas has a significant influence on reducing local agricultural carbon emissions. Hypothesis 2 was confirmed. Furthermore, the long-term coefficient of HQD is more than three times that of the short-term, indicating a more pronounced long-term negative impact of HQD on agricultural carbon emissions in surrounding areas. This can be attributed to the promotion of advanced agricultural technology dissemination from surrounding areas to the local region by HQD, which prompts a transition of production mode from high emissions to low carbon. However, the technology transfer may require a certain amount of time and an adaptation period, thus resulting in a more significant long-term carbon reduction effect.
As for the control variables, fertilizer application intensity significantly positively influences carbon emissions in both the short term and the long term, indicating that increased fertilizer application intensity can lead to higher agricultural carbon emissions. Notably, the long-term direct effect coefficient of fertilizer application intensity exceeds that of the short-term. This can be attributed to the fact that the high intensity of fertilizer application damages soil health and reduces the soil’s carbon sink capacity, resulting in a significant increase in ACE over time.
Rural energy infrastructure is positively related to agricultural carbon emissions at the 1% significance level both in the short and long term. That means the rural energy infrastructure facilitates agricultural production while it promotes energy consumption and emits more carbon dioxide. Furthermore, the short-term and long-term indirect effects are significantly positive. This study indicates that rural energy infrastructure can also increase carbon emissions in the local region. It may be attributed to rural energy infrastructure, which still relies on traditional energy sources for heating greenhouses and agricultural irrigation, affecting the surrounding development patterns and consequently leading to higher carbon emissions.
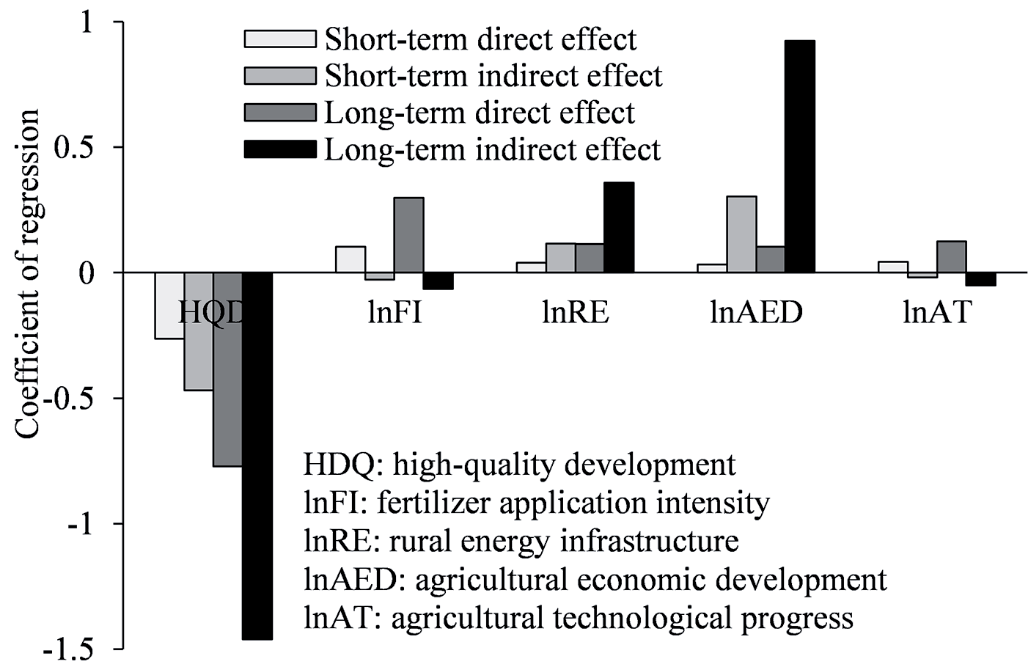
Agricultural economic development has a positive indirect effect on both short and long-term carbon emissions. It indicates that the development of the agricultural economy in neighboring regions can increase carbon emissions in the local region. However, the long-term coefficient is higher than that of the short-term. The reason is likely that agricultural economic development is usually accompanied by the transportation and industrial-scale expansion of agricultural products, increasing the local region’s agricultural carbon emissions. From the long-run perspective, as the scale of agricultural products expands and stabilizes, the related transportation requirements will also increase, making the long-term effect more pronounced.
Agricultural technological progress positively affects the growth of carbon emissions, with coefficients of 0.043 in the short term and 0.124 in the long term. This phenomenon may be attributed to the fact that technological progress in agriculture promotes the scale of agricultural cultivation, increases the consumption of agricultural materials, and thus boosts the increase in carbon emissions.
Robustness Tests
Some substitutions, such as the spatial weight matrix, core explanatory factor, and explained factor, are employed to examine the robustness of the regression results (Table 4). HQD’s influences on agricultural carbon emissions remain significantly negative, whether in the short and long terms or the direct and indirect effects. These findings suggest that the model results are robust and reliable.
Results of Mediating Effects
According to the theoretical analysis and research hypotheses above, HQD likely affects agricultural carbon emissions through industrial structure upgrading. Based on the Hausman test (statistic of 293.08, p-value of 0), the fixed mediating effect model is selected to verify the pathway through which HQD affects agricultural carbon emissions.
HQD can affect agricultural carbon emissions by upgrading industrial structures. Model (2) in Table 5 shows that the estimated coefficient of HQD is 1.325, significant at the 1% level, indicating that HQD can effectively promote industrial structure upgrading. Combined with the Model (3) in Table 5, the estimated coefficient of industrial structure upgrading is -0.175, and the estimated coefficient of HQD is -0.271, both significant at the 1% and 10% levels. The results show that HQD can promote industrial structure upgrading, which in turn suppresses carbon emissions, supporting Hypothesis 3.
Analysis of the Panel Threshold Model
Urbanization and economic development are selected as threshold variables, and a panel threshold model is adopted to verify the non-linear relationships between HQD and agricultural carbon emissions. We employ the Bootstrap method with 1000 samples. The double threshold test of urbanization passes the 10% significance test, while the triple threshold test fails. Economic development passes the single threshold test at the 5% significance level but fails the double threshold test. The threshold values for urbanization are 46.80 and 54.25, respectively, while the threshold value for economic development is 1946.35. The LR test is conducted to further validate the threshold test. Results show that the minimum value is below 7.35, indicating the validity of our threshold estimation values in this study.
Table 4.
Robustness test.
Table 5.
Mechanism test.
Urbanization exhibits a threshold effect on the impact of HQD on agricultural carbon emissions. As shown in Model (1) of Table 6, when the urbanization rate is below the first threshold of 46.8, the coefficient of HQD is 0.730, passing the 5% significance test. When the urbanization rate is between 46.8 and 54, the coefficient of HQD turns negative. However, when the urbanization rate surpasses 54, the coefficient of HQD drops to -0.723, with a 1% significance level. These results indicate that HQD significantly promotes agricultural carbon emissions before the first threshold while significantly suppressing carbon emissions after the second threshold. Hypothesis 4 was validated.
Economic development also exhibits a threshold effect on the relationship between HQD and agricultural carbon emissions. Model (2) in Table 6 demonstrates that when the level of economy is below the threshold of 1946.53, the coefficient of HQD on agricultural carbon emissions is 0.658, significant at the 5% level, which indicates a significant promotion of HQD on emissions before the threshold. Conversely, when economic development surpasses the threshold of 1946.53, the coefficient of HQD falls to -0.400 and remains significant. The result signifies a reduction of HQD on emissions. Hypothesis 5 was confirmed.
Table 6.
Threshold model regression results.
Discussion
Accounting of Agricultural Carbon Emissions
Carbon emissions and carbon footprint may vary significantly due to differences in sources and carbon emission coefficients [50]. For example, Li et al. [51] hold that the sources of agricultural carbon emissions mainly come from farmland inputs and rice planting and growing. By contrast, Xiong et al. [52] and Zhang et al. [53] calculated agricultural carbon emissions considering six main agricultural production activities. Existing studies also show inconsistencies regarding the carbon emission coefficient. For instance, Duan et al. [54] used 266.48 kg hm−2 as the coefficient of agricultural irrigation, while Xie et al. [55] took the coefficient of 20.476 kg hm−2, which is widely adopted and also used in our studies. These differences in carbon sources and coefficients can lead to variations in calculation results. However, our calculation results can be verified. The trend of agricultural carbon emissions presents an inverse U-shaped curve, with high emissions mainly occurring from 2012-2016, reaching nearly 2500 t C. All these characteristics are consistent with Ren et al. [56], confirming the credibility of our results.
Trends in Agricultural Carbon Emissions
Overall, agricultural carbon emissions first increased and then decreased, consistent with the national trend [57]. Agricultural carbon emissions began to decline around 2016. China put forward an agricultural transformation strategy in 2015 to promote green, ecological, and sustainable agricultural development. Meanwhile, the Ministry of Agriculture launched a “weight loss and drug reduction” campaign to improve fertilizer use efficiency and control the use of pesticides. In 2016, an ecological civilization evaluation index system was established, in which fertilizer and pesticide use became key focuses. Policies guiding the transition of agricultural production activities to eco-friendly and sustainable modes contribute to agricultural carbon reduction.
From the spatial map, areas with high agricultural carbon emissions are primarily located in Shandong and Henan provinces, consistent with Zhang et al. [53]. As major grain-producing regions, Shandong and Henan have abundant cultivated land resources. The need to increase food production has driven material input for agricultural production, thereby causing a rise in carbon emissions. Additionally, carbon emissions show significant spatial agglomeration, which aligns with the findings of Jin et al. [58]. The results confirm that models considering geographic relationships are more suitable for revealing the influencing factors.
Influence of HQD on Agricultural Carbon Emissions
HQD affects agricultural carbon emissions negatively, both directly and indirectly. This means that HQD can significantly reduce agricultural carbon emissions in local and surrounding areas. Moreover, the long-term inhibitory effect is greater than the short-term effect. Zeng et al. [59] stated that a high level of green investment has the impetus to develop a high-quality economy and reduce carbon intensity. While promoting green technology, the synergy between carbon emission efficiency and HQD generally rises [60]. Green technology innovation is a major driver of industrial structure upgrading [61]. HQD influences agricultural carbon emissions by upgrading industrial structure, which is similar to the conclusion of Wu et al. [62]. Besides, HQD can potentially restrain agricultural carbon emissions in neighboring regions through demonstration learning effects, technology spillover effects, and interregional factor flows. In addition, the long-term inhibition effect of HQD is bigger than the short-term effect. Notably, HQD has a threshold effect on agricultural carbon emissions.
High-quality development has a threshold effect on agricultural carbon emissions. Urbanization and the economy play a role in the relationship between high-quality development and agricultural carbon emissions. With the rise in urbanization and the economy, the impact of high-quality development has shifted from positive to negative. That means that, in the early stages of economic development and urbanization, the economic benefits of agriculture were more emphasized. When economic development and urbanization reach a certain level, ecological and environmental benefits become more prominent, environmental regulation is strengthened, and green innovation gains momentum [63]. Then, agricultural carbon emissions are promising to decline. As a result, the level of urbanization and economic development leads to an inverted-U relationship.
In terms of spatial heterogeneity, high-quality development has a significantly negative effect on agricultural carbon emissions in the major grain-producing areas and the lower reaches of the Yellow River basin. Major grain-producing areas bear the burden of national food security due to their dominant agricultural production resources and natural endowments [64]. In order to tap the greater potential of agricultural production, the intensity of agricultural input is increased, leading to higher pollution emissions. Similarly, the lower reaches of the Yellow River basin have better natural endowments in agricultural production than those of upper and lower regions, resulting in different impacts of high-quality development on agricultural carbon emissions.
Policy Suggestions
Specific policy recommendations are provided to help policymakers, practitioners, and stakeholders clearly understand how to apply the research findings to address real-world problems. This helps transform the academic value of research into practical social benefits and ensures its effective utilization.
Firstly, promote the development of a high-quality economy. HQD significantly reduces agricultural carbon emissions, both in the short term and long term. Effective strategic planning should be formulated and adopted to accelerate HQD, such as leveraging local strengths and consulting experienced experts. The promotion of HQD facilitates the adoption of advanced agricultural technologies, such as precision agriculture, organic agriculture, and water-fertilizer integration, which is supported for research and development, technology promotion, and application to boost production efficiency in agriculture. Additionally, regional cooperation should be strengthened to maximize resource utilization and intensify technological exchanges in order to break down technological barriers among regions.
Secondly, upgrade the industrial structure. The rise in HQD correlates with the decline of agricultural carbon emissions, with industrial structure upgrading acting as a key driver and bridge between the two. Thus, optimizing and upgrading the industrial structure is an important pathway to mitigate agricultural carbon emissions. The key to upgrading the industrial structure is establishing policies and measures promoting technological innovation and accelerating the transition to high-end, intelligent, and green industries. The specific approaches include transforming traditional industries, fostering emerging industries, accelerating technological progress, optimizing the service sector, and supporting the development of small and micro enterprises.
Thirdly, it accelerates urbanization and regional economic development. Urban planning and development should be rigorous and well-structured, with the integrated development of urban and rural areas. Urbanization refers not only to population urbanization but also to the coordinated evolution of population, economy, society, land, and other aspects. The accessibility and coverage of public services need to be expanded to improve public service facilities and fully realize their potential to contribute to HQD through high-level urbanization and reduced carbon emissions.
Finally, ramp up investment in agricultural technology and innovation in major grain-producing areas. Agricultural production technology with energy saving and environmental protection contributes to reducing carbon emissions. Due to the high emissions in major grain-producing areas, as well as in the middle and lower reaches of the Yellow River, it is imperative to adjust resource allocation policies to ensure these regions receive adequate technical, financial, and policy support. In addition, incentive policies aimed at reducing agricultural carbon emissions should be tailored to local conditions to effectively guide and curb agricultural carbon emissions.
Conclusions
This study aims to explore the impact of HQD in the Yellow River Basin on ACE and its determining factors. As an important grain production base and economic region in China, the Yellow River Basin faces dual environmental and development pressures. HQD aims to achieve comprehensive and sustainable economic, social, and environmental development through innovative, green, coordinated, open, and shared development concepts. However, implementing HQD in the agricultural sector, especially in terms of its impact on ACE, still requires further research.
Utilizing the panel data of 76 prefecture-level cities in the Yellow River Basin from 2005 to 2021, the effect of high-quality development (HQD) on agricultural carbon emissions was revealed. The static and dynamic Durbin models were compared to quantify the influence of HQD on carbon emissions. The main conclusions are summarized. (1) An inverse U-shaped trend was found in agricultural carbon emissions in the Yellow River Basin; that is, emissions first increased and then decreased. From a spatial perspective, areas with high emissions were primarily located in Shandong and Henan provinces, and significant spatial agglomeration appeared. This indicates that the agricultural activities in these regions share strong homogeneity and similar agricultural production methods, resulting in similar levels of carbon emissions. (2) Agricultural carbon emissions exhibited obvious heterogeneity. Carbon emissions from fertilizer application accounted for more than 70%, far exceeding other emissions. Major grain-producing areas emitted more than twice as much carbon dioxide as non-major grain-producing areas. This reflects that the main grain-producing areas may have higher intensity in fertilizer application and mechanized operations, leading to higher carbon emissions. (3) HQD significantly negatively affected agricultural carbon emissions, both the direct and spillover effects. Specifically, the long-term effect of HQD was higher than that of the short-term. This indicates that the effects of HQD become more significant over time. In the short term, some new technologies and management methods may take time to adapt and optimize, but over time, the effects of these methods will gradually become apparent. (4) There was a non-linear effect of HQD on agricultural carbon emissions. High-quality development increased agricultural carbon emissions if the level of urbanization and economic development was lower than the threshold value. When urbanization and economic development reached a certain level, the rise in HQD played a role in reducing carbon emissions. This may be because, in the primary stage, HQD may be accompanied by more infrastructure construction and industrial development, increasing ACE. However, when urbanization and economic development reach a certain level, improvements in technology and management methods will significantly reduce carbon emissions.
Possible research contributions to this article are twofold. (1) The theoretical contribution lies in applying the theory of HQD to the issue of ACE, expanding the scope of theoretical application, and demonstrating that HQD is not only a novel economic concept but also a crucial pathway for sustainable agricultural development. (2) The policy contribution is to provide a scientific basis for agricultural carbon reduction in the Yellow River Basin. Policymakers can refer to the conclusions to formulate precise policies and promote green agricultural development.

