

Introduction
As a key strategy for China’s development, the Yellow River Basin’s ecological protection and high-quality development are highly significant in many aspects, including environmental governance and sustainable development. The Yellow River Basin is an ecological corridor connecting Qinghai-Tibet, the Loess Plateau, and the North China Plain; it is also an important ecological security barrier for China. The Yellow River Basin is also a region for population activities and economic development, with a total population of 421 million and a GDP of 3.070 billion yuan at the end of 2022 in the nine provinces along the Yellow River1, accounting for 29.82% and 25.51% of the national total, respectively. However, the Yellow River Basin faces greater pressure for green development and transformation. More than 50% of the cities are old industrial and resource cities, with mineral resource extraction and processing as the dominant industry. Coal chemical enterprises account for 80% of the country, and enterprises in key heavy metal industries account for about 20%. In addition, 65.6% of cities are in arid and semi-arid areas; the degradation rate of natural grassland in upper reaches has reached 60-90%, more than 200,000 km2 of soil and water erosion in middle reaches are still in urgent need of treatment; and the natural wetlands in lower reaches of the Yellow River delta have been reduced by about 52.8% in the past 30 years [1]. This has also led, to some extent, to the emergence of its fragile ecosystem, serious localized ecological degradation, and long-term water-sand imbalance.
China has conducted a series of works around the Yellow River Basin’s ecological protection and high-quality development. From 2018-2021, the GDP of the Yellow River Basin increased from 22.99 to 28.74 trillion yuan, with a growth rate exceeding the national average. The vegetation cover has increased by 1.34 percentage points, ecosystem degradation has been basically curbed, and the quality of ecosystems in 38.31% of the region has shown an improving trend. The water-sand regulation system has been initially built; the amount of soil erosion has been sharply reduced from 1.6 billion to 200 million tons/year. The ratio of Class I-III sections of the Yellow River increased by 11.8% compared to 2015, and the ratio of inferior Class V sections has decreased by 4.1%. As the blood and lubricant of social development, green finance supports the integrated realization of development goals of ecological protection, economic growth, cultural heritage and innovation, and overall poverty alleviation. Optimizing the role of green finance makes it possible to promote ecological protection and high-quality development. And is green finance (GF) intrinsically linked to green development? Can it promote ecological protection and high-quality development (EPHD)? What is its mechanism of action? It is still unknown. In view of this, this study explores the path of GF to support EPHD by using data from cities along nine Yellow River provinces.
Green finance, which is offered via financial instruments such as bonds, investments, and funds, is a key way to promote resource allocation in economic and environmental protection sectors and a means to realize the green transformation of development mode [2]. Research on GF began in the 1990s when the concept of GF was first proposed [3], which laid the theoretical framework for subsequent GF. Related topics on GF have received great attention, but theoretical research on it has progressed slowly; many scholars focus on the impact of GF on the economy [4-6]. Some scholars argue that the development of GF promotes economic development [7], while some have the opposite view [8]; they believe that GF will have a negative impact on the economy in the short term. Some scholars explore the economic benefits generated by GF from a micro-enterprise perspective of enterprise investment and financing [9-11], green production [12, 13], financial performance [14], and so on. In addition, many scholars have also focused on the impact of GF on ecological protection and environmental governance [15-17]. Specifically, some scholars confirm GF’s CO2 reduction effect [18, 19]; some argue that GF promotes high-quality energy development [20, 21]; and still others argue that GF inhibits green R&D and may constrain green development [22, 23].
Ecological prioritization and green development are the main objectives of EPHD, and the key to green development is improving green economy efficiency (GEE). GEE is economic efficiency after considering resource inputs and environmental costs, which integrates both environmental and economic connotations [24] and, to a certain extent, represents EPHD. Research on the GEE focuses on two aspects. One is measurement, and the typical methods include Stochastic Frontier Analysis (SFA) and Data Envelopment Analysis (DEA) [25-27]. More widely used are DEA models, which scholars have improved to overcome the shortcomings of traditional DEA, such as SBM-DEA [28-30], super-efficient DEA [25], GRA-DEA model [31], etc. Another is influencing factors. Factors affecting the GEE are multifaceted, mostly focusing on the macro area [32]. It is recognized in the existing literature that the digital economy [33- 35], environmental regulation [25, 36, 37], renewable energy [24], energy consumption [38], and technological innovation [39, 40] are the main factors affecting the GEE. In addition, studies on the GF and the GEE are mostly focused on exploring provincial data; some scholars explored the impact of the GF on the GEE based on 30 provinces in China [41, 42]. Some explored the impact of green credit on the GEE using credit as an entry point [43, 44].
Based on this, this study tried to land on the Yellow River Basin to examine the relationship between GF and EPHD from a city perspective. Specifically, this study measured the GEE and GF of cities in the Yellow River Basin based on the global super-efficiency SBM-DEA and the multi-indicator comprehensive evaluation method, respectively. This study empirically analyzed the impact of GF on EPHD in the Yellow River Basin and examined the path mechanism of GF affecting EPHD. This study conducted a heterogeneity analysis based on the differences in characteristics of different cities. Compared with existing studies, this study tries to contribute in the following aspects: first, it enriches the study on GF and GEE and reveals the mechanism paths and heterogeneity characteristics of GF affecting EPHD. Most studies have not yet formed a theoretical framework for GF to promote EPHD. This study tries to construct a theoretical framework for GF to influence EPHD in the Yellow River Basin and explore the influence mechanism between the two based on perspectives of green innovation, environmental regulation, and industrial structure. Second, this study refines the research perspective and takes prefecture-level city data as a research sample to overcome the homogeneity error of provincial data. This helps to explore the heterogeneous impacts of GF on EPHD in the Yellow River Basin by focusing on the differences in the characteristics of different cities and provides a new urban perspective for realizing EPHD. Third, it is to explore the green development of the Yellow River Basin in a targeted way to provide a reference for the future EPHD. At the same time, it points out a specific direction for GF to help the Yellow River Basin realize the “double-carbon” goal and high-quality economic development.
The remainder is organized as follows: Part Ⅱ describes theoretical analysis and research hypotheses. Part Ⅲ is the research design and model construction, focusing on this study’s setting of core variables. Part Ⅳ measures and analyzes EPHD of the Yellow River Basin and the evolutionary characteristics of GF. Part Ⅴ is the empirical analysis part of this study, which explores the effect of GF on EPHD of the Yellow River Basin and conducts the robustness test and endogeneity test. Further, this study verifies the mechanism path by constructing a mediation effect model, and based on environmental pollution, financial expenditures, and marketization, this study explores the heterogeneous effect of GF on EPHD of the Yellow River Basin. Part Ⅵ is the conclusion and policy implication.
Theoretical Analysis and Research Hypothesis
Impact of Green Finance on Ecological Protection and High-Quality Development
The positive driving effect of GF on EPHD is becoming a consensus. With green as its core, GF solves the problems of imperfect financing mechanisms, financing risks, and high environmental compliance costs through the selective attraction of capital investment, provision of financial support, and other aspects of financial services. First, GF is accompanied by increasing environmental information disclosure requirements [45]. Enterprises applying for green credit are required to disclose relevant information on pollution emissions, energy consumption, green production, and other aspects in accordance with the requirements of the government. This is conducive to alleviating the contradiction between the allocation of credit funds and environmental protection externalities, internalizing environmental protection costs into an enterprise’s production process, and guiding the flow of credit funds to green targets. It also solves the problem of asymmetric information between supply and demand, enhances investors’ willingness, and provides more resources and funds for green production.
Second, China’s diversified green financial system is to make a reverse selection of environmental protection projects. Financial institutions have established a set of green identification systems, which specify in detail the applicable objects of GF. Traditional “three-high” enterprises such as metallurgy, iron and steel, paper making, coal, and so on have greater difficulty obtaining funds and even high punitive loan interest rates. This inadvertently increases enterprises’ production costs and borrowing difficulty, forcing them to actively transform into high-value-added and low-pollution industries [46]. In addition, GF conveys environmental awareness and high-quality development concepts to the public through signaling mechanisms. To change the status quo of green development, the government has implemented many measures, which have conveyed to the outside world the government’s strong signals and determination to firmly develop GF. The policies related to GF have strengthened the market’s expectations for green development, with more resources flowing to green enterprises and green projects. Enterprises are also more inclined to take the initiative in adjusting inputs of factors of production and shifting to green and resource-saving models to enhance their competitive advantages.
Based on this, we propose the following hypotheses:
H1: Green finance can promote regional ecological protection and high-quality development.
Impact Mechanisms of Green Finance on Ecological Protection and High-Quality Development
As the core content of China’s deepening financial reform, how does GF play a role in EPHD? According to the characteristics of GF development and related policy documents, this study explores the impact of GF on EPHD by choosing three paths: green innovation, environmental regulation, and industrial structure.
First, green innovation is usually characterized by high investment risk, strong uncertainty, and a long return cycle [47], which requires local governments and financial institutions to give stable financial support to innovation subjects. China’s green financial system has set up a series of special funds and subsidy programs for energy saving, emission reduction, and green development, which stimulate the innovation body to carry out green R&D through fee reduction or financial incentives to offset external environmental protection costs. It promotes the transformation of micro-enterprises into greening and environmental protection. At once, GF can provide financial support for innovation activities beforehand, risk management during the process, and compensation for failure afterward [48], which can provide certain protection for innovation subjects at all stages, reduce green innovation risk, and ensure its success. As for micro-enterprises, they are also inclined towards green innovation to change production modes and improve the GEE to reduce environmental protection and green production costs. Therefore, GF stimulates urban green innovation by providing green funds and pre-, mid-, and post-guarantees to micro-entities, thus improving EPHD.
Second, the hypothesis of “innovation compensation” suggests that appropriate environmental regulation drives technological innovation and increases enterprises’ output and profits, thereby compensating for the environmental costs of their response to regulation. This is conducive to enterprises gaining a competitive advantage in green development, creating an innovation compensation effect. GF itself has certain environmental regulation attributes. In the development process of GF, a series of green funds and green investment projects have been set up, which have the reverse selection function on local enterprises and industries, effectively improving the environmental regulation level [49]. Financial institutions screen out green enterprises and give them certain credit preferences. While for polluting enterprises, they restrict the amount of borrowed funds and increase the credit interest rate [50]. It directs the flow of funds to industries with low environmental pollution and high economic development. This means that enterprises with poor environmental performance are not only penalized by environmental regulations but also subject to financing constraints brought by GF, facing double pressure. Enterprises are forced to invest more resources in green technology research, develop more efficient and greener production processes, and adopt energy-saving technologies. This promotes local ecological protection and high-quality economic development.
Third, the upgrading effect of GF-driven industrial structures essentially replaces inefficient and heavily polluting industries with high-efficiency and environmentally friendly ones. Through the green identification mechanism, GF gives lower loan interest rates and more borrowing funds to enterprises engaged in green production [51]. This can guide credit funds flow from high-pollution, high-emission, low-value-added industrial enterprises to environmentally friendly, high-value-added tertiary industries. This also can optimize the allocation of resources among industries and gradually create an industrial structure upgrading “dividend”, which will promote economic growth under the premise of realizing green development [52]. In addition, green funds provided by GF provide financial support for enterprises’ green transformation. Enterprises recruit more scientific and technological talents to innovate and actively collaborate with universities, research institutions, and other green innovation subjects. This can provide human capital for green development and increase employment in the third industry [53]. Therefore, with the decline of environmental carrying capacity, to alleviate the contradiction between environment and economy, the government is bound to guide the adjustment of the secondary and tertiary industries through GF and realize dual goals of environment and high-quality economic development through upgrading industrial structure.
Based on this, we propose the following hypotheses:
H2: Green finance achieves regional ecological protection and high-quality development by increasing green innovation, enhancing environmental regulation, and optimizing industrial structure.
Research Design
Research Framework Design
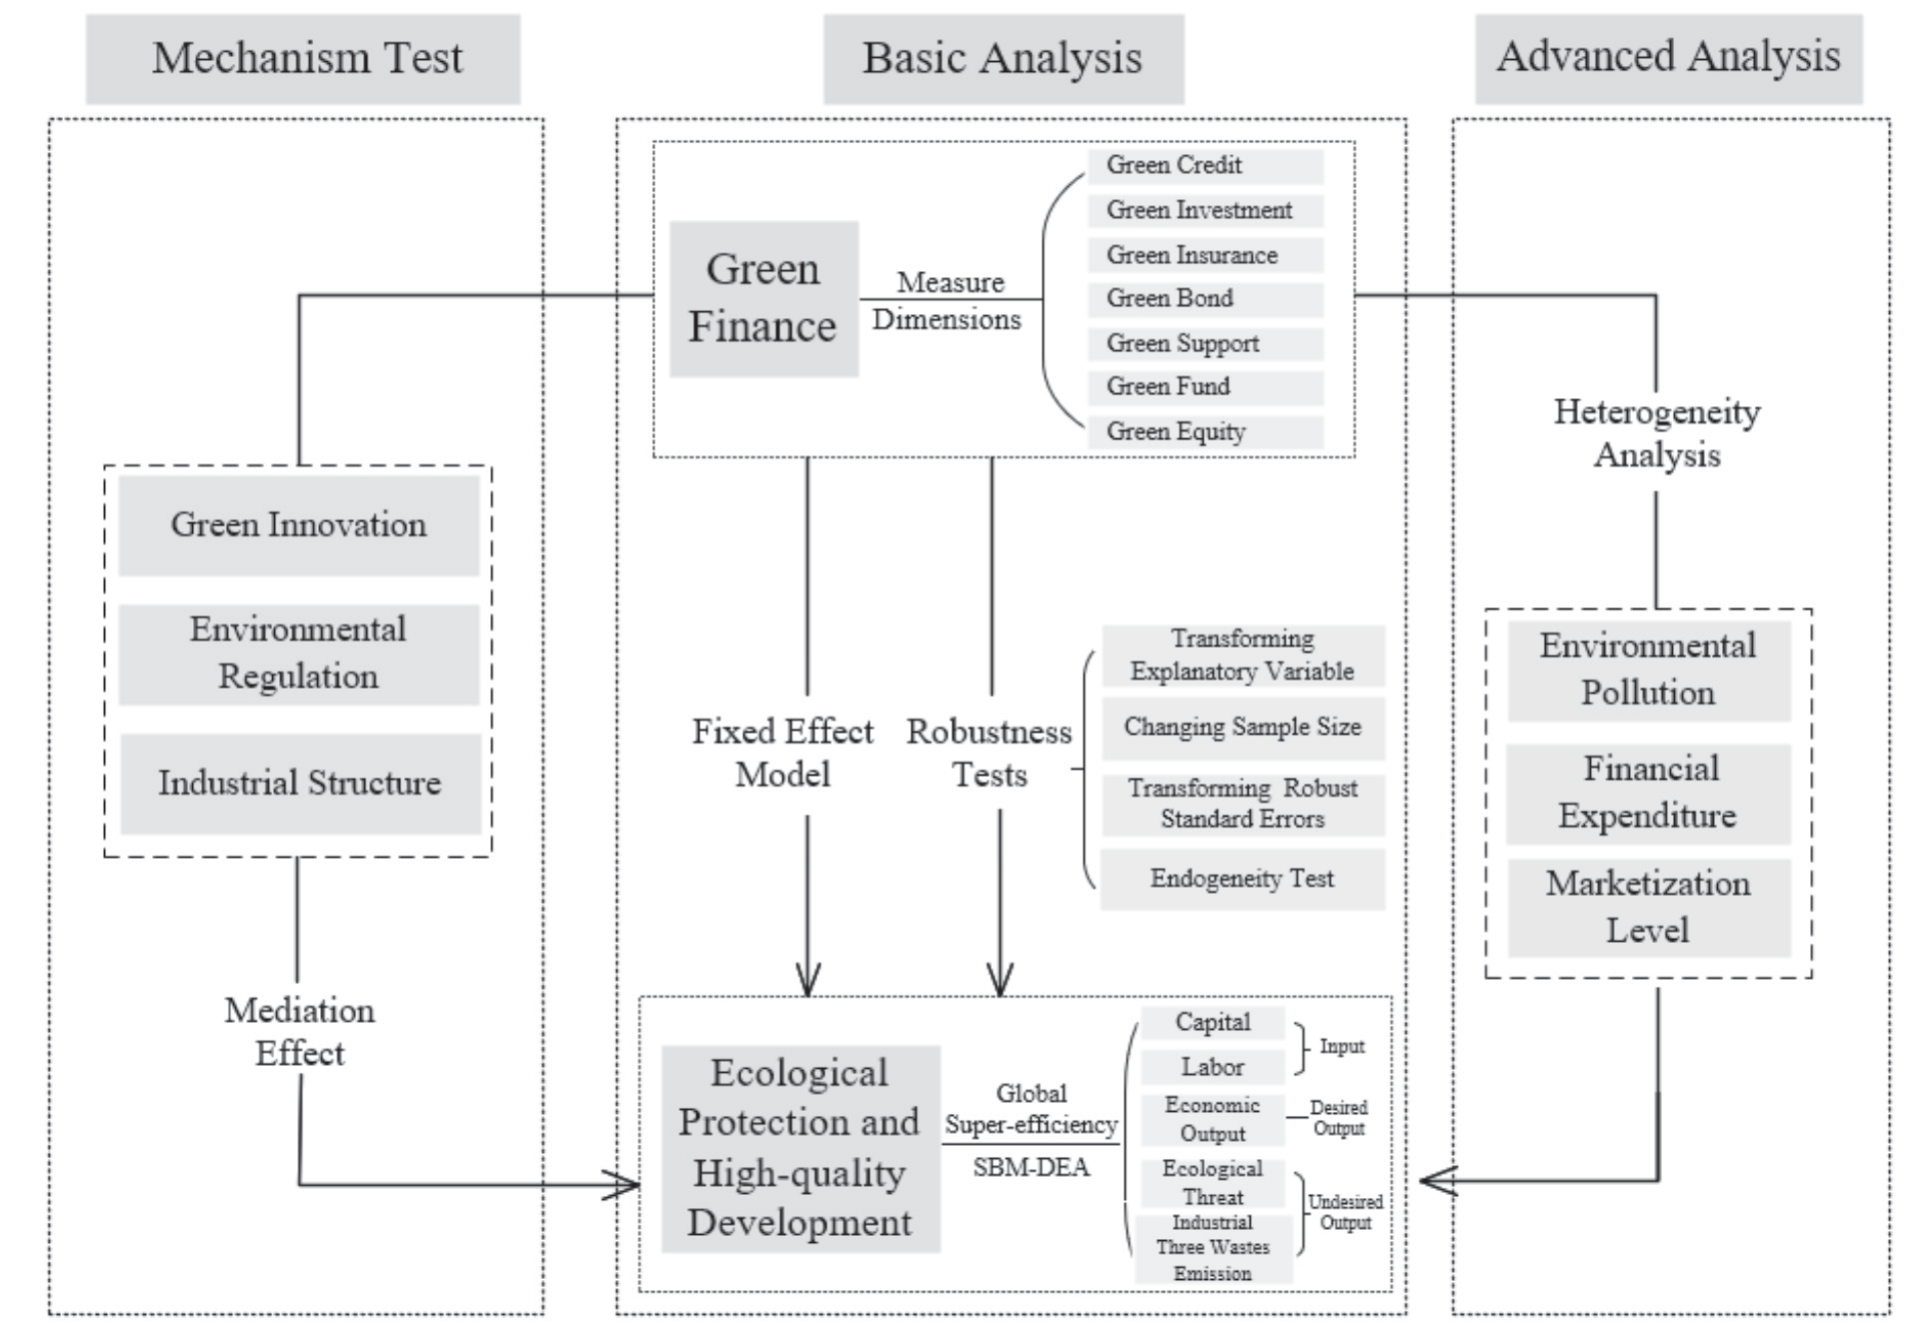
This study designs a research framework, as shown in Fig. 1, to explore the relationship between GF and EPHD in the Yellow River Basin in depth.
First, this study constructs and measures two core variables. We measure the GEE of cities in the Yellow River Basin using global super-efficiency SBM-DEA, which is used to indicate EPHD. This study measures GF in the Yellow River Basin based on seven dimensions of green credit: investment, insurance, bond, support, fund, and equity. Further, the two variables’ spatial and temporal evolution characteristics are analyzed. Second, to test the impact of GF on EPHD, this study constructs a fixed effect model and conducts three tests to ensure the robustness of basic conclusions. Finally, we use the mediation effect model to explore three mechanism paths of GF affecting EPHD, i.e., green innovation, environmental regulation, and industrial structure. This study conducts a heterogeneity analysis based on three perspectives: environmental pollution, financial expenditure, and marketization level.
Measurement of Green Economy Efficiency
Global Super-Efficiency SBM Model
We use the global super-efficiency SBM-DEA to measure the GEE with reference to Tone [30] and Chen and Yao [29] as follows:
Assume that there are k decision-making units (DMUs), which means that k cities are assumed in this study. For each DMU, there exists an input, which can be expressed as x = (x1, .... xN) ∈ RN+. There are also M desirable outputs and I undesirable outputs, which satisfy y = (y1, .... yM) ∈ RM+ and c = (c1, .... cI) ∈ RI+, respectively. In general, delineating production boundaries through cross-sectional data can provide insight into the efficiency of a given unit, but it can complicate longitudinal comparability. Given that DMUs located at the production boundary have an efficiency score of 1 on their own, it is important to ensemble the super-efficiency paradigm to differentiate between optimally performing DMUs. Therefore, to ensure that efficiency metrics are consistent across cross-sections and DMUs, we attempt to construct a vertex boundary from the perspective of global DMUs. In the observation horizon of this study, the metrics for k cities are denoted as (xk, yk, ck). In a closed, finite production horizon, the principles of free disposal, zero portfolio, and weak disposal of assets are followed. We utilize data envelopment analysis (DEA) to construct the model:
where zk denotes the weights of the global observations, which tend to be 1 and are always positive. If the weights are not combined into a single instruction, this framework can be characterized as scale reward invariant in a production environment. Using the SBM distance function, we carve an efficiency profile for each DMU based on the characteristic of constant returns to scale:
(2)
In Equation (2), sx ∈ RN, sc ∈ RI, and sy ∈ RM reflect the surplus of inputs and undesirable outputs and the shortfall of desirable outputs, respectively. When ρ = 1, i.e., sx = sy = sc = 0, DMU is optimally efficient. Overall, the above equations designate the DMU on the boundary as the most efficient unit. We adopt a super-efficiency calculation method to dissect the relative efficiency among DMUs.
(3)
Equation (3) takes ρ>1 as an optimization condition, i.e., DMU efficiency is optimized. Overall, this equation designates DMU on the boundary as the most efficient unit. In the above analytical framework, the efficiency indicator ρ≥1 is determined by non-expected super-efficiency SBM. To measure the GEE under the condition of variable returns to scale, condition
Measurement of Green Finance Development Level
Multi-Indicator Comprehensive Evaluation Method
This study continues to define and measure GF, using a multi-indicator comprehensive evaluation method to assess GF development using 103 cities in nine provinces along the Yellow River as a research sample. Specifically, for city i, the green finance index GFi is used to measure GF, and the calculation model of GFi is:
where n is the total number of indicators, ωk is the weight of indicator k (
Variable Selection and Data Source
Based on the principles of scientific, comparable, and accessible indicator selection, we select seven dimensions of green credit, investment, insurance, bond, support, fund, and equity to construct an indicator system for GF from the perspective of the green financial market. Table 2 shows the specific indicators for assessing green financial development.
Table 1.
Indicator system for measuring the GEE.
| Type of variable | Variable | Indicator |
|---|---|---|
| Input | Capital | Capital stock2 |
| Labor | Urban social employment3 | |
| Desirable output | Economic output | Real GDP4 |
| Undesirable output | Ecological threat | CO2 emission |
| Industrial “three wastes” emissions | Industrial wastewater emission | |
| Industrial SO2 emission | ||
| Industrial smoke emission |
Table 2.
Indicator system for evaluating the GF.
Test for the Impact of Green Finance on Green Economy Efficiency
Fixed Effect Model
The traditional OLS estimation will ignore the effects of both inter-cross-section and time trends in panel data, while the fixed effect model can consider both aspects at the same time. Therefore, to explore the direct impact of GF on EPHD of the Yellow River Basin, this study constructs a fixed effect model:
where GEEi,t denotes the GEE of city i in year t, and GFi,t is GF of city i in year t. The variable μi denotes a city-fixed effect, which is used to measure all influences that do not change over time. νt denotes time-fixed effect, which is used to measure influences that only change over time and are unrelated to the city. The variable Xi,t denotes control variables, and εit is a random disturbance term.
Mediation Effect Model
To further verify the impact path of GF to support EPHD in the Yellow River Basin, a mediation effect model is constructed:
where Mediai,t denotes the mediating variable. Mediating variables include green innovation (GI), environmental regulation (ER), and industrial structure (IS). The mediation effect test needs to satisfy these conditions [57]: 1) The coefficient of β1 in Equation (5) is statistically significant. 2) The absolute value of θ1 in Equation (7) is smaller than β1 in Equation (5) in the case that both α1 in Equation (6) and δ in Equation (7) are significant.
Variable Selection and Data Source
(1) Explained variable: green economy efficiency (GEE). GEE reflects both the region’s economic and environmental development. Of these, economic development reflects efficiency improvement and technological progress; environmental development reflects green development. Therefore, this study uses the GEE to indicate EPHD in the Yellow River Basin. This study uses the Data Envelopment Analysis (DEA) based on global super-efficiency SBM to measure the GEE, and the resulting indicator is the GEE explored in this study (see next paragraph for specific accounting method). At the same time, this study also measures the GEE (GEEv) using the same method based on the case of variable returns to scale to further enhance the credibility of conclusions. In addition, due to the lack of data for some cities, based on data availability, this study uses a total of 103 cities in the Yellow River Basin from 2011 to 2021. Relevant data are from the China Urban Statistical Yearbook and the China Energy Statistical Yearbook.
(2) Key explanatory variable: green finance development level (GF). This study uses a multi-indicator comprehensive evaluation method to assess GF. This index is measured from the green financial market perspective by choosing seven dimensions. See next paragraph for specific measurements. All the above data are from the China Statistical Yearbook and the CSMAR database.
(3) Mediating variables: green innovation (GI), environmental regulation (ER), and industrial structure (IS). To test the impact path of the GF on the GEE, the above three mediating variables are introduced for examination. Among them, this study uses the number of green patents granted in each city as an indicator to measure local green innovation, which is from the China Research Data Service Platform (CNRDS). Compared with green patent applications, green patents granted are more reflective of actual technological enhancement and effectively reflect local green innovation quality. Referring to previous literature [58], this study constructs an environmental regulation intensity variable based on the frequency of “environmental protection” related words in the government work report. For industrial structure, the value added of tertiary industry as a share of GDP is used to measure industrial structure upgrading, which is from the China Urban Statistical Yearbook.
(4) Control variables: to restore as comprehensively as possible the differences in economic and social environments faced by each city, and taking into account existing relevant literature, economic development (Pgdp), energy structure (ener), green coverage (Gre), urbanization level (Urban), and labor reserve (Pop) are added as control variables. The above data come from the China Urban Statistical Yearbook, the China Energy Statistical Yearbook, and the CSMAR database.
A total of 103 cities in nine provinces along the Yellow River are studied, and balanced panel data of each city for 2011-2021 are used for this study. This study uses linear interpolation to fill in the gaps for some of the missing data. The relevant variables we used are described in Table 3, and the descriptive statistics are shown in Table 4.
Evolution of Green Economy Efficiency and Green Finance in the Yellow River Basin
Spatial and Temporal Evolution of Green Economy Efficiency
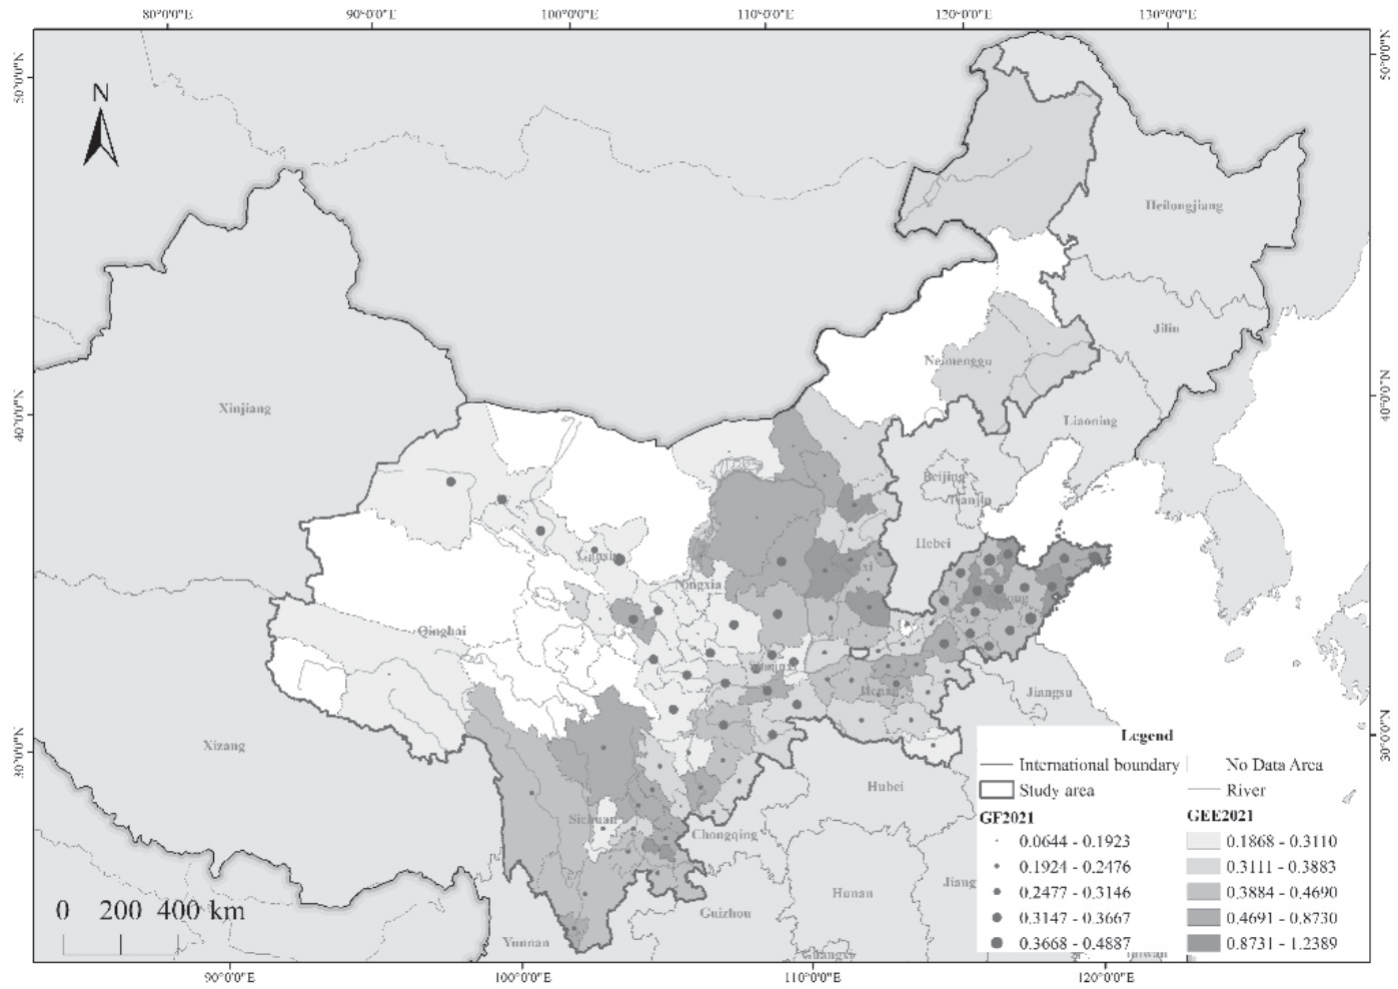
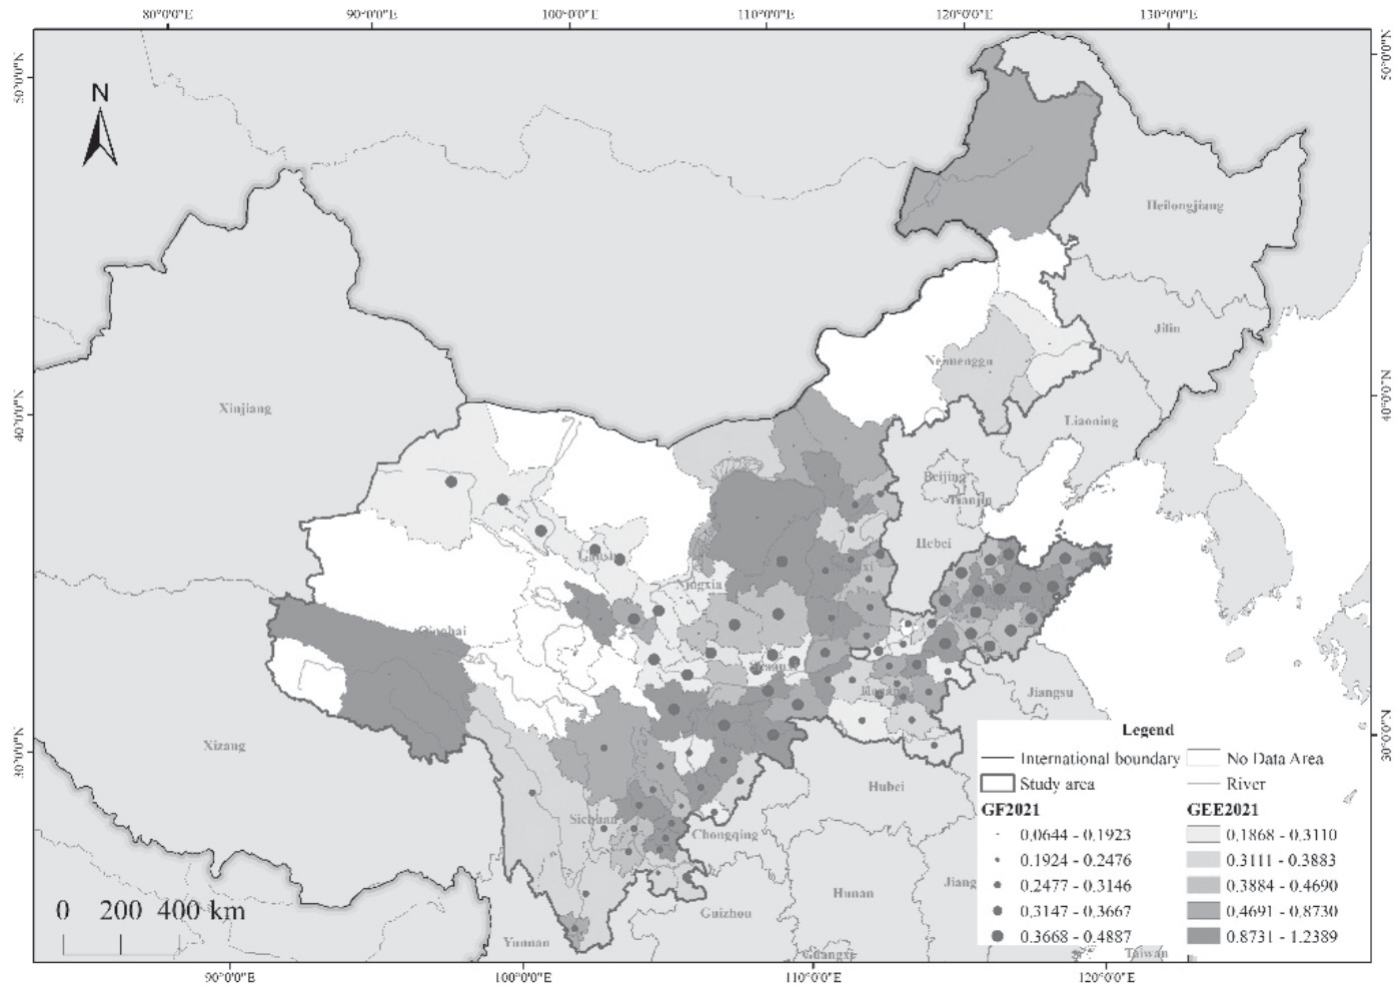
This study uses the global super-efficiency SBM-DEA to calculate the GEE of cities in the Yellow River Basin from 2011 to 2021. The results show that the GEE of the cities in the Yellow River Basin varies considerably but generally shows an upward trend. To show the evolution process of the GEE in the Yellow River Basin more clearly, we focus on the GEE for the two years 2011 and 2021 (Fig. 2 and Fig. 3)5. The results show that in 2011, the cities in the northern part of Sichuan Province had the highest GEE. Areas with a good ecological environment, low pollution emissions, and fewer undesirable outputs have more regional GEE. The GEE was also higher in cities in the middle and lower reaches of the Yellow River Basin, which in turn were driven by economic development. Whereas in 2021, the cities in Qinghai Province, eastern Shaanxi Province, and southern Inner Mongolia had higher GEE, which was closely related to the economic development of these cities. There is a relatively high level of economic development in Shandong Province and Henan Province. The gradual increase in emphasis on environmental protection and pollution control reduced undesirable outputs. This contributed to higher GEE.
Overall, from 2011 to 2021, the GEE of cities in the upper and middle reaches of the Yellow River Basin increased significantly. The color corresponding to the GEE of the cities in eastern Inner Mongolia noticeably lightened, which is related to its more backward economic output. Meanwhile, in 2011, the GEE of Shandong Province was relatively high. In contrast, the GEE of Xining, Ordos, Yulin, and Xi’an was later at the forefront of the Yellow River Basin in 2021.
Spatial and Temporal Evolution of Green Finance Development Level
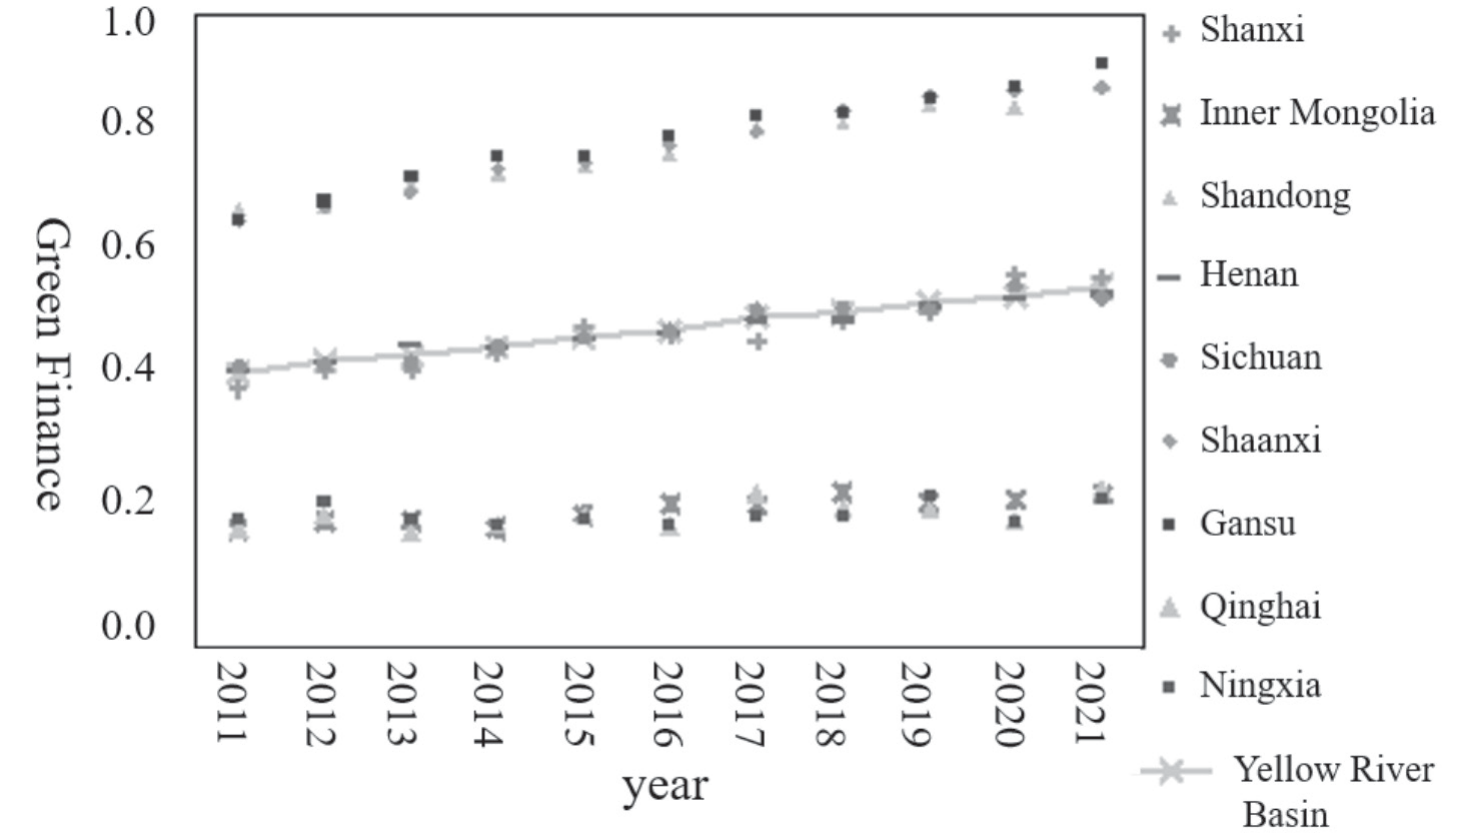
The measurement results of the multi-indicator comprehensive evaluation method show that GF in the Yellow River Basin has improved from 2011 to 2021. The green finance development index grew from 0.4342 in 2011 to 0.5699 in 2021 (Fig. 4), an increase of more than 30%. Among them, the year with the fastest growth in GF is 2017. This is due to the Guiding Opinions on Building a Green Financial System issued in August 2016, which clearly set out eight tasks, including the development of green credit, securities, development funds, and insurance, as well as the improvement of environmental rights and interests markets, the development of local pilots, and the promotion of international cooperation. All of these tasks were practically implemented in 2017, which became an important force driving the remarkable growth of China’s Green Finance Index in 2017.
Specifically, Shandong, Shaanxi, and Gansu Province have relatively high green financial development levels, with annual average GF indices reaching 0.7903, 0.7930, and 0.8070, respectively. Among them, Shandong Province’s green finance development started earlier, had a better foundation, and was ranked first in the Yellow River Basin in 2011. However, it was slightly weaker than the Shaanxi and Gansu Provinces in the following years. Since 2012, the highest level of GF in the Yellow River Basin has appeared in Gansu Province and has maintained a trend of higher growth year by year. Except for 2018-2019, when it was surpassed by Shaanxi Province, Gansu Province has always maintained the first place in the Yellow River Basin in all the years of GF. In contrast, the GF of Qinghai Province, Inner Mongolia Autonomous, and Ningxia Hui Autonomous Region still lags behind, and the GF of these three provinces in 2021 is still less than the average level of the Yellow River Basin in 2011. For these three provinces, GF still has significant space for development.
Similar to the changing trend of GF in the Yellow River Basin, the GF of the 103 cities in the Yellow River Basin is also increasing (Fig. 2 and Fig. 3). Compared with 2011, GF realized an increase in 2021, and the dots that characterize the level of GF in Fig. 2 and Fig. 3 all increase in general. Specifically, in 2011, compared with other cities, cities in Shandong Province had relatively high levels of GF, with Qingdao, Weihai, and Binzhou standing out, while cities in Inner Mongolia had lower levels of GF. By 2021, in addition to the still high level of GF in cities of Shandong Province, cities like Xi’an, Baoji, and Yan’an in Shaanxi Province, and Lanzhou and Jinchang in Gansu Province gradually came later, exceeding 80% of the cities. However, the GF development level in Inner Mongolia is still relatively backward, especially in Ulanqab and Bayannur. In addition, from 2011 to 2021, Baoji in Shannxi Province, Jinchang in Gansu Province, and Liaocheng in Shandong Province had the largest increases in GF, and GF in the eastern cities of Sichuan Province also increased considerably.
Table 3.
Measurement of variables.
Table 4.
Descriptive statistics.
Results and Discussion
Results of the Impact Effects Test
Existence Test for Effects
Using Equation (5) for estimation, this study finds that GF positively contributes to EPHD in the Yellow River Basin (Table 5). Columns (1)-(2) of Table 5 demonstrate the impact of the GF on the GEE (based on constant returns to scale). Column (1) presents the estimation results without control variables included. It shows that the estimated coefficient of GF is significant at the 1% level of 0.5805, which suggests that GF has a positive contribution to the GEE during the observation period selected in this study. Column (2) shows the model estimation results after adding five control variables: economic development, energy structure, green coverage, urbanization level, and labor reserve. It shows that the estimated coefficient of GF is 0.5837, which is positive at the 5% level. For every one-unit increase in GF, EPHD of the Yellow River Basin, as measured by the GEE, there will be an increase of 0.5837 units. This is due to the increase in green finance, which means that local government guides the popularization of green financial instruments, strengthens the environmental access threshold for micro-entrepreneurs to obtain loans from financial institutions, and provides financing for environmentally friendly projects, which has a positive effect on the local environment. On the other hand, it also indicates that in the process of GF, the structure of the finance market is gradually improved, which reduces the financing constraints faced by real enterprises and has a favorable effect on local economic development. Combining the above two aspects, GF can positively affect EPHD of the Yellow River Basin, which verifies H1.
To further explore the impact of the GF on the GEE, we test this impact effect again using the GEE measured by SBM-DEA based on variable returns to scale [29], and results are shown in Columns (3)-(4) of Table 5. As can be seen from the results, the coefficient of GF is positive, regardless of whether control variables are included. This again verifies H1 that GF can significantly enhance EPHD.
Results of Robustness Tests
To test the robustness of the above findings, we use three methods: transforming explanatory variables, changing sample size, and transforming robust standard errors method. We also test whether GF’s supportive role for EPHD in the Yellow River Basin still exists.
First, transforming the explanatory variable. In the above, this study measured the GEE based on global super-efficiency SBM-DEA with constant returns to scale and variable returns to scale, respectively, which was used to measure its EPHD. While there are various methods to measure the GEE, it is unknown whether the final conclusions obtained are consistent with this study if other measurement methods are used. Therefore, to make the benchmark conclusions of this study more robust, the Cobb-Douglas production function [59] is used to remeasure the GEE (GEEcd) and conduct a robustness test. The results are shown in Column (1) of Table 6. These show that the effect of the GF on the GEE is still positive and significant, indicating that GF can significantly enhance EPHD in the Yellow River Basin, which is consistent with the conclusion of benchmark regression. This also further verifies the robustness of the basic conclusions.
Second, changing the sample size. Compared with general cities, municipalities, separately listed cities, and provincial capitals may have more outstanding performance in terms of economic development, policy implementation, and environmental protection. Therefore, to reduce the biased nature of the sample, this study separately lists cities and provincial capital cities after eliminating the municipalities and re-regresses the remaining 94 cities, and the results are shown in Column (2) of Table 6. These show that GF enhances the GEE at the 1% significance level, i.e., GF still positively contributes to EPHD in the Yellow River Basin. This once again verifies the robustness of this study’s conclusions.
Third, transforming the robust standard errors method. In the benchmark regression, this study uses heteroskedasticity-robust standard errors for estimation. Whereas there may be autocorrelation in the perturbation terms of different years in the same city, the clustered robust standard errors can overcome such problems to a certain extent. Therefore, to ensure the validity of the estimation method, this study re-estimates the empirical model using city-individual clustering robust standard errors, and the results are shown in Column (3) of Table 6. In Column (3), the coefficient of GF remains significantly positive; this robustness test also does not change the baseline regression results, and the conclusion remains robust.
Results of the Endogeneity Test
For this study, cities with high levels of GF may be more inclined to focus on ecological and economic development, and there may be bidirectional causality between the explanatory variable (GF) and the explained variables (GEE). This mutual causality leads to endogeneity to some extent. Therefore, this study uses the Instrument Variables (IV) method to test it. Referring to previous literature [19, 20], this study uses the level of GF in the lagged period as IV to deal with endogeneity. GF in the previous period provides a reference for the development of GF in the current period, and the two are correlated. It is difficult for the current period to impact the value of the previous period, which has already occurred. This ensures that IV and the explanatory variables are independent of each other.
Table 5.
Benchmark regression results of the GF affecting the GEE.
Table 6.
Robustness test results of the GF affecting the GEE.
Based on this, this study uses the two-stage least squares (2SLS) method for estimation [60], and the results are shown in Table 7. Columns (1) and (3) demonstrate the results of the first stage, which indicate that IV satisfies the correlation. Furthermore, regardless of whether control variables are included, the P-value of the Kleibergen-Paap rk LM statistic remains 0.000, rejecting the null hypothesis of “under-identification of the instrumental variable”. This indicates that the IV used in this study does not suffer from under-identification issues. Similarly, both the Cragg-Donald Wald F statistic and the Kleibergen-Paap rk Wald F statistic are significantly greater than 10, rejecting the null hypothesis of “weak instrumental variable”. Columns (2) and (4) show the results of the second stage, in which the coefficient values of IV are significantly positive. This indicates that based on the instrumental variable method, the promotion effect of GF on EPHD in the Yellow River Basin still exists. This is consistent with this study’s basic conclusion and further proves our findings’ robustness.
Results of the Influence Mechanisms Test
This study analyses the enhancement effect of GF on EPHD mainly from three aspects: green innovation, environmental regulation, and industrial structure. The mediation effect model of Equations (6)-(7) is used for estimation to further analyze the mechanism paths of GF to promote EPHD, and the results are shown in Table 8.
Green Innovation Increasing Effect
GF’s capital financing and capital-oriented functions can effectively promote factor integration and resource allocation and potentially impact green innovation. This study verifies the impact of GF on EPHD of the Yellow River Basin through the green innovation enhancement effect, and the results are shown in Columns (1)-(2) of Table 8. As can be seen from the table, the coefficient GF of green innovation measured by green patent authorization is 6.1380 and passes the significance test, which means that GF can increase green innovation. From this, it can be inferred that the improvement of GF can guide capital flow to low-pollution green industries and force high-energy-consuming and high-pollution enterprises to carry out green innovation and clean production [61], significantly improving local green innovation. In Column (2) of Table 7, the coefficient of GI is significantly positive, which indicates that the increase in the number of green innovation results has a role in promoting the GEE. The coefficient of GF is 0.5498, which is significantly lower than in Table 5 (0.5837). This implies that green innovation does produce a mediating effect. To protect the environment and promote green development, GF provides financing and services for environmentally friendly green industries, giving related enterprises more funds for green innovation, thus promoting the green development of society. Green innovation contains the double connotation of green and innovation, which can improve enterprise productivity and development. Therefore, GF can improve green innovation and further contribute to EPHD in the Yellow River Basin.
Table 7.
Endogeneity test.
Environmental Regulation Enhancing Effect
Currently, the government regards environmental regulation as an important measure to protect the environment and realize the synergistic development of the environment and economy. Based on this, this study verifies the impact of GF on EPHD of the Yellow River Basin through the environmental regulation adjustment effect, and the results are shown in Columns (3)-(4) of Table 8. As seen from this table, there is a significant positive correlation between GF and environmental regulation in the Yellow River Basin. This is because GF directs capital flows to low-polluting enterprises and restricts the development of enterprises with poor environmental performance. GF has a reverse selection effect on local industries and significantly increases local environmental regulation levels [49]. In Column (4), the coefficient of ER is positive, indicating that there is also a positive relationship between the GEE and environmental regulation. Therefore, cities with a high level of GF will have a higher level of environmental regulation. High environmental regulation means that it is difficult for local enterprises to raise funds and has high barriers to entry, forcing them to undergo green transformation, thereby promoting EPHD. This proves that GF improves the GEE by enhancing local environmental regulation. In addition, the coefficient of GF in Column (4) is 0.5251, which is also lower than in Table 5, 0.5837, suggesting that environmental regulation plays a mediating role in the process of GF affecting the GEE. The hypothesis of “innovation compensation” suggests that appropriate environmental regulation will increase the incentives for enterprises to engage in technological innovation and promote green innovation, thereby compensating for their environmental costs. This increases the likelihood that enterprises will have access to green funds, easing the pressure on financing and allowing more resources and capital to be invested in the production process. While environmental protection is being promoted, the high-quality development of the local economy will also grow. Therefore, GF plays a role in environmental regulation and, thus, plays a positive role in promoting local GEE.
Table 8.
Mediation effect test results of the GF affecting the GEE.
Industrial Structure Upgrading Effect
The primary task of building a modernized socialist country is high-quality development, and industrial structure optimization means high-quality development. In this context, this study also verifies the mediating effect of industrial structure upgrading in EPHD affected by GF, and the results are shown in Columns (5)-(6) of Table 8. This table shows that GF has a role in promoting industrial structure upgrading, while industrial structure upgrading can further enhance city GEE. This is because GF can alleviate financing constraints of green and environmentally friendly enterprises, increase the cost and difficulty of obtaining credit funds for high-polluting and energy-consuming enterprises, and incentivize local enterprises to engage in green production. It can also strengthen the market selection mechanism of survival of the fittest and promote resource flow between different industries, thus adjusting the ratio of secondary and tertiary industries and optimizing the industrial structure [53]. In addition, the coefficient of GF in Column (6) (0.5340) is lower compared with Column (2) in Table 5 (0.5837), indicating that industrial structure upgrading does have a mediating effect. Adjustment of industrial structure usually implies an increase in the share of greener tertiary industry, which can bring higher added value and promote high economic growth, reduce energy consumption and pollution output, realize green development of the environment, and ultimately promote local EPHD.
In summary, the empirical analysis results of the mediating effect show that GF’s impact on EPHD of the Yellow River Basin mainly works through increasing green innovation, enhancing environmental regulation, and upgrading industrial structure, which verifies H2.
Results of Heterogeneity Analysis
To further understand the impact effect of GF, we analyze the environmental pollution status, fiscal expenditure level, and marketization level to deeply explore the heterogeneous impacts of urban characteristics in EPHD of the Yellow River Basin as influenced by GF (Table 9).
Based on Environmental Pollution Status
Environmental pollution status reflects the base level of regional EPHD. Referring to previous literature [62], this study uses the value of PM2.56 to represent city environmental pollution status and examines the similarities and differences in the promotion of EPHD by GF in cities with different baseline levels of the environment. According to the value of PM2.5, the environmental pollution level of sample cities is sorted from high to low, and sample cities with an environmental pollution level higher than the median are defined as high-pollution cities, while those lower than the median are defined as low-pollution cities to analyze the impact of the GF on the GEE of cities with different environmental pollution conditions. As shown in Columns (1)-(2) of Table 9, GF can improve local EPHD in cities with either high or low environmental pollution, which is significant at least at the 5% level. This is due to the green attributes of GF itself, which can promote local green development regardless of urban environmental pollution degree. In addition, this result passes the grouping test, which shows that the coefficients of these two groups can be compared; that is to say, compared with the highly polluted areas, GF enhances EPHD of low-pollution cities more obviously. This is due to the attributes of low-pollution cities; such cities usually have lower pollution control costs and environmental compliance costs, and enterprises are more likely to obtain green funds from banks, so GF has a more obvious role in enhancing the EPHD of low-pollution cities.
Table 9.
Heterogeneity test results of the GF affecting the GEE.
Based on Fiscal Expenditure Level
Fiscal policy has a guiding and promoting role for GF, which is an important support for GF, and the comprehensive use of fiscal and financial instruments has become an important measure to promote regional EPHD. To examine whether the impact of GF on local GEE is heterogeneous under different levels of fiscal expenditure, we conduct a relevant heterogeneity test. This study uses local fiscal budget expenditures to characterize the fiscal expenditure level of cities, which are ranked in order of size, and the median is taken. If a city’s fiscal expenditure level is smaller than the median, it is defined as a low fiscal expenditure city; otherwise, it is defined as a high fiscal expenditure city. The results of heterogeneity analysis based on fiscal expenditure levels are shown in Columns (3)-(4) of Table 9. The results show that the enhancement of GF on EPHD is more obvious in cities with higher fiscal expenditure levels, which suggests that fiscal expenditure strengthens the role of GF in enhancing the GEE. This is because cities with high fiscal expenditures have more capital supply, hold more resources to invest in environmental and economic development, provide strong financial support for local ecological environment restoration, pollution control, and production, and are more capable of realizing the improvement of local EPHD.
Based on the Marketization Level
GF is a market-oriented institutional arrangement; therefore, this study examines whether the role of GF on local EPHD is heterogeneous under different regional marketization levels. Here, the marketization index is used to characterize regional marketization development, and sample cities are divided into two groups according to marketization level for the heterogeneity test. In this study, the marketization level is ranked from high to low, with the median as the cut-off point. If a city’s marketization level is higher than the median, it is defined as a high marketization city; if the marketization level is lower than the median, it is a low marketization city. In particular, this study constructs the marketization process indicator [63]. The results are shown in Columns (5)-(6) of Table 9, where the increase of GF can significantly enhance EPHD in highly marketized cities, while the effect on the GEE of low marketized cities is not significant. This may be because, compared with low-marketized areas, the market development of high-marketized cities is more mature. The government’s intervention in bank and enterprise lending is lower, and it can give full play to the positive role of the market mechanism in financial market lending. It can also effectively provide enterprises with green funds to achieve local green economy development.
Conclusions
This study takes 103 cities in 9 provinces in the Yellow River Basin from 2011 to 2021 as research objects, uses global super-efficiency SBM-DEA to measure EPHD, uses a multi-indicator comprehensive evaluation method to measure GF, and analyzes the evolution and current situation of the GEE and the GF of cities in 9 provinces in the Yellow River Basin. Meanwhile, this study constructs the fixed effect and mediation effect model to test GF’s influence mechanism and role path to support EPHD and explore the heterogeneous effects of different city characteristics.
The conclusions obtained are as follows: first, the GEE of cities in the Yellow River Basin has increased significantly, and a continuous increase characterizes GF in cities in the whole basin. The GEE of the downstream cities remains at the forefront of the whole basin and is relatively stable, while the cities in the middle and upper reaches improve more. Three cities, Baoji in Shaanxi Province, Jinchang in Gansu Province, and Liaocheng in Shandong, have the fastest growth rate in GF. Second, GF has a positive effect on the GEE of the Yellow River Basin. This promotion effect passes three robustness tests: transforming explanatory variables, changing sample size, and transforming robust standard error method. It also similarly passes the endogeneity test. This means that GF significantly promotes EPHD in the Yellow River Basin. Third, green innovation, environmental regulation, and industrial structure have mediating effects in the process of GF affecting the GEE. In other words, GF can enhance the GEE by increasing green innovation, enhancing local environmental regulation, and improving industrial structure, which plays a positive role in EPHD. Fourth, the impact of GF on the GEE in the Yellow River Basin is heterogeneous. Different city characteristics have differences in GF’s impact on the GEE, mainly in environmental pollution status, fiscal expenditure, and marketization level. Specifically, compared with high-pollution cities, the promotion effect of GF on the GEE is more obvious in low-pollution areas; in cities with high fiscal expenditures and high marketization levels, the support effect of GF on EPHD is more significant.
Policy Implications
Based on the above findings, this study makes the following policy implications:
First, the role of GF in guiding funds should be brought into play. GF supports the economy’s transition to greening through green credit, bonds, insurance, carbon finance, and other financial instruments. Compared with coastal areas, the Yellow River Basin is less open to the outside world but has a stronger need for EPHD. Therefore, GF needs to strengthen its role as a financial guide. Specifically, the first is to give full play to the resource allocation function of GF through green financial instruments to reasonably guide industrial ecology and eco-industrialization development. The second is to increase the effective supply of all kinds of green financial instruments, especially to smooth the transmission mechanism to the real economy, to ensure that GF can play a role in EPHD.
Second, awareness of green development throughout the whole basin should be enhanced. Chinese-style modernization has put forward requirements for green transformation, and promoting greening and decarbonization development is a key link in achieving high-quality development. The Yellow River Basin is China’s economic carrying area, population gathering area, and the core area of the “two screens and three belts” ecological barrier pattern, but its natural ecology is fragile, and its economic development is lagging. Against this background, cultivating and enhancing green development concepts and awareness are necessary to improve EPHD. Specifically, the first is to enhance public awareness of green life, promote the greening of public consumption behavior, and strengthen the acceptance and recognition of GF in the public’s hearts. The second is to strengthen the awareness of green production in enterprises and implement the main responsibility of green development. The third is to enhance green development awareness in the region and promote the synergistic development of economic green environments.
Third, the innovation-driven role of GF should be brought into play. Innovation is the first impetus driving development. China explicitly calls for innovation in the environmental protection of the Yellow River to build it into an important benchmark for large river governance. However, most innovations in the field of ecological governance are characterized by a long research cycle, much preliminary investment, and relatively low market appeal and enthusiasm. Therefore, GF should be utilized to support and drive green innovation. Specifically, one is to carry out key innovations in ecological protection of the Yellow River, focusing on water-sand regulation and control and other key areas to carry out scientific experiments and technological research. The second is to improve development quality by relying on green innovations, accelerating the layout of major technological infrastructures, and increasing the cultivation and introduction of scientific, technological, and engineering professionals. The third is to establish and improve the channels for transforming achievements of scientific and technological innovations and improve the green technological investment and financing system.
Fourth, GF should be utilized as a development link. GF plays a role in economic growth and green development, and its regional linkage development is becoming increasingly obvious. Therefore, GF should integrate into EPHD through a strong linkage, realize GF to promote EPHD, and promote the regional synergy of “double linkage” development. Specifically, a linkage mechanism between green finance and economics should be established to realize green upgrading of the real economy by green financial services. A regional linkage development mechanism for GF should be established to improve the degree of synergistic development of various regions.
Fifth, a green financial guarantee system should be improved. GF requires the establishment of a sound guarantee system to better support EPHD. Specifically, one is to enhance the service capacity of GF, improve the support of policies and regulations, establish appropriate incentives and constraints, and solve the environmental externalities of projects. The second is to innovate green financial models, financial institutions, and markets to increase innovation and solve a series of problems green investment and financing face. The third is risk monitoring, and early warning systems should be strengthened to prevent green financial risks. Emergency disposal plans for green financial risks should be established to improve the capacity for emergency disposal. The fourth is that various departments should coordinate and link up to establish and improve internal reporting and accountability systems for major environmental and social risks.
Research Prospects
Although this study examines the impact of GF on EPHD in the Yellow River Basin as comprehensively as possible, there is still some room for expansion. First, this study focuses only on the Yellow River Basin, thereby limiting the applicability of its findings to other regions. Given that other regions have also realized the importance of GF for the economy and environment, the conclusion is unknown as to whether GF in these regions can lead to the improvement of the GEE. Therefore, subsequent studies can be conducted based on other regions or countries. Second, based on data availability, this study only uses city-level data for the Yellow River Basin from 2011-2021. Currently, accounting for GEE involves CO2 emission data, which can only be accounted for up to 2021. However, the data will be further updated in the next few years, and further extended research can be conducted in the future. Third, when exploring the impact of GF on EPHD, this study only explores three mechanism paths, while the conclusion is unknown whether other factors also have mediating effects. Therefore, the intrinsic mechanism of GF affecting EPHD can be further investigated in the future.

