

Introduction
Since the initiation of reform and opening up, China's economic growth model has propelled rapid development while concurrently precipitating significant environmental pollution and resource depletion. In response to the escalating ecological challenges, societal consumption patterns have quietly shifted, with environmental protection and sustainable development gradually solidifying as mainstream consensuses. The pervasive nature of environmental issues across the production process underscores the necessity for a departure from singular end-of-pipe solutions towards a more holistic approach. In this context, the green finance policy emerges as a pivotal instrument for fostering the sustainable development of the economy, rooted in environmental considerations within credit allocation. This policy can compel heavily polluting enterprises to engage in green innovation activities through measures such as differentiated loan standards, prompt disclosure of information by enterprises, channeling funds into environmental protection enterprises, and fostering the marketization of green products, all aimed at facilitating green economic development.
To advance environmental governance and promote green growth, seven ministries, including the People's Bank of China and the Ministry of Finance, issued the Guiding Opinions on Building a Green Financial System in August 2016. Subsequently, in June 2017, the State Council designated the first batch of five provinces and eight regions as green finance reform and innovation pilot zones. Later, in December 2019, Lanzhou New Area in Gansu Province was approved as a pilot zone for green finance reform and innovation. Consequently, under the guidance of a relatively comprehensive green finance system, the development of green finance has progressed rapidly.
In terms of quantity, as of June 2023, the balance of green credit in each pilot zone exceeded a trillion yuan, constituting over 10% of all types of loans, with the green finance product system growing increasingly diverse. From a qualitative perspective, the green finance evaluation scheme serves to comprehensively assess and oversee financial institutions' green finance products. Through the establishment of a scientific evaluation index and standard system, it ensures alignment with environmental protection and sustainable development goals, while simultaneously encouraging financial institutions to bolster support for green projects, thereby enhancing their risk management capabilities.
Enterprises, as micro-entities engaged in innovation activities, often confront the dual pressures of economic development and environmental stewardship. Green innovation emerges as a potent approach to reconcile these pressures, offering a pathway to economic advancement while mitigating environmental strains. It encompasses the adoption of novel technologies, methods, or strategies by enterprises to address environmental concerns and foster sustainable economic growth. Serving as a fusion of green development and innovation-driven initiatives, green innovation plays a pivotal role in harmonizing economic prosperity with environmental conservation. China's heightened emphasis on green development since 2020 has reached unprecedented levels. Notably, from early March 2021 to the end of April 2022, the country witnessed a substantial surge in green patent applications, with an increase of nearly 140,000 and over 210,000 green patent authorizations. These statistics vividly illustrate the mounting enthusiasm among domestic enterprises for green technology innovation, propelled by national policies. Consequently, exploring how green financial policies can promote green innovation is not only of great practical significance for the sustainable economic development and green transformation of enterprises in China but can also inspire developing countries to formulate targeted green financial policies in the light of their realities, and to incentivize and support enterprises to carry out green technological innovation activities.
Compared to the existing literature, this paper suggests several potential marginal contributions. First, while previous studies mainly focus on single green financial instruments such as green credit and green bonds, this paper delves into the comprehensive policy framework of green financial reform and innovation pilot zones. Second, existing studies mainly analyze the impact mechanism of green financial policies on green technological innovation from the perspectives of debt structure and financing costs, while this paper focuses on the perspective of credit resource mismatch. It enriches the research horizons of green finance and enterprise technological innovation and provides valuable insights for optimizing the allocation of financial resources and strengthening the construction of a green financial system in the future.
Theoretical Analysis and Research Hypotheses
Literature Review
Green Finance
The concept of green finance emerged within a context of growing recognition that the financial system must address the social and environmental challenges confronting the real economy. It embodies the dual objectives of financial resource allocation and environmental regulation, serving as a valuable complement to traditional environmental regulatory policies. Originating in Europe during the 1970s, it gradually garnered international attention. By the 1990s, foreign scholars began investigating ways to integrate environmental considerations into financial decision-making processes, aiming to foster sustainable economic, environmental, and social development. Their exploration of the interplay between finance and the ecological environment, along with sustainable development, led to the formulation of various theories and methodologies, laying the groundwork for the evolution of green finance.
Current research on green finance predominantly revolves around two focal points. From the macro level, it mainly focuses on exploring its impact on high-quality economic development [1], green transformation [2, 3], industrial structure transformation [4-6], low-carbon transition [7-9] and carbon emissions [10]. From the micro level, it mainly focuses on the two main bodies of enterprises and financial institutions and mostly concentrates on heavily polluting enterprises [3] and banks [11, 12], exploring the impact on corporate performance [13, 14], corporate carbon disclosure [15], technological innovation [7, 16, 17], green investment [18], and other aspects.
Enterprise Green Technology Innovation
The concept of "green technology innovation" stems from the broader realm of technological innovation, which traditionally focuses on the inventive transformation of science and technology. Building upon this foundation, scholars have introduced the notion of green technology innovation. This framework underscores the integration of environmental sustainability considerations into the technological innovation process, with the aim of fostering low-carbon, environmentally friendly, and sustainable economic development. Some scholars posit that green technology innovation embodies triple attributes encompassing environmental protection, technology, and economy [19], defining it as the application of novel theories and technologies of environmental protection to production and operations.
Currently, there is existing literature that examines the factors affecting green technology innovation within firms from both internal and external perspectives. Internal factors encompass the characteristics of the executive team, the company's internal absorptive capacity [20], social responsibility [21-23], and environmental investment [24, 25]. External factors can be categorized into three levels: firstly, environmental regulations at the national level [26, 27], institutional pressures [28, 29]; secondly, social media attention [30-32] and stakeholder pressure [33]; thirdly, market competition [34]. Given the limited independent green innovation motivation within enterprises, most studies predominantly explore the impact of policy interventions on green innovation. Command-and-control environmental regulations possess mandatory characteristics, exerting pressure on enterprises to conserve energy and reduce emissions, thereby fostering a propensity for green technology innovation under regulatory mandates and driving green technology innovation within enterprises. Market incentive-based environmental regulations exhibit flexible characteristics, which can offset the rise in regulatory costs and leverage proactive advantages through innovation compensation effects, thereby stimulating enterprise innovation and enhancing resource utilization efficiency.
The Impact of Green Finance on Enterprise Green Technology Innovation
Viewed through the lens of externality theory, green technology innovation demonstrates dual externality characteristics, namely the "technology spillover effect" and "environmental externality" [35]. Amidst the dual imperatives of economic development and environmental protection, government intervention measures, such as environmental regulations, are essential to incentivize enterprise innovation [36]. The relationship between green finance and enterprise green technology innovation can be understood through three perspectives: promotion, hindrance, and uncertainty.
Firstly, the "Promotion Theory," grounded in the "Porter Hypothesis" [37], posits that enterprises are compensated for innovation to offset costs, forcing them to innovate and achieving a win-win situation for both environmental protection and economic development. This theory not only facilitates internal financing and risk diversification for enterprises but also aids in market expansion and the establishment of competitive advantages [38], thereby fostering enterprise innovation. Secondly, the "hindrance theory," rooted in neoclassical economic theory, argues that environmental regulation reduces pollution while inevitably increasing the private costs of firms and sacrificing their competitiveness [39]. For many such enterprises, it may be impractical or insufficiently motivating to invest large amounts of capital in response to policy calls for technological innovation. Thirdly, the "uncertainty theory" suggests that while green finance policies may initially increase costs for highly polluting enterprises, disrupt capital flows, and impede green innovation, in the long run, companies will adapt by promptly addressing pollution, improving production processes, integrating green supply chains, enhancing product quality, and promoting green innovation due to the imposition of stringent pollution punishment mechanisms [40].
It is evident that the academic community has yet to arrive at a unified conclusion. The development of green finance in our country commenced relatively late, and the relevant system remains incomplete. Existing research has primarily focused on the largest and most widely affected aspect of green credit. However, there is a paucity of literature examining how green finance influences enterprise green technology innovation, and the impact mechanism remains unclear. Further research is warranted in this area.
Theoretical Analysis and Hypothesis Proposal
The main tasks of China's green finance pilot zones include the following: first, to improve the green finance standard system and build an evaluation system for green projects and other projects with local characteristics. Second, strengthening green financial supervision, establishing a green financial risk prevention mechanism, and promoting the development of green enterprises and industries. Third, give full play to the function of financial support for the real economy and explore diversified green financial products and service systems. Fourth, strengthen green financial incentives and promote the agglomeration of various financial factors and resources.
Green Finance and Enterprise Green Technology Innovation
Technological innovation serves as a primary driver of development, playing a pivotal role in economic transformation and fostering high-quality development. It is essential for enterprises to maintain a leading position in the fiercely competitive internal and external environment. Enterprise green innovation predominantly focuses on enhancing the green attributes of products, adopting more environmentally friendly processes, and developing green products, which are manifested in the quantity and quality of enterprise green patents [41]. Enterprise technological innovation is characterized by high risk, high returns, and a phased nature. Innovation activities necessitate substantial and sustained financial support, with funding requirements varying at different stages. However, many enterprises encounter the common problem of insufficient funds.
External financing represents a crucial source of funding for corporate innovation. Nevertheless, due to concerns regarding the risk of trade secret leakage, companies often refrain from actively disclosing innovative information, thereby increasing the difficulty of securing external financing. Particularly in the current context, China's financial market remains immature, with widespread financing constraints. Financial resources are predominantly allocated by banks, leaving many enterprises devoid of external financing channels. The persistent imbalance in the allocation of financial resources in our country is evidenced by the mismatch of financial resources, exacerbating external financing constraints for enterprises, impeding the acquisition of innovative resources, undermining factor pricing mechanisms, inhibiting innovative behavior, escalating research and development costs, curbing innovation investment, and ultimately resulting in low innovation efficiency. In contrast to traditional environmental regulatory policies, green finance pilot policies leverage market-oriented approaches to effectively allocate financial resources and incentivize increased social capital investment in the green sector [42, 43]. For instance, green finance can diminish investment returns and funding availability in polluting industries while stimulating innovation vitality. Based on the foregoing analysis, the following assumption is proposed:
H1: Green finance is conducive to improving enterprise green technology innovation.
The Mechanism of Promoting Green Technology Innovation in Enterprises through Green Finance Policies
For environmental protection enterprises, the implementation of green finance policies can incentivize investment in green innovation projects and promote green technology innovation by easing borrowing standards and alleviating financing constraints. Firstly, as environmentally friendly ideals continue to expand, banks seek new enterprises for investment, with green concepts representing attractive investment prospects. Consequently, banks may offer low-interest or interest-free discounts to green innovation projects, significantly bolstering enterprise enthusiasm for innovation investment and driving the development of green innovation projects. Additionally, traditional loan requirements often necessitate enterprises to mortgage fixed or intangible assets. However, small and medium-sized high-tech enterprises lack fixed assets, and their intangible assets, such as brands, may not yet be established, posing challenges in obtaining financing through conventional loans. Green financial policies can provide more favorable conditions, such as low-interest loans or loan guarantees, to enterprises that meet environmental protection standards, avoiding excessive collateralization of fixed assets or brands, lowering the cost of financing for enterprises, and promoting greater investment in technological research and development and green innovation. Based on the above analysis, the following assumptions are proposed:
H2a: Green finance improves corporate green technology innovation by alleviating financing constraints.
From the perspective of the "crowding out effect" of funds, green finance policies reinforce risk identification and management by banks and other financial institutions. Banks may adopt protective measures to safeguard against investing in research and development projects that compromise long-term sustainability when extending green finance loans to enterprises. Simultaneously, banks and other investors ensure the realization of green innovation projects by continuously injecting funds [44]. Green innovation necessitates substantial and sustained investment, with initial green project benefits often proving elusive, thereby requiring robust long-term financing support. While banks impose certain requirements on enterprise innovation projects, they concurrently ensure the sustainability of their investment funds, potentially offering funding subsidies for green innovation projects and stimulating research and development through increased investment in innovation activities. Based on the above analysis, the following assumptions are proposed:
H2b: Green finance enhances enterprise green technology innovation by increasing expenditure on innovation activities.
Credit mismatch, wherein limited credit funds are allocated to inefficient or ineffective enterprises or departments by the banking system, poses a significant challenge. To undertake green technology innovation, enterprises require substantial capital investment to drive research and development activities. Credit mismatch undermines the ability of motivated enterprises to access necessary research and development funds through the credit market, resulting in an unreasonable credit fund allocation structure and insufficient motivation for green technology innovation. Green finance policies mitigate this issue by effectively allocating resources, diversifying risks and benefits through financial markets, accurately evaluating expected returns, facilitating access to intellectual support such as R&D talent required for green technology innovation, and fostering enterprise enthusiasm for green technology innovation. Based on the above analysis, the following assumptions are proposed:
H2c: Green finance improves enterprise green technology innovation by reducing the mismatch of credit resources.
Materials and Methods
Data Source
This article focuses on A-share listed companies in Shanghai and Shenzhen from 2012 to 2021 as the research sample. Green patent data is sourced from the China Research Data Service Platform (CNRDS), while financial data is obtained from the Guotai An Database (CSMAR).
For data processing, the study excludes ST and financial companies, as well as samples with missing data, resulting in a total of 3,473 enterprise samples and 26,802 observation samples. To mitigate the influence of extreme values on the regression results, continuous variables are truncated at the 1st and 99th percentiles.
Variable Selection
(1) Dependent Variable: Green Technology Innovation (GP) is measured through various methods in the existing literature. Firstly, some studies measure it from the perspective of R&D investment. For example, some scholars gauge it by the number of scientific and technological personnel in industrial enterprises above a certain scale [45]. However, this approach may not effectively discern whether R&D investment pertains to the green field and may not accurately reflect the level of green technology innovation in enterprises. Secondly, innovation output is often utilized as a measure; for example, other scholars measure it by the ratio of green patent applications to all patent applications in a given year [46]. For instance, green technology innovation is categorized into independent innovation by enterprises and new technologies introduced by enterprises. They construct a nested decision tree for enterprise green technology innovation preferences to define indicators.
This article employs the natural logarithm of the number of green patent applications of enterprises to represent green technology innovation. Considering the existence of zero values in the number of green patent applications, the number of green patent applications for enterprises is incremented by 1 before taking the natural logarithm.
(2) Core Independent Variable: Green finance policy (Treated*Time). This article takes green finance policy as a quasi-natural experiment and defines whether the sample is a virtual variable of the experimental group as Treated. The province where the enterprise is registered belongs to the green finance reform and innovation experimental zone, and Treated is assigned a value of 1. Otherwise, it is 0. Define the dummy variable of policy implementation as Time, assign a value of 1 to the year of policy implementation and subsequent years; otherwise, it is 0. Use the interaction term between the time dummy variable Time and the policy dummy variable Treated as the core explanatory variable.
(3) Control Variables: This article controls for some enterprise-level variables that may have an impact on green technology innovation in enterprises, as shown in Table 1.
Table 1.
Variable definition and descriptive statistics table.
Table 2.
Descriptive statistics.
Model Construction
The double-difference approach allows for an assessment of the effectiveness of the implementation of policies enacted by the government at one point in time or at multiple points in time. As green finance policies are phased in at different points in time in different provinces, in order to avoid endogeneity issues and more scientifically test the effectiveness of policy implementation, this article constructs a multi time point DID model to test hypothesis H1:
Where GP denotes firms' green technology innovation; Treated*Time is a double-difference variable that denotes green financial policies. Controls is the set of control variables, ε is a random perturbation term, subscript i denotes firms, and subscript t denotes year. In addition, the model controls for individual over-time fixed effects and year-fixed effects, respectively δi and γt. This paper focuses on the estimated coefficients of Treated*Time, if the coefficients are positive, it indicates that hypothesis H1 is valid, i.e., the green financial policy can significantly promote enterprises' green technological innovation.
Descriptive Statistics
From the results of descriptive statistics (Table 2), it can be seen that the maximum value of the number of green patent applications is 6.90, the minimum value is 0.00, and the mean value is 0.38, indicating that there is a large discrepancy in the number of green patent applications by enterprises in China and that the level of green technological innovation is relatively low. Treated the mean value of 0.20, indicating that the sample of the pilot region accounted for 20%. The mean value of the enterprise size of the sample enterprises is 22.20, the standard deviation is 1.25, and the other control variables are basically consistent with the established research results.
Results and Discussion
Benchmark Regression Results
According to column (1) of the baseline regression results in Table 3, it can be seen that on the basis of controlling for both individual and time effects, the estimated coefficient of Treated*Time is positive and significant at the 1% statistical level when no control variables are added; column (2) adds some of the control variables, the estimated coefficient of Treated*Time is positive and also significant at the 1% statistical level. The results of adding all control variables in column (3) show that the estimated coefficient of the cross-multiplier term is still positive, indicating that the green financial reform and innovation pilot zone policy can significantly promote enterprises' green technological innovation, which is consistent with the expectation of hypothesis H1.
The empirical results of some control variables show that the gearing ratio (Lev) and growth (Growth) have a negative impact on the green technological innovation of enterprises, while the total return on assets (ROA) and the number of employees (Employee) have a significant positive impact on the green technological innovation of enterprises. Comparing the regression results in columns (1) to (3), the significance level of Treated*Time coefficients does not change with the increase in the number of control variables, and the degree of fit is the same.
Table 3.
Benchmark regression results.
Tests for Parallel Trends and Dynamic Effects
The parallel trend assumption is a prerequisite for the use of the double difference model. The parallel trend assumption is valid if the treatment group and the control group have the same trend of change before the occurrence of the policy. Given the green finance policy is gradually implemented in provinces in stages, and the pilot provinces are subject to different times of policy shocks, this paper constructs the formula as follows:
(2)
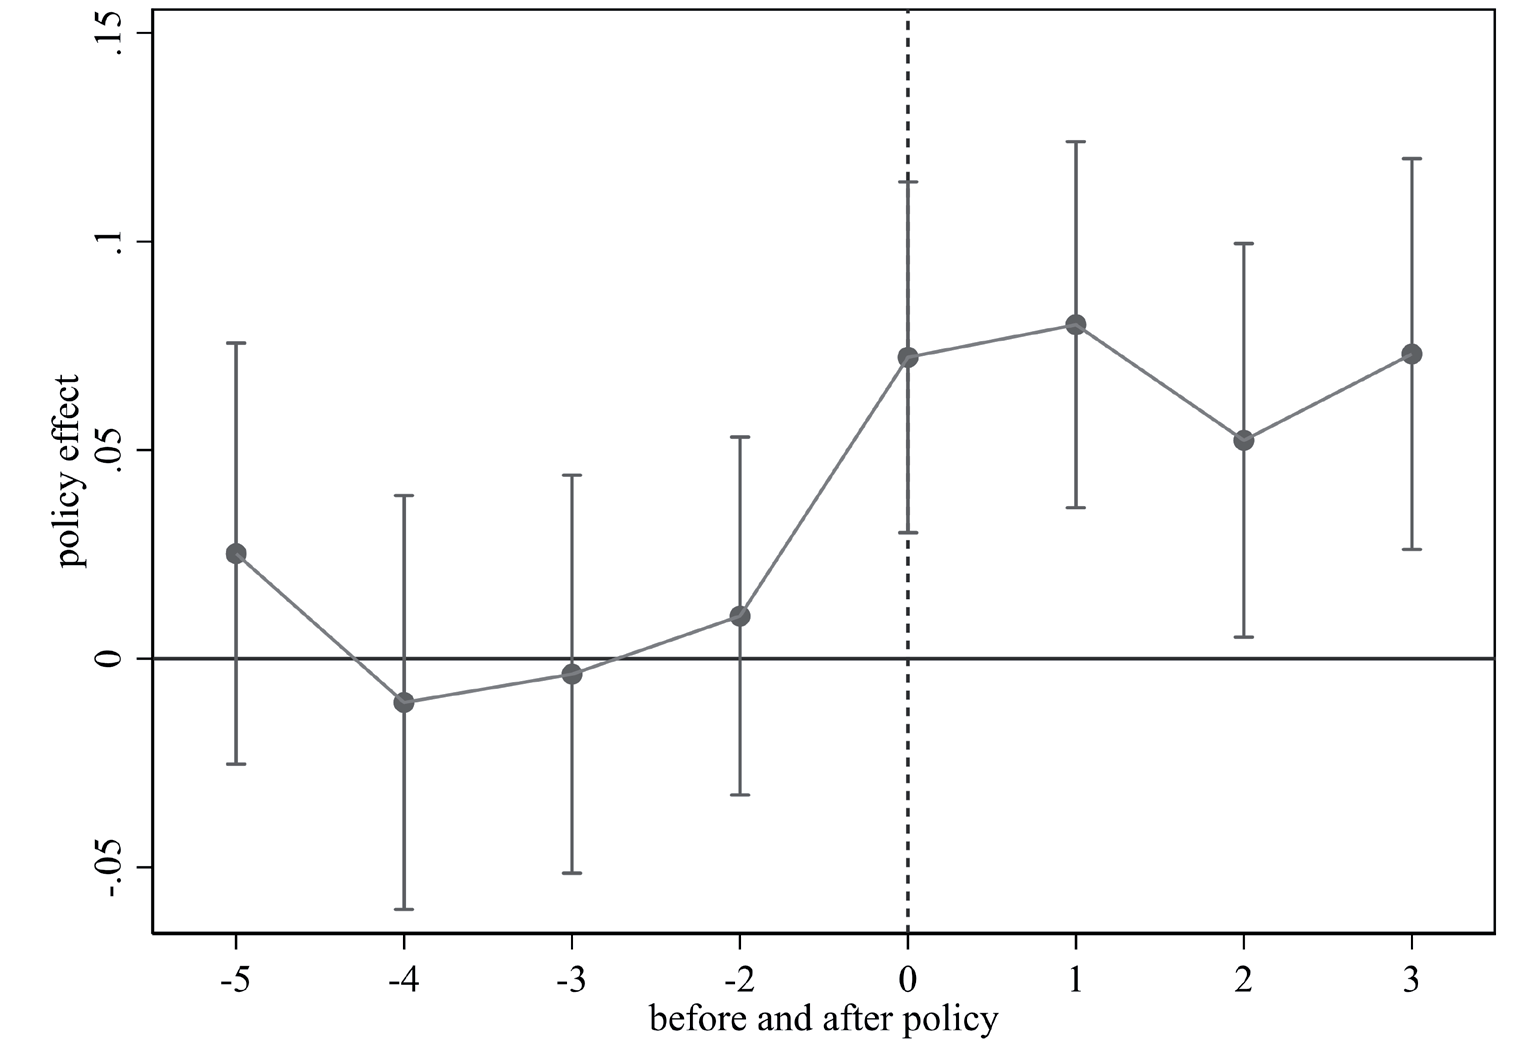
The time dummy variables Before, Current, and After denote the observations in the previous n years, the current year, and the next n years, respectively, in which the enterprises located in the pilot provinces are affected by the green finance policy. In this paper, the data from 2012-2021 are selected, and since the policy is gradually implemented in two batches, the first implementation year is 2017, there will be a situation where the sample size of the previous years is small, and it is necessary to subsume the samples before the -5 period into the -5 period. To avoid multicollinearity, it is also necessary to exclude the period before the policy implementation (Before1). The results are shown in Fig. 1. The coefficient of the interaction term (Treated*Time) before the implementation of the policy is not significant and has a small value, which indicates that there is no significant difference between the green technology innovation of enterprises located in the pilot provinces and enterprises located in the non-pilot provinces before the implementation of the policy, i.e., it is in line with the parallel trend hypothesis.
In terms of dynamic effects, this paper mainly analyzes the dynamic effects over a 9-period period. The results show that after the implementation of the policy, the impact coefficient of the green financial reform and innovation pilot zone policy is significantly positive, indicating that the green financial policy is able to promote the green technological innovation of enterprises.
Robustness Check
Expected Effects Test
In order to ensure the validity of the multi-temporal DID, it is first tested whether there is an expected effect of green financial policies. In this paper, the time region of the selected samples is 2012-2021, and the years of green financial policy implementation are 2017 and 2019, respectively. The new interaction term (DID1) is generated by advancing both policy implementation times by three years. As shown in columns (1) and (2) of Table 4, the coefficient of the interaction term (DID1) is not significant, indicating that there is no expected effect, and the robustness of the benchmark regression results is supported.
Considering Policy Time Lag
The policy effect of green financial reform and innovation pilot zones may have a time lag; this paper changes the setting of Treated in Equation (1), which takes the value of 1 in 2018 and 2020 and after, and 0 otherwise. The results are shown in column (3)-(4) of Table 4, and the coefficient of the interaction term (DID2) is significantly positive, which is in line with the results of the benchmark regression.
Propensity Score Matching (PSM)
In order to avoid the problem of selectivity bias in the sample data, this paper adopts the multi-temporal PSM-DID model to match the propensity scores based on the PSM applied to the cross-section data and DID applied to the panel data. The results are shown in column (5) of Table 4. After radius matching, the coefficient of Treated*Time is still significantly positive, which is not much different from the previous benchmark regression results, indicating that the results are relatively robust.
Table 4.
Robustness test.
Placebo Tests
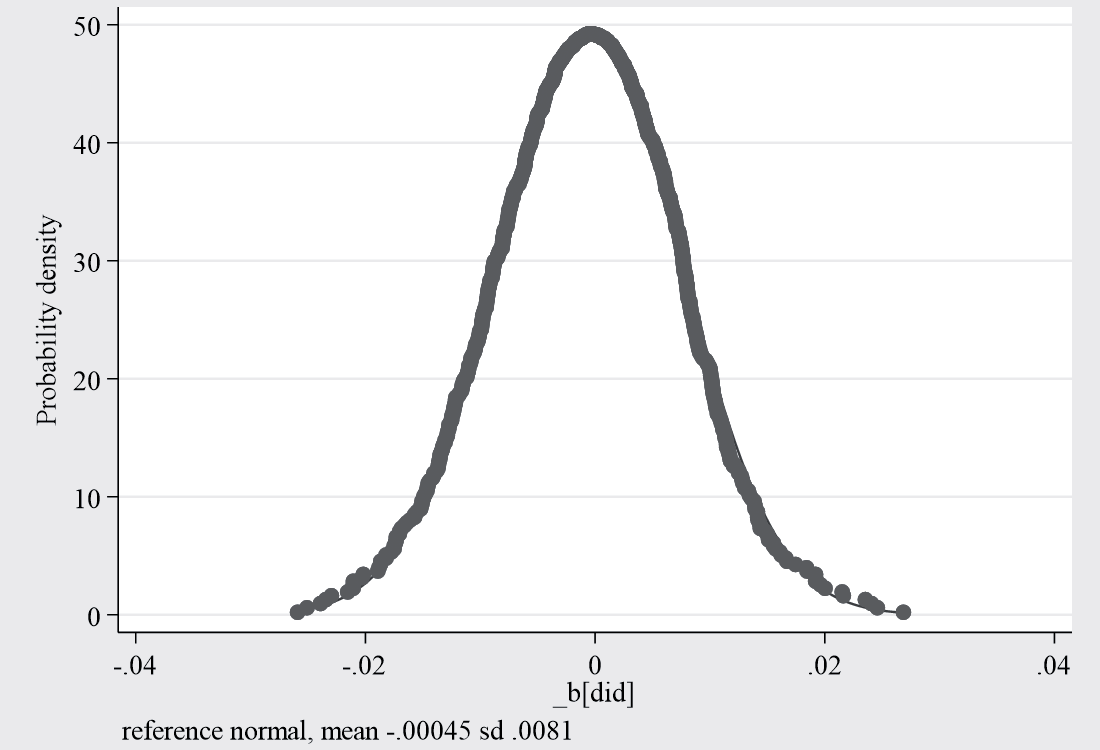
Although this paper has controlled for many of the firm-level characteristic variables, there may still be other confounding factors that affect the results of the policy assessment. Due to the differences in the timing of policy shocks for enterprises located in pilot provinces in the multi-temporal DID, to ensure the robustness of the results, this paper utilizes Stata software to construct a pseudo-green financial reform and innovation pilot zone policy on 26,802 enterprise sample data for 1,000 times of random sampling, and each sample randomly selects 4,995 enterprises' sample data as the treatment group, and the rest of the data as the control group The regression is carried out according to model (1). The distribution of the coefficient estimates after the randomized treatment is shown in Fig. 2, with the coefficient means (vertical lines on the horizontal axis) concentrated around 0. Considering that the coefficient of the interaction term in the benchmark regression is 0.067, the "true" estimated coefficients of the benchmark model are shown as small probability events in Fig. 2, which further supports the basic findings of this paper.
Table 5.
Robustness test.
Table 6.
Impact mechanism test.
Replacement of Explained Variables
The number of green patents granted is another indicator to measure the level of green technological innovation of enterprises, so this paper selects the number of green patents granted by enterprises as a substitute indicator for testing, and takes the natural logarithm of the total number of green invention patents after adding one to the number of green patents granted (GP1). As shown in column (1) of Table 5, the coefficient on the cross-multiplier term "Treated*Time" remains positive and significant at the 10 percent level after changing the dependent variable measure. This is generally consistent with the results of the benchmark regression in Table 1, indicating that the results remain robust.
Considering Omitted Variables
The benchmark regression in this paper only controls for individual and time-fixed effects, and if province and city fixed effects are not included, variables that do not change over time at the district level may be omitted, leading to bias in the regression. The inclusion of province-fixed effects and city-fixed effects is borrowed from the study of Tingting Wu et al. Table 5, column (2) shows the results of adding province fixed effects, and column (3) shows the results of adding city fixed effects, which are still significantly positive at the 1% level, and the results are relatively robust.
Excluding Other Policy Disturbances
During the examination period of this paper, the policies of the "Twelfth Five-Year Plan for Prevention and Control of Air Pollution in Key Regions" and the "Green Credit Guidelines" introduced in 2012, as well as the pilot policies of low-carbon cities set up in three batches after 2010, are closely related to this paper. Therefore, in the baseline regression model, the dummy variables for the year of implementation of these three policies are added in turn, and the results are shown in columns (4) and (6) of Table 5. After controlling for the three types of policies, DID is still significantly positive, which indicates to a certain extent that green financial policies can significantly promote enterprises' green technological innovation, and the results are robust.
Mechanism Test
According to the above analysis, green finance promotes enterprise green technology innovation. On this basis, drawing on the influence mechanism test method of Jiang [47], we test the influence mechanism of green finance to promote enterprises' green technological innovation from the perspectives of enterprises' financing constraints, capital crowding, and credit resource mismatch, verify whether the hypotheses H2a, H2b, and H2c are valid or not, and construct the model as follows:
M is the mechanism variable, and the other variables are consistent with the previous section. If the coefficient ꞵ1 is significant, the mechanism test holds.
Financing Constraints
Financing constraint (FC), a common corporate financial indicator, is selected for testing. The results in column (1) of Table 6 show that the coefficient of Treated*Time is -0.019 and is significant at the 1% level, and the green financial policy significantly reduces the financing constraints of enterprises, enhances the financial stability within enterprises, and reduces the obstacles for enterprises to carry out green technological innovations, which supports the hypothesis H2a. The green financial policy is able to optimize the financial status of enterprises, provide sufficient financial support for the green transformation of enterprises, and realize the double fitting of financial resources shortage complement as well as financial stability enhancement. Under the condition that enterprise financing constraints are gradually relaxed, the obstacles to enterprise green technology innovation will be smaller.
Fund Crowding-Out Route
It is measured using the ratio of financial assets to total assets, where financial assets specifically include the sum of trading financial assets, derivative financial assets, held-to-maturity investments, available-for-sale financial assets, investment real estate, and loans and advances granted. The results in column (2) of Table 6 show that the coefficient of Treated*Time is positive and significant at the 5% level. Green financial policies can improve the level of enterprise financialization, continuously enhance R&D investment and improve enterprise financing capacity, reduce the risk of capital breakage, ensure the continuity of R&D investment, and promote enterprise innovation.
After the implementation of green financial policies, the financial difficulties are alleviated, and more credit support for enterprises may lead them to invest part of their capital in other fields, enhancing the infrastructure construction for enterprises to carry out green technological innovation, thus positively affecting green innovation. Therefore, the new investment of enterprises is chosen as the mechanism variable, and the ratio of total enterprise investment to maintenance investment is used to measure it. The results in column (3) of Table 6 show that the coefficient of Treated*Time is 1.840 and significant at the 5% level. Additional investment by firms can provide financial, equipment, and technical support for firms to innovate.
Mismatch of Credit Resources
The level of financial mismatch burden is applied to measure credit resource mismatch (Fd). The results in column (4) of Table 6 show that the coefficient of Treated*Time is -0.055 and significant at the 5% level, which indicates that the green finance policy can effectively allocate credit resources and significantly reduce the level of credit resource mismatch, thereby the hypothesis H2c holds. Green financial policies can effectively reduce information asymmetry and financial friction, thereby alleviating resource mismatch and promoting green innovation among enterprises.
Heterogeneity Analysis
Heterogeneity of Firm Characteristics
The sample is divided into non-heavily polluting enterprises and heavily polluting enterprises according to the definition of heavily polluting industries in documents such as the "List of Listed Companies' Environmental Verification Industry Classification and Management Directory" issued by the Ministry of Environmental Protection in 2008. As can be seen from Table 7, column (1) is the sample group of non-heavily polluted enterprises, and Treated*Time is significantly positive at 1% level; column (2) is the sample group of heavily polluted enterprises, and Treated*Time has a tendency to negatively affect GP, but it fails the significance test. Compared with heavy polluting enterprises, the promotion effect of the policy is more obvious in non-heavy polluting enterprises, indicating that the green financial policy is favorable in guiding the flow of funds to environmental protection enterprises. Heavily polluted enterprises face stronger financing constraints and have limited funds for innovation investment. Green innovation is a long-term process, and the short-term economic benefits brought by green innovation to enterprises are not enough to provide a strong impetus for green innovation.
Table 7.
Heterogeneity of firm characteristics.
Innovation activities are usually associated with firm size. In this paper, the sample firms are categorized into two subsamples of large-scale and small-scale firms according to the 50th percentile of the total asset size, and the results are shown in Table 7. The estimated coefficient of Treated*Time is not significant for the sample group of small-scale firms in column (3), while for the sample group of large-scale firms in column (4), the estimated coefficient of Treated*Time is significantly positive at the 1% level, which indicates that large-scale firms are more obviously affected by policies. According to "Schumpeter's hypothesis," large enterprises have more advantages in terms of capital, human resources, and platforms, are more powerful in terms of the availability and sensitivity of financial resources, and are able to provide the support of human resources and technology and other resources needed for green technological innovation of enterprises, so large-scale enterprises are more obviously affected by the promotion effect of green financial policies when they carry out green technological innovation. Therefore, the promotion effect of green financial policies is more obvious when large-scale enterprises carry out green technological innovation.
Table 8.
Regional heterogeneity.
The nature of the firm's property rights usually has an impact on the firm's technological innovation. In this paper, the sample is divided into state-owned enterprises and non-state-owned enterprises to examine whether there are group differences. According to Table 7, column (5) is the sample group of non-SOEs, and column (6) is the sample of SOEs. The results show that green financial policies have a significant positive impact on both SOEs and non-SOEs, only that the impact on non-SOEs is more significant. On the one hand, compared with SOEs, non-SOEs have less political connections with local governments and more flexible institutional mechanisms, and green financial policies are more likely to incentivize enterprises to carry out green technological innovation in order to obtain funds. On the other hand, state-owned enterprises often undertake the important will of national reform and development, and have natural advantages in the acquisition of resources such as capital, manpower, and technology, more channels for obtaining funds, and the R&D department and R&D investment are relatively stable, which will not be greatly affected by the implementation of green financial policies.
Table 9.
Regional heterogeneity.
Regional Heterogeneity
This paper uses the sum of deposits and loans of financial institutions as a share of GDP to measure the level of financial development and divides the sample into two groups of high and low financial development levels according to the 50th percentile. As shown in columns (1) and (2) of Table 8, the cross-multiplier term for the sample group with a high financial development level is positively significant at the 1% level, while the cross-multiplier term for the sample group with low financial development level is positively significant at the 5% level. The province where the enterprise is located has a high level of financial development, the financial system construction will be relatively perfect, and the competition between banks and other financial institutions will be more intense. This kind of benign competition will also motivate the banks to collect as much information about the enterprise as possible, reduce the information asymmetry between the bank and the enterprise, alleviate the constraints of enterprise financing, and promote green innovation.
This paper adopts the ratio of the frequency of environment-related words in provincial government work reports to the total number of words in the full text of government reports to measure the strength of environmental regulation and divides the sample into two groups of high and low environmental regulation according to the 50th percentile. The results in columns (3) and (4) of Table 8 show that green financial policies have a more significant effect on promoting green technological innovation of enterprises located in regions with high environmental regulation than in regions with low environmental regulation. This is because the governments of regions with high environmental regulation will guide and supervise the flow, use, and price of green funds, while enterprises will comply with green finance policies more closely because of strict supervision, guiding the flow of credit funds to green industries and green projects and promoting green technological innovation.
This paper adopts the ratio of industrial-added value to regional GDP to measure the level of industrialization and divides the sample into two groups with high and low levels of industrialization according to the 50th percentile. As shown in columns (5) and (6) of Table 8, in regions with high industrialization levels, green financial policies have a stronger role in promoting green technological innovation in enterprises. This may be because enterprises in regions with high levels of industrialization are highly competitive and are more likely to face the choice of green transformation and industrial upgrading. Green financial policies provide a large amount of financing funds, which can force these enterprises to change their green production methods and improve their green technological innovation.
Due to the differences in policies, institutions, and economic development among different regions of China, the standards, enforcement, and intensity of green finance policy implementation will also vary. In this paper, we examine regional heterogeneity by dividing the sample into three major categories in the East, Central, and West regions concerning the division criteria of the Basic Database of Macroeconomic and Social Development in Beijing. Columns (1)-(3) of Table 9 indicate the degree of impact of green finance policy implementation in the west-central and west-central regions, respectively. The results show that the pilot policy implementation significantly affects the eastern region, while the effect is not significant in the central and western regions. Due to the high level of economic development in the eastern region, the construction of the green financial system is relatively perfect, and the financing channels are diversified, which provides sustained and substantial financial support for innovative activities and is more likely to increase the willingness of enterprises to innovate.
Conclusions and Recommendations
Conclusions
Taking the A-share listed companies in Shanghai and Shenzhen, China, as a sample between 2012 and 2021, this research investigates the influence of eco-friendly financial regulations on corporate green technological advancement through a quasi-natural experiment approach, employing a multi-temporal DID model. The investigation reveals that, firstly, eco-friendly financial regulations substantially boost companies' green technological progress. Secondly, considering enterprise diversity, the impact of eco-friendly financial regulations on companies' green technological progress is notably stronger in less polluting entities, larger corporations, and non-governmental enterprises. Viewing it from a regional standpoint, the impact of eco-friendly financial policies on companies' green technological progress is more pronounced in regions with advanced financial infrastructure, strict environmental regulations, and high industrialization levels, particularly in the eastern regions. Lastly, in-depth analysis indicates that constraints in financing, pathways of capital crowding-out, and mismatches in credit resources are the primary catalysts stimulating companies' green technological innovation.
Recommendations
At the governmental level, it is necessary to further standardize policy guidelines, improve the green financial system, expand the scope of green financial policy pilots, and give full play to the role of green innovation incentives of green financial policies so as to ensure the effectiveness of policy implementation. Green financial tools such as green bonds, green credit, and environmental liability insurance should be innovated to balance environmental and economic benefits. Additionally, different policies tailored to specific characteristics of entities should be developed through scientific assessment tools to address lagging regions and enterprises, ensuring effective policy implementation. Strengthening inter-regional government information exchange and policy support is crucial, with the more developed green financial system in the eastern coastal region taking the lead in supporting the development of the central and western regions. Furthermore, promoting risk management by financial institutions, along with measures to boost enterprise vitality through restricted customer credit and post-credit requirements, is imperative. Supervision and management of enterprises should be strengthened in order to raise their awareness of environmental protection and improve their environmental protection efforts.
Financial institutions can encourage enterprises and individuals to make environmentally friendly investments and green financial innovations through the provision of low-interest loans, tax incentives, financial literacy, and technical support to provide financial support for the economic development of developing countries and to encourage and promote the establishment of a complete green financial system in developing countries. Developing countries need to develop green financial products and services tailored to their own resources and market needs in order to meet the needs of domestic sustainable development.
At the enterprise level, it is crucial to adhere to policy trends, seize development opportunities, and align with green financial policies for synergistic growth. Enterprises should actively drive their green transformation, integrating environmental protection and resource conservation principles into production and operations to reduce pollutant emissions and incorporate energy efficiency practices in daily operations to cut production costs. Enterprise managers should enhance environmental consciousness, foster corporate environmental transparency, and reduce information discrepancies between enterprises and financial institutions. Enterprises should focus on enhancing research and development of green technology, boosting production efficiency, refining innovation in green financial products, meeting market demands, improving the service framework for green financial products, enhancing financial product market competitiveness, elevating brand image, and leveraging strong brand influence to expand market reach.

