

Introduction
Wheat has a high nutritional value since it is high in starch (58.2%), has enough sugar and fat, and has a higher percentage of carbohydrates than other crops [1]. In addition to its nutritional importance, wheat is a critical agricultural commodity. Pakistan, for instance, ranks among the top eight wheat-producing countries globally, with an annual production of 25 million tons [2]. Wheat accounts for 10.1% of agricultural value added and 1.7% of Pakistan’s gross domestic product (GDP) [3]. Several agronomic traits influence the response of wheat grain yield [4]. Wheat yield improvement has been aided by agronomic parameters such as plant height (PH), harvest index (HI), total biomass (BM), number of productive tillers (PTN), grain number (GN), spike length (SL), and thousand-grain weight (TGW) [5- 8]. Trait-based breeding of high-performing, genetically similar wheat genotypes has been essential for yield improvements [4, 9-12]. However, the widespread adoption of elite genotypes has led to reduced genetic diversity, a critical issue for sustainable agriculture. Genetic variety within fields, on the other hand, is a tool for more sustainable production since it allows greater stability and resilience to biotic and abiotic challenges [13]. Grain yield (GY) in wheat is complex and controlled by multiple genes. Effective selection requires understanding population variation, trait correlations, and environmental influences [14]. Correlation coefficient analysis is an important tool for providing information on the proper cause-and-effect relationship between yield and some yield components [15, 16]. Heritability refers to the proportion of phenotypic variation that can be largely attributed to a genetic makeup. Plant breeders can use heritability to estimate the behavior of the next generation and make favorable selections. The higher the heritability, the easier the selection process will become and the stronger the response toward selection [17-19]. Another key selection criterion that helps breeders in the selection procedure is genetic advancement (GA) [19, 20]. Genetic advance is another term for the expected response to selection. The optimum conditions for selection are those with high GA and high heritability estimates [21, 22]. The magnitude of variation in wheat breeding material was estimated using phenotypic (Vp) and genotypic variance (Vg), heritability (h2B), and genetic advance (GA) [23, 24]. The protein accumulated during grain development is not only an important reserve for plant germination and early seedling growth, but it is also an important food source for humans. Gluten protein, a mixture of monomeric gliadin and high-molecular-weight glutenin found in wheat starchy endosperm, is a major protein reservoir. The quality of the dough depends on the presence of wheat storage protein (gluten). Gliadins (Mw 30-80 kDa) and glutenins (Mw 30-80 kDa) are the two types of gluten (Mw 12-130 kDa). Glutenins are aggregating proteins that are important for dough strength and quality. Gliadins are nonaggregating proteins responsible for dough extensibility [25-27]. Glutenin is classified into two classes: high-molecular-weight glutenin (HMW-GS) and low-molecular-weight glutenin (LMW-GS) [28, 29].
A substantial number of germplasm lines can be characterized for biochemical markers in a short period of time. Furthermore, the data more accurately reflect genetic diversity since biochemical markers are direct products of genes, and environmental factors do not affect their expression [30-32]. The variation in storage protein in wheat has been observed to be a beneficial tool to assess variability and improve diversity in germplasm collections [30, 33]. Wheat varieties with higher performance are committed to conventional wheat breeding techniques to develop wheat progeny with improved grain yield and baking quality attributes for end use [34, 35]. Keep in mind that the investigation is to characterize and identify the genetic diversity among wheat varieties grown in Pakistan based on their agronomic traits and differential protein profiles using the technique of SDS-PAGE.
Materials and Methods
Experimental Design
This study was carried out during the crop season (sown in November 2022 and harvested in April 2023) in the screen house. A total of sixty wheat varieties were grown in a screening house of the Department of Genetics, University of Karachi, Pakistan, while sixty-six wheat varieties were used for the qualitative separation of proteins. The plots were prepared by mixing sandy loam soil and manure in a 1:1 ratio. Each plot has a length of 213.36 cm and a width of 243.84 cm. Each variety was germinated in 3 replications. Urea was applied as a fertilizer during the tillering and flowering stages. Weeding was performed manually, and malathion spray was used to keep the plot disease-free. Ten plants were randomly selected and marked for each replication. After collecting the necessary data under field conditions, other observations have been recorded after harvesting.
Quantitative Traits and Measurements
The agronomic traits that were studied were heading (DTH) and flowering days (DTF), flag leaf area (FLA), spike length (SL), plant height (PH), spikelet number (SPKLT), number of grains per spike (GN), and thousand-grain weight (TGW). Heading days were recorded as the number of days from sowing until full exposure of spikes in 50% of the plot. Flowering was recorded as 50% of anthesis emergence in the plot. Flag leaf area (cm2) was measured when the leaves were fully developed and green. The height of the plant (cm) was measured between the base of the plant stand and the tip of the fully emerged spike, excluding awns. The length of the spike (cm) was measured from the base of the first spike to the tip of the terminal spike, excluding awns at maturity. The spikelets and grain numbers were counted manually. Thousand-grain weights (g) (divide the total weight (g) by the total number of seeds, then multiply by 1000) were recorded on a top-loading balance.
Statistical Analysis
Correlation coefficients were calculated, and the analyses based on ANOVA and Duncan’s multiple range test were performed using SPSS software for Windows version 20.0 (SPSS, Inc., Chicago, IL). The graphic presentation for the correlation was constructed using the R-Studio software. Heritability in the broad sense (h2B) was computed (h2B = Vg/Vp) for each trait and province [36]. Genetic advance (GA = K ⋅ (Vp) 0.5 ⋅ h2B was estimated at 5% selection intensity (K), i.e., 2.06 [37].
Protein Extraction and Electrophoresis
Wheat grains were ground to a fine powder, and Tris-HCl buffer (pH 7.5) was added to it in a 4:1 ratio in a microfuge tube (1.5 ml) and thoroughly mixed. Samples were kept at 0ºC for 30 minutes, then boiled for 3 minutes and centrifuged at 8,000 rpm for 30 minutes. The supernatant was collected, and sample dilution buffer was added in a 2:1 ratio in the microfuge tube [38]. The variability of total storage proteins was analyzed using sodium dodecyl sulfate-polyacrylamide gel electrophoresis (SDS-PAGE), a 12% running gel, and a 4% stacking gel following the instructions in a TV 100 Scie-Plas vertical gel electrophoresis unit. Bromophenol blue (BPB) was used as a tracking dye to observe protein mobility in the gel. DireX Gene, a protein molecular weight marker with a typical range of 11 kDa to 180 kDa, was allowed to run at 100 V until the BPB blue line was visible at the bottom of the gel plates. After removing the gels, excess sodium dodecyl sulfate was removed by incubating the gels in 30% ethanol over a shaking water bath for 30 minutes. The gels were then rinsed twice with double-distilled water and fixed (10% acetic acid in 50% methanol) overnight. The running gel was gently shaken in the staining solution using an EYELA Uni Thermo Shaker NTS-1300 for 2 hours. The gels were stained with a Coomassie brilliant blue (CBB) solution and destained until the background became transparent and the bands sharpened. Gels were photographed after destaining by placing them near a white light.
Estimation of the Molecular Weight of an Unknown Protein
To calculate the molecular weight of an unknown protein, the relative migration distance (Rf) of the protein standards and the unknown protein was estimated. The migration distance can be determined using the following Equation:
Rf = migration distance of protein /
migration distance of dye front
Based on the values obtained for the bands in the standard, the logarithm of the molecular weight of the SDS-denatured polypeptide and its relative migration distance (Rf) are plotted into a graph. A linear plot can be generated for most proteins if the samples are fully denatured and the gel percentage is appropriate for the molecular weight range of the sample. The values of this graph were interpolated, and the molecular weight of the unknown protein band was given (Bio-Rad Bulletin 6040-2).
Using the Equation mentioned below, the molecular weight of an unknown protein was estimated.
y = mx + b where y = log molecular weight of the unknown protein; m = slope of the line; x = Rf value; and b = y-intercept of the line.
Results and Discussion
Analysis of variance showed a highly significant difference among genotypes recorded for all attributes: i.e., DTH, DTF, FLA, PH, SL, SPKLT, GN, and TGW (Table 1). The diversity implies that the analyzed experimental materials have considerable genetic diversity, which can be used in future wheat breeding efforts.
Agronomic Traits
Quantitative trait data for 60 wheat genotypes showed that AS-02 headed first (46 days) and NARC-11 last (90 days) (Table 2). Early heading allows more time for grain filling. Uqaab-00 had the largest flag leaf area (55 cm²), while Pirsabak-08 had the smallest (16.67 cm²). The flag leaf, crucial for photosynthesis, contributed 41- 43% to grain weight by increasing grain number and weight [39, 40]. Pakistan-13 had the tallest plants, with an average height of 96 cm, while the shortest plants were observed in TD-1, with an average height of 35 cm. Dwarf plants produce thicker stems, helping the plant to direct resources from the stem to the flower and grain filling, leading to an increased yield. Taller wheat plants compete better for sunlight but tend to fall under the weight of extra grain – a trait called lodging [41]. Barsaat had the longest spikes (13.39 cm) and most spikelets (23 per spike), while Imdad-05 had the shortest spikes (5.32 cm) and TD-1, Pirsabak-08, and Shalimar-88 had the fewest spikelets (12). Moomal-02 had the most grains (55 per spike), and Pirsabak-08 had the least (26). Marvi-00 had the heaviest 1000 grains (67 g), and Pirsabak-08 had the lightest (22.67 g). Barsaat excelled in spikelet number and spike length, Moomal-02 in grain number, and Marvi-00 in 1000-grain weight, making them valuable for breeding programs. Pirsabak-08 was the weakest variety overall, while Uqaab-00 excelled in spike length and flag leaf area.
Table 1.
ANOVA for quantitative traits in wheat.
Correlation Coefficient
Significant positive correlations were found between various traits (Fig. 1a)). Heading days correlated with DTF (0.605**), FLA (0.320**), PH (0.200**), SL (0.215**), SPKLT (0.311**), and GN (0.251**). Flowering days correlated with FLA (0.361**), PH (0.333**), and SPKLT (0.299**). Flag leaf area correlated with PH (0.562**) and SPKLT (0.300**). Spike length correlated with SPKLT (0.426**), GN (0.345**), and TGW (0.229**). The number of spikes correlated with GN (0.554**) and TGW (0.155*). Intensive selection of these traits will improve yield [14, 16]. These traits are interrelated; selecting one or more will improve the others. Due to the negative correlation between plant height and yield components, dwarf wheat varieties such as TD-1 should be preferred. They tolerate lodging and are advantageous for direct selection for grain yield [24]. Correlation studies are useful for improving yield by indirectly selecting yield-related traits [16].
Heritability Estimates
Due to their high heritability and relationship with grain yield, agricultural parameters can serve as indirect selection criteria in breeding and cultivar development [42]. Genetic parameters like GCV, PCV, h2B, and GA are shown in Table 3. In Punjab, the flag leaf area (FLA) has high h2B (0.81) and GA (25.45). Flowering had an h2B of 0.77 and a GA of 24.52. Heading days had moderate h2B (0.67) and GA (17.68). PH, SL, and TGW had h2B values of 0.64, 0.38, and 0.30, with GA of 19.55, 1.48, and 8.65, respectively. In Sindh, SL had a high h2B (0.88) and GA (6.99), making spike length the most important trait. Low to moderate heritability for SL was noted [19, 24]. In Khyber Pakhtunkhwa, PH showed moderate h2B (0.60) and GA (17.49), indicating important additive gene effects, followed by FLA (h2B 0.54). Plant height and flag leaf area are the most heritable traits in KP. High h2B and GA support selection for creating genotypes with desirable traits [19].
Cluster Analysis
To better study the observed variation in protein content in wheat varieties, cluster analysis of different provinces of Pakistan was performed using hierarchical clustering. The data regarding the presence or absence of protein bands was used to construct the dendrograms for wheat varieties from each of the three provinces of Pakistan to find the diversity among the given wheat varieties. The results of the cluster analysis for the Punjab, Sindh, and KP provinces are given in Fig. 2.
Heading
In Punjab, twenty-seven wheat varieties were analyzed and clustered into two main groups. Group G1 included only AS-02, highlighting its unique genetic profile. Group G2 was divided into three sub-clusters: Sub-cluster 1 (Mexipak-65, Millat-11, Faisalabad-08, AS-11, Chakwal-50, Margalla-99, Chenab-00), Sub-cluster 2 (Galaxy-13, Seher-06, Dharabi-11, Punjab-11, Pakistan-13), and Sub-cluster 3 (Ujala-15, Uqaab-00, NARC-09, Punjab-85, Ufaq-02, Bhaktawar-94, Shahkar-13, Zincol-16, NARC-11, Seher, Borloug-16, Wafaaq-01, Shalimar-88). Ujala-15, Uqaab-00, NARC- 09, Punjab-85, and Ufaq-02 were closely grouped, indicating a narrow genetic pool, suggesting the need for genetic diversity. In Sindh, fifteen wheat varieties were clustered into three sub-divisions: Sub-division 1 (Bhittai), Sub-division 2 (six varieties), and Sub-division 3 (eight varieties). Kiran-95 and TD-1 were most similar, while Bhittai was unique. Kiran-95, TD-1, TJ-83, and Benazir-13 showed the lowest genetic dissimilarity, useful for hybridization programs. In Khyber Pakhtunkhwa, twenty-four wheat varieties were clustered into two main groups. Group G1 included Dera-98, DN-111, DN-102, DN-104, DN-118, DN-93, and DN-84. Group G2 was divided into three sub-clusters: Sub-cluster 1 (Fakhr-e-Sarhad, Zamindar-04, Atta Habib, Siren), Sub-cluster 2 (Pirsabak-05, Pirsabak-08), and Sub-cluster 3 (twelve varieties). Dera-98 and DN- 102, as well as Barsaat and Tatara, were more similar. Sub-cluster 2 of G2 and G1 showed the least similarity. The moderate to low genetic diversity suggests the need for a detailed analysis of storage proteins to improve wheat quality [43].
Table 2.
Mean and standard deviation in wheat varieties.
Protein Profiling in Wheat Genotypes
Different varieties of wheat showed variable banding patterns. Electrophoregrams for Punjab, Sindh, and KP are given in Fig. 1b), c), and d), respectively. The grain storage protein patterns were determined by examining the molecular weight of the bands, with a total of 63 bands obtained. In Punjab, the most frequent HMW protein band was 104 kDa, and the most frequent LMW band was 18 kDa (Supplementary Table S1). Seher-06 had the maximum bands (17). In Sindh, the most frequent HMW band was 104 kDa, and the most frequent LMW band was 17 kDa (Supplementary Table S1). Sunehri had the maximum bands (17). In KP, the most frequent HMW bands were 66 kDa and 79 kDa, and the most frequent LMW bands were 36 kDa and 23 kDa. DN-93, DN-102, and DN-111 had the maximum bands (15). Higher polymorphism was observed with HMW-GS proteins. The diversity among wheat varieties results from various allele combinations [44]. Specific alleles of HMW-GS determine breadmaking quality, and certain HMW-GS genes can enhance this quality [45]. SDS-PAGE analysis showed maximum diversity for HMW-GS compared to LMW-GS [46]. This method is reliable, simple, and quick, widely used to estimate genetic diversity in crops like wheat [47]. HMW-GS plays a crucial role in defining bread quality [48]. A strong positive association exists between the HMW-GS fraction and breadmaking parameters [49]. Seed protein patterns obtained by electrophoresis are used to evaluate genetic diversity in wheat due to their simplicity and effectiveness [50]. Wheat protein analysis helps identify genetic diversity and maximize variations in germplasm collections, breeding wheat genotypes with improved breadmaking qualities [51]. Flours with higher glutenin content yield more stable dough, function better in breadmaking, increase dough during fermentation, and increase loaf capacity [52]. Higher HMW-GS/ LMW-GS ratio wheat genotypes are associated with better rheological and breadmaking properties [27]. Future research should delve deeper into the genetic basis of gluten protein diversity and its correlation with wheat quality traits. Utilizing advanced genomic tools to pinpoint specific genes linked to desirable traits and developing new wheat varieties with enhanced nutritional value and breadmaking qualities will be crucial. This research could also explore the potential impact of climate change on wheat quality and yield, paving the way for more resilient wheat genotypes.
Fig. 1.
a) correlation in all varieties, b) SDS-PAGE profile of some Punjab wheat, c) SDS-PAGE profile of some Sindh wheat Varieties, d) SDS-PAGE profile of some Khyber Pakhtunkhwa wheat varieties.
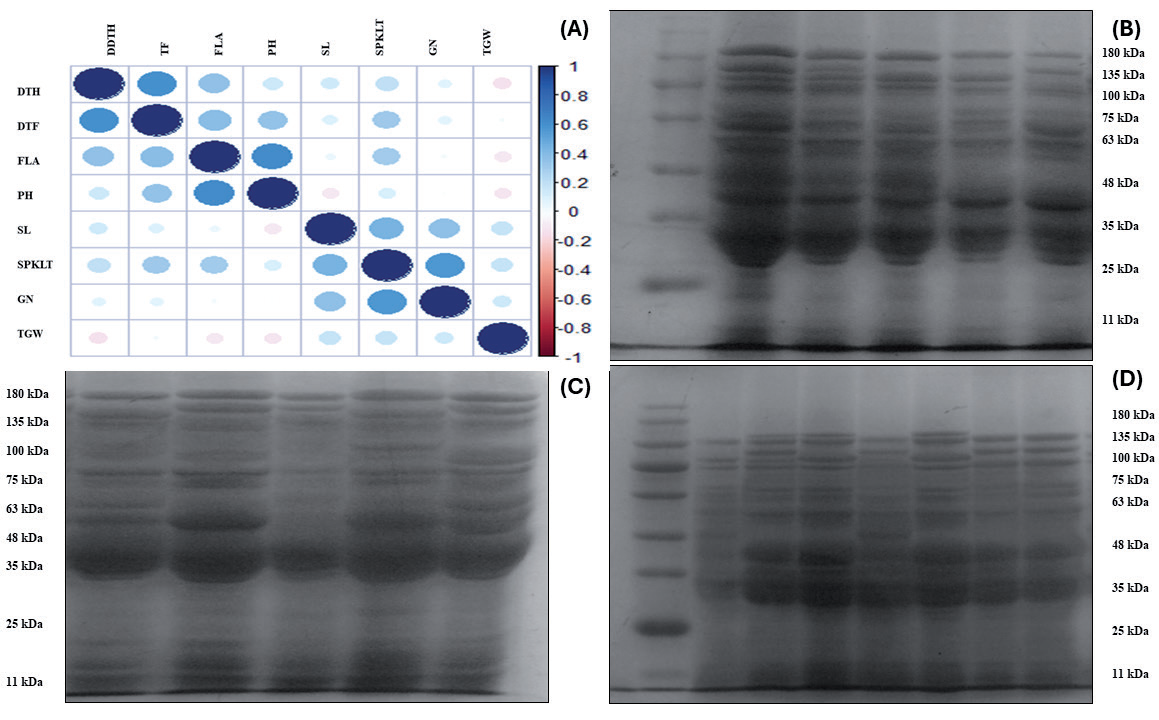
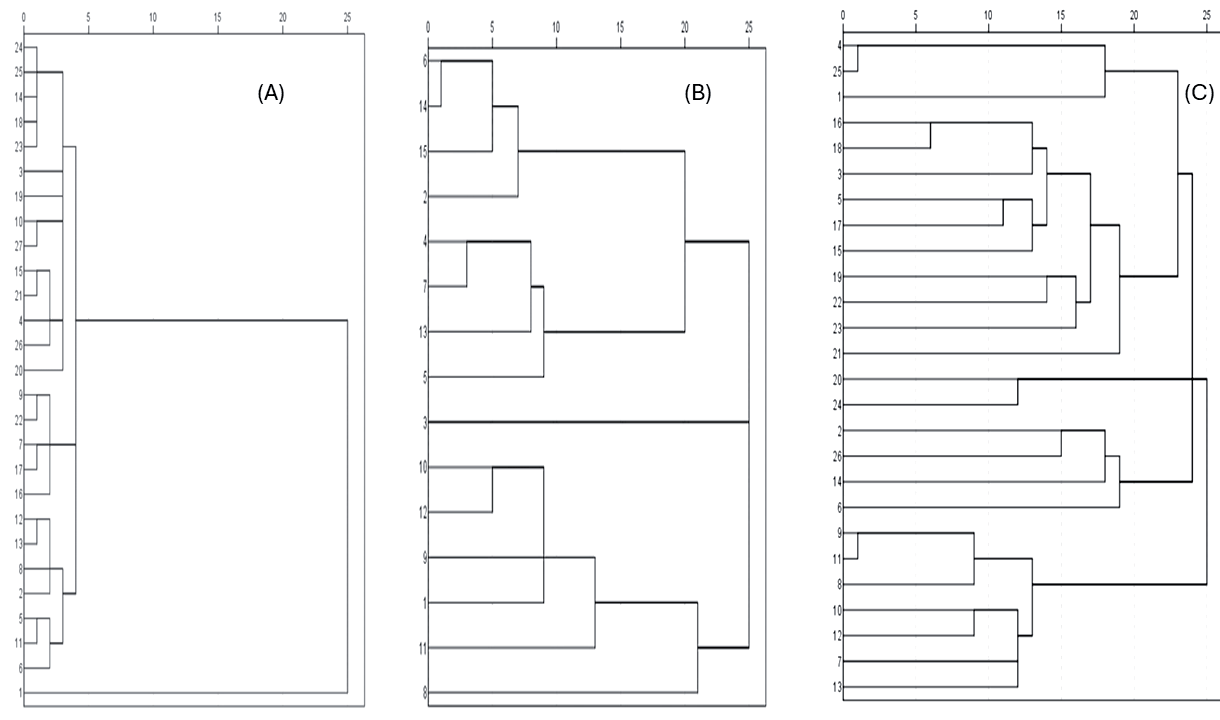
Table 3.
Estimates of broad sense heritability, genetic advance, genotypic and phenotypic coefficients of variation for some quantitative traits in wheat in the Punjab, Sindh and Khyber Pakhtunkhwa.
Conclusions
There was a significant difference between wheat varieties for all evaluated traits. Barsaat, Uqaab-00, Moomal-02, and Marvi-00 excelled in various agronomic traits, indicating their potential for breeding programs to develop improved bread varieties. High heritability estimates and moderate genetic advance were observed for traits such as heading and flowering days, plant height, spike length, and flag leaf area, suggesting these should be prioritized in future breeding efforts. The quality of wheat protein is genetically determined, varying by variety. Recent research on seed storage proteins aims to improve crops’ nutritional and processing properties. This study shows that wheat varieties from different regions of Pakistan have significant nutritional potential in terms of protein. Gluten protein profiles can serve as markers in genotyping, cataloging new varieties, evaluating pedigrees and genetic diversity studies, and enhancing the efficiency of wheat breeding programs. Future research should focus on advanced genomic selection techniques, developing climate-resilient wheat varieties, incorporating genetic markers for improved nutritional content, enhancing resistance to biotic and abiotic stresses, integrating sustainable agricultural practices, and utilizing precision agriculture technologies.

