

Introduction
The reduction of fertilizer and pesticides is a critical strategy to achieve sustainable agricultural development. Although the use of fertilizer and pesticides plays a crucial role in improving food production efficiency and solving global hunger [1, 2], they have many negative effects, such as human diseases, soil degradation, water eutrophication, and ecological damage [3, 4]. Therefore, governments pay attention to green development strategy in the world, which emphasizes the sustainable and low-carbon nature of society [5, 6]. For example, the United States National Environmental Protection Agency realized the reduction of fertilizer consumption in the 1970s. Similarly, the European Union adopted the Common Agricultural Policy to reduce the use of agricultural pesticide inputs in the 1990s. Hence, different national and international bodies have issued programs for reducing fertilizer or pesticide use over different periods of time.
As one of the countries that use the most pesticides and fertilizers in the world, China has also actively participated in the reduction of fertilizer and pesticides. In 2015, the Ministry of Agriculture and Rural Affairs of China issued the “zero growth” action plan to reduce the use of fertilizer and pesticides. With these policies and plans, China reduced the total use of fertilizer and pesticides by -12.43% and 27.32% from 2014 to 2020. In this way, China has already controlled the growth rate of fertilizer and pesticides, and both of them even show a consistent downward trend [7]. Simultaneously, China implements a plan to reduce fertilizer and pesticides, which is different from the previous separate policy models of other countries. More importantly, China has made great achievements in the reduction of fertilizer and pesticides in the past five years, characterized by higher implementation efficiency, shorter time, and wider geographical coverage [8, 9]. Fertilizer and pesticide reduction is a project that needs systematic and continuous promotion [10]. Therefore, analyzing the regular evolution and driving factors of fertilizer and pesticide reduction in China will provide a practical reference for agricultural transformation in more countries and regions [11].
Scholars have conducted a wealth of empirical research on policy evaluation, reduction potentials, and pathways to achieve fertilizer reduction [12, 13]. For example, Huang et al. [14] mainly evaluated the policy effect of “zero growth” fertilizer reduction since 2015-2020 in China and found that China’s fertilizer has achieved a 5-year continuous reduction, but the reduction pressure in some provinces is increasing. Some scholars used the natural scientific method of soil nutrient balance management to calculate the optimal amount of fertilizer for rice in southern China, so as to determine the potential for fertilizer reduction [15]. In addition, Sun et al. [16] applied the Cobb-Douglas production function and cost-benefit function of economic methods to determine whether Chinese farmers overuse fertilizer. Ji et al. [17] attempted to predict the potential of China’s fertilizer reduction using the logarithmic mean Divisia method (LMDI) based on crops, regions, and fertilizer types. These results show that fertilizer usage will continue to decline in China [18]. In order to maintain the reduction of fertilizer use in China from 2020 to 2025, Li et al. [19] also pointed out that the Chinese government should change its strategy and focus more on the intensity of fertilizer use per unit area than its total amount and on grain crops rather than cash crops. Some studies also conducted empirical research on large survey data of smallholders in China and found it necessary to strengthen the input of fixed assets such as machinery to reduce fertilizer usage by improving its efficiency [20, 21].
Similarly, many studies empirically analyze the unscientific pesticide use behavior and influencing factors of farmers and actively explore how to achieve pesticide reduction. For example, Liu et al. [22] used damage-control function and degradation life cycle to determine whether farmers overuse pesticides. Researchers have always concentrated on the farmers’ excessive use and high-frequency use of pesticides to interpret the logic of the farmers’ pesticide use behavior and investigate how to reduce pesticide usage [23]. Moreover, scholars analyzed the behavior decision-making mechanisms of why farmers misused and mixed pesticides [8, 11]. Then, researchers tried to explore both the internal and external factors affecting farmers’ excessive use of pesticides. For example, Benoît et al. [24] and Pan et al. [25] focused on the internal factors of farmers, such as product characteristics, subject cognition, social capital, and organization form. In addition, Lee et al. [26] and Lévesque et al. [27] concentrated on external factors such as government policies, the market environment, and social services. Therefore, scholars have attempted to explore the path to achieving pesticide reduction in China from many aspects, such as technology promotion, organization adjustment, and system optimization. Among these dimensions, technology promotion mainly includes green control technologies, integrated control, and efficient machinery [3, 28]. Organizational adjustment refers to farmers’ cooperatives, land transfers, and social services [29]. System optimization builds more effective mechanisms for market prices, quality control supervision, and traceability systems [30].
Scholars have conducted isolated studies on fertilizer reduction or pesticide reduction, disregarding their relationships. Nevertheless, exploring the relationship between fertilizer and pesticide reduction is essential to promoting rural revitalization and the holistic transformation of agricultural high-quality development in China [6]. An explanation for this necessity is that finding the common law of simultaneous reduction in fertilizer and pesticides can greatly improve the efficiency of “double reduction”. In terms of regional synergy, fertilizer and pesticide reduction have different effects in various provinces of China, and implementing the related strategies is one-sided, unstable, and unsustainable in some provinces [18]. For example, Xinjiang in China even experienced a reverse increase in fertilizer use after 2015 [17]. In terms of the synergy between fertilizer and pesticide reduction, the environment and objectives of the policy are highly consistent with the “double reduction” strategy. For example, Zhejiang province has achieved a significant reduction in fertilizer and pesticide usage in China [18]. Some practical cases and field experiments also demonstrated the technical feasibility of fertilizer and pesticide reduction together [31]. Therefore, a study on the SFPR in various provinces of China has important practical reference value [32, 33].
This study aims to investigate the spatial and temporal evolution of SFPR. Reducing fertilizer and pesticides in China urges the exploration of their synergy due to the limited financial resources of governments for agricultural development in many developing countries, as well as duplication and waste of resources in implementing separate and inconsistent plans. This paper uses the panel data of 31 provinces in China from 2014 to 2020 to investigate the following two aspects: First, this study draws the synergy map of reduction in fertilizer and pesticides to demonstrate its spatial and temporal evolution characteristics in China. Second, this study develops the panel data regression model to explore the factors effective in the synergy of fertilizer and pesticide reduction (SFPR).
This paper has the following main contributions: First, this study expands and supplements the existing literature about the relationship between fertilizer reduction and pesticide reduction. This finding can help achieve fertilizer and pesticide reduction goals in some countries or regions at the same time. The previous studies hardly discussed the relationship between the two, which may lead to overlapping and waste of policy resources in the common part between fertilizer reduction and pesticide reduction in practice. Second, estimating the variations in fertilizer and pesticide usage in percentage terms with approximate quantities is one of the main conclusions of this paper. Specifically, a new discovery in this paper is the use of the elasticity concept in estimating the consumption of fertilizer and pesticides. Third, this research explores the driving factors of SFPR. This finding can clarify the optimization direction of the policy and then improve the efficiency and effect of the “double reduction” policy in developing countries. Different from previous studies, this research tries to find the common characteristics of fertilizer reduction and pesticide reduction in terms of institutions and elements.
Material and Methods
The Measurement of SFPR
This research uses the elasticity coefficient for calculating the coupling relationship between fertilizer reduction and pesticide reduction, according to Equation (1).
where ρt is the elasticity coefficient of fertilizer and pesticides. t is the year. ΔFt and ΔPt are the rates of change in regional fertilizer use and pesticide use, respectively. Ft and Ft-1 show the amount of fertilizer used in periods t and t - 1, respectively. Pt and Pt-1 denote the amount of pesticides used in periods t and t - 1, respectively. The magnitude of the ρt value has the following implications.
If ρt<0, the fertilizer use and pesticide use show opposite variations. In other words, one of them may increase while the other decreases. This case implies a low degree of SFRPR.
If ρt>0, the fertilizer use and pesticide use vary in the same direction. Also, ΔFt>0 means an increase in the usage of both fertilizer and pesticides, whereas ΔFt<0 implies their simultaneously decreasing trend. In addition, 0<ρt<1 indicates that the pesticides reduction effect is significantly higher than the fertilizer reduction in year t. ρt ≅ 1 shows a high degree of SFPR. ρt>1 indicates that the fertilizer reduction effect is significantly higher than the pesticide reduction in year t.
Exploring the Driving Factors of SFPR
According to the content of the “zero growth” plan issued by the Ministry of Agriculture and Rural Affairs of China, fertilizer and pesticides can be reduced through two channels: reducing the used quantity and improving the efficiency of usage [34]. Both fertilizer reduction and pesticide reduction are aimed at achieving the common goals of saving costs, increasing income, and protecting the environment. Based on the Synergetics Theory, the SFPR has two main levels in a region: elemental and institutional [35]. On the one hand, the elements are important factors that can affect SFPR. The implementation of fertilizer reduction and pesticide reduction strategies needs the active support of local governments [36]. The local government management needs to carry out fertilizer and pesticide reduction under the same conditions of capital, technology, human resources, and equipment resources. Moreover, government departments are facing the same group of farmers in the process of implementing fertilizer reduction or pesticide reduction policies. Factors such as farmers’ ecological and environmental awareness, technical knowledge, and production organization will have a common impact on fertilizer reduction and pesticide reduction.
On the other hand, institutional factors are also important factors that can affect SFPR. In China, various policy texts have introduced fertilizer reduction and pesticide reduction as two inseparable and integrated plans and gives a high priority to both [37]. In 2015, the Ministry of Agriculture and Rural Affairs of China proposed a sister program to the “Zero Growth” program for fertilizer reduction and pesticide reduction. In 2019, the national document once again put forward the goal of “negative growth” in the use of chemical fertilizers and pesticides to emphasize the sustainability and necessity of reducing fertilizer and pesticide use [38]. China has made “chemical input reduction to promote green development” one of the priorities of the 14th Five-Year Plan.
According to the above analysis, the core influencing factors mainly contain elements and institutional factors. Equation (2). is a panel data regression model exploring the factors influencing the SFPR. And the model will be set as follows:
(2)
where Yit measures the degree of SFPR in year t for the ith province. If Yit = –|ρit–1| , the larger the value, the higher the degree of coordination. αi and ɛi are the intercept term and random error term, respectively.
Institutional factors mainly include fertilizer reduction policy (FRPit) and pesticide reduction policy (PRPit). These indicators are measured using the statistical method of text quantity each year. The specific approach is to search the policy documents (including opinions, methods, programs, guidelines, temporary regulations, rules, conditions, and standards) issued during the past years on the official website of each province (municipality and district), using “fertilizer reduction” and “pesticide reduction” as the keywords.
Element factors are fertilizer reduction and pesticide reduction, which involve the endowment of resource factors such as human, financial, and material. This study selects agricultural labor (ALit), government financial support (GFSit), average arable land size (ALSit), and agricultural cropping structure (ACSit). Among these variables, the number of agricultural laborers and government financial support have an important impact on the diffusion of new technologies for fertilizer reduction and pesticide reduction [20]. Land size will affect the marginal efficiency of pesticide and fertilizer use [8]. Agricultural cropping structure refers to the share of cash crops versus food crops in an agricultural system, which reflects differences in fertilizer and pesticide requirements for various crops [14].
Control variables are employed to control the effects of local economic development and agricultural production habits on fertilizer reduction and pesticide reduction. In this study, the control variables are GDP per capita (AGDPit), agricultural output value (AOVit), and agricultural machinery power (AMPit).
The data used in this study mainly come from official statistical data such as the China Statistical Yearbook, the China Rural Statistical Yearbook, and the National Agricultural Science and Technology Statistical Data Collection published by the Chinese government from 2015 to 2021. Only the text measurement data for fertilizer reduction policy and pesticide reduction policy indicators are from the policy documents published on the official website of each provincial government from January 1 to December 30 each year. Table 1 shows the definitions and descriptions of variables in Equation (2).
Results and Discussion
Fertilizer and Pesticide Reduction in China
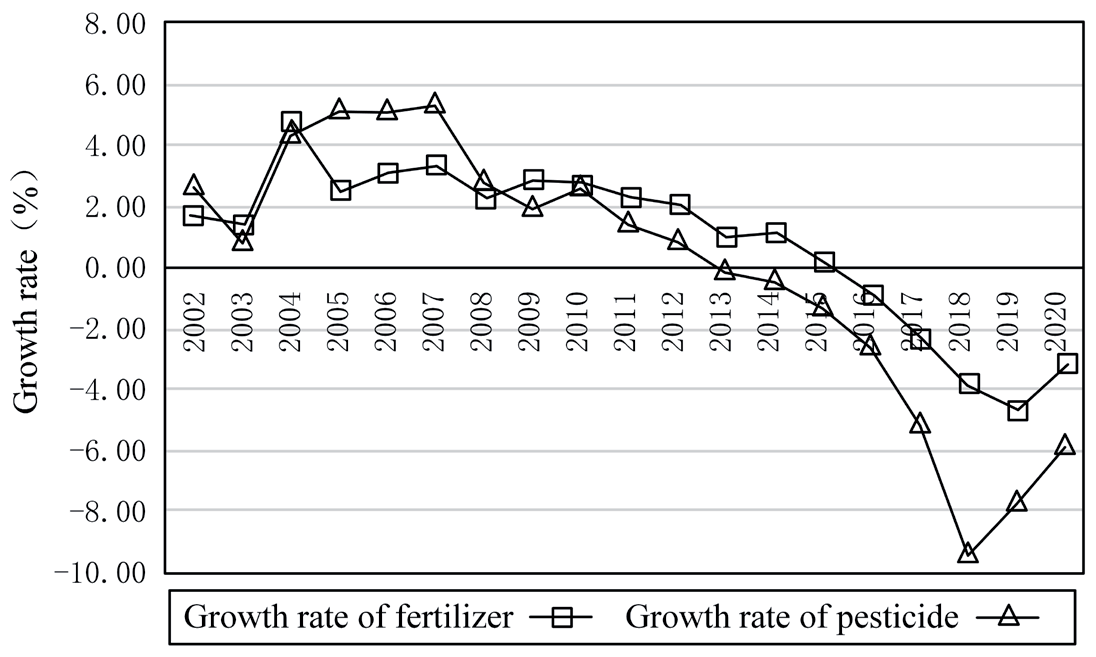
This study uses statistics on the growth rate of pesticide and fertilizer use in China from 2014 to 2020 (Fig. 1). It shows that China’s total fertilizer and pesticide use shows a gradually declining trend since the implementation of the fertilizer and pesticide “zero growth” program in 2015. In terms of fertilizer, the reduction has a steady downward trend, while the pesticide reduction ratio shows a rapidly declining trend within 2015-2020. Moreover, the reduction of fertilizer is greater than that of pesticides. From the perspective of the cumulative reduction ratio, the reduction in pesticides and fertilizer is 27.32% and 12.43% in the past five years, respectively. It can be seen that fertilizer reduction and pesticide reduction also show a similar evolution trend in growth rate.
SFPR in China
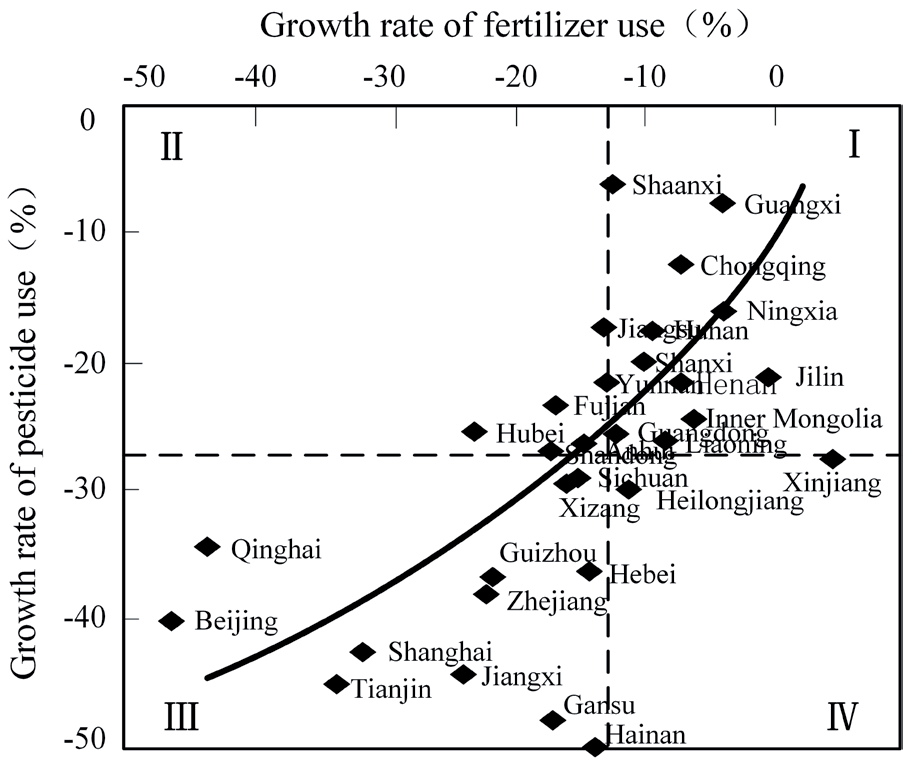
In order to outline the SFPR in each region of China, Fig. 2 draws a synergistic map of fertilizer reduction and pesticide reduction using the growth rate of fertilizer and pesticide use as the horizontal and vertical axes in the coordinates, respectively. In addition, the national average reduction level value is a boundary to divide the map into four synergistic areas. According to this division, area Ⅰ indicates the low-efficiency synergistic region where fertilizer and pesticides are showing a small reduction. Areas Ⅱ and Ⅳ are not synergistic regions, and the magnitude of fertilizer and pesticide reduction is not coordinated in this region. Area Ⅲ is a high-efficiency synergistic region where the reduction of fertilizer and pesticides is greater in this region.
From the results of the mapping data, firstly, fertilizer reduction and pesticide reduction in China’s provinces show typical synergistic characteristics, and the distribution of sample points is mostly in areas I and III. This result implies a positive correlation between fertilizer reduction and pesticide reduction in the region. Secondly, the inefficient synergy region mainly contains Guangxi, Chongqing, Ningxia, Hunan, Shanxi, Henan, Jilin, and Inner Mongolia, while the efficient synergy region mainly covers Beijing, Shanghai, Tianjin, Qinghai, Jiangxi, Guizhou, Zhejiang, Gansu, and Hainan. In general, the policy environment and policy goals for fertilizer reduction and pesticide reduction in all Chinese provinces have been consistent since implementing a series of policies such as “zero growth”, “high quality development”, and “rural revitalization”. These are the fundamental reasons for the SFPR. However, factors that may lead to differences in the synergistic effects of fertilizer reduction and pesticide reduction among provinces include policy implementation, regional development strategies, agricultural industry structure, and technological innovation [39]. For example, Shanghai has introduced a fertilizer reduction and pesticide reduction plan for five consecutive years. Zhejiang Province implemented the reform of “two systems of fertilizer and pesticides”. Qinghai Province set a three-stage reduction policy of “pilot first - expand the effectiveness - upgrade”. In addition, differences in crop structure across provinces make the reduction potential of fertilizer and pesticides different.
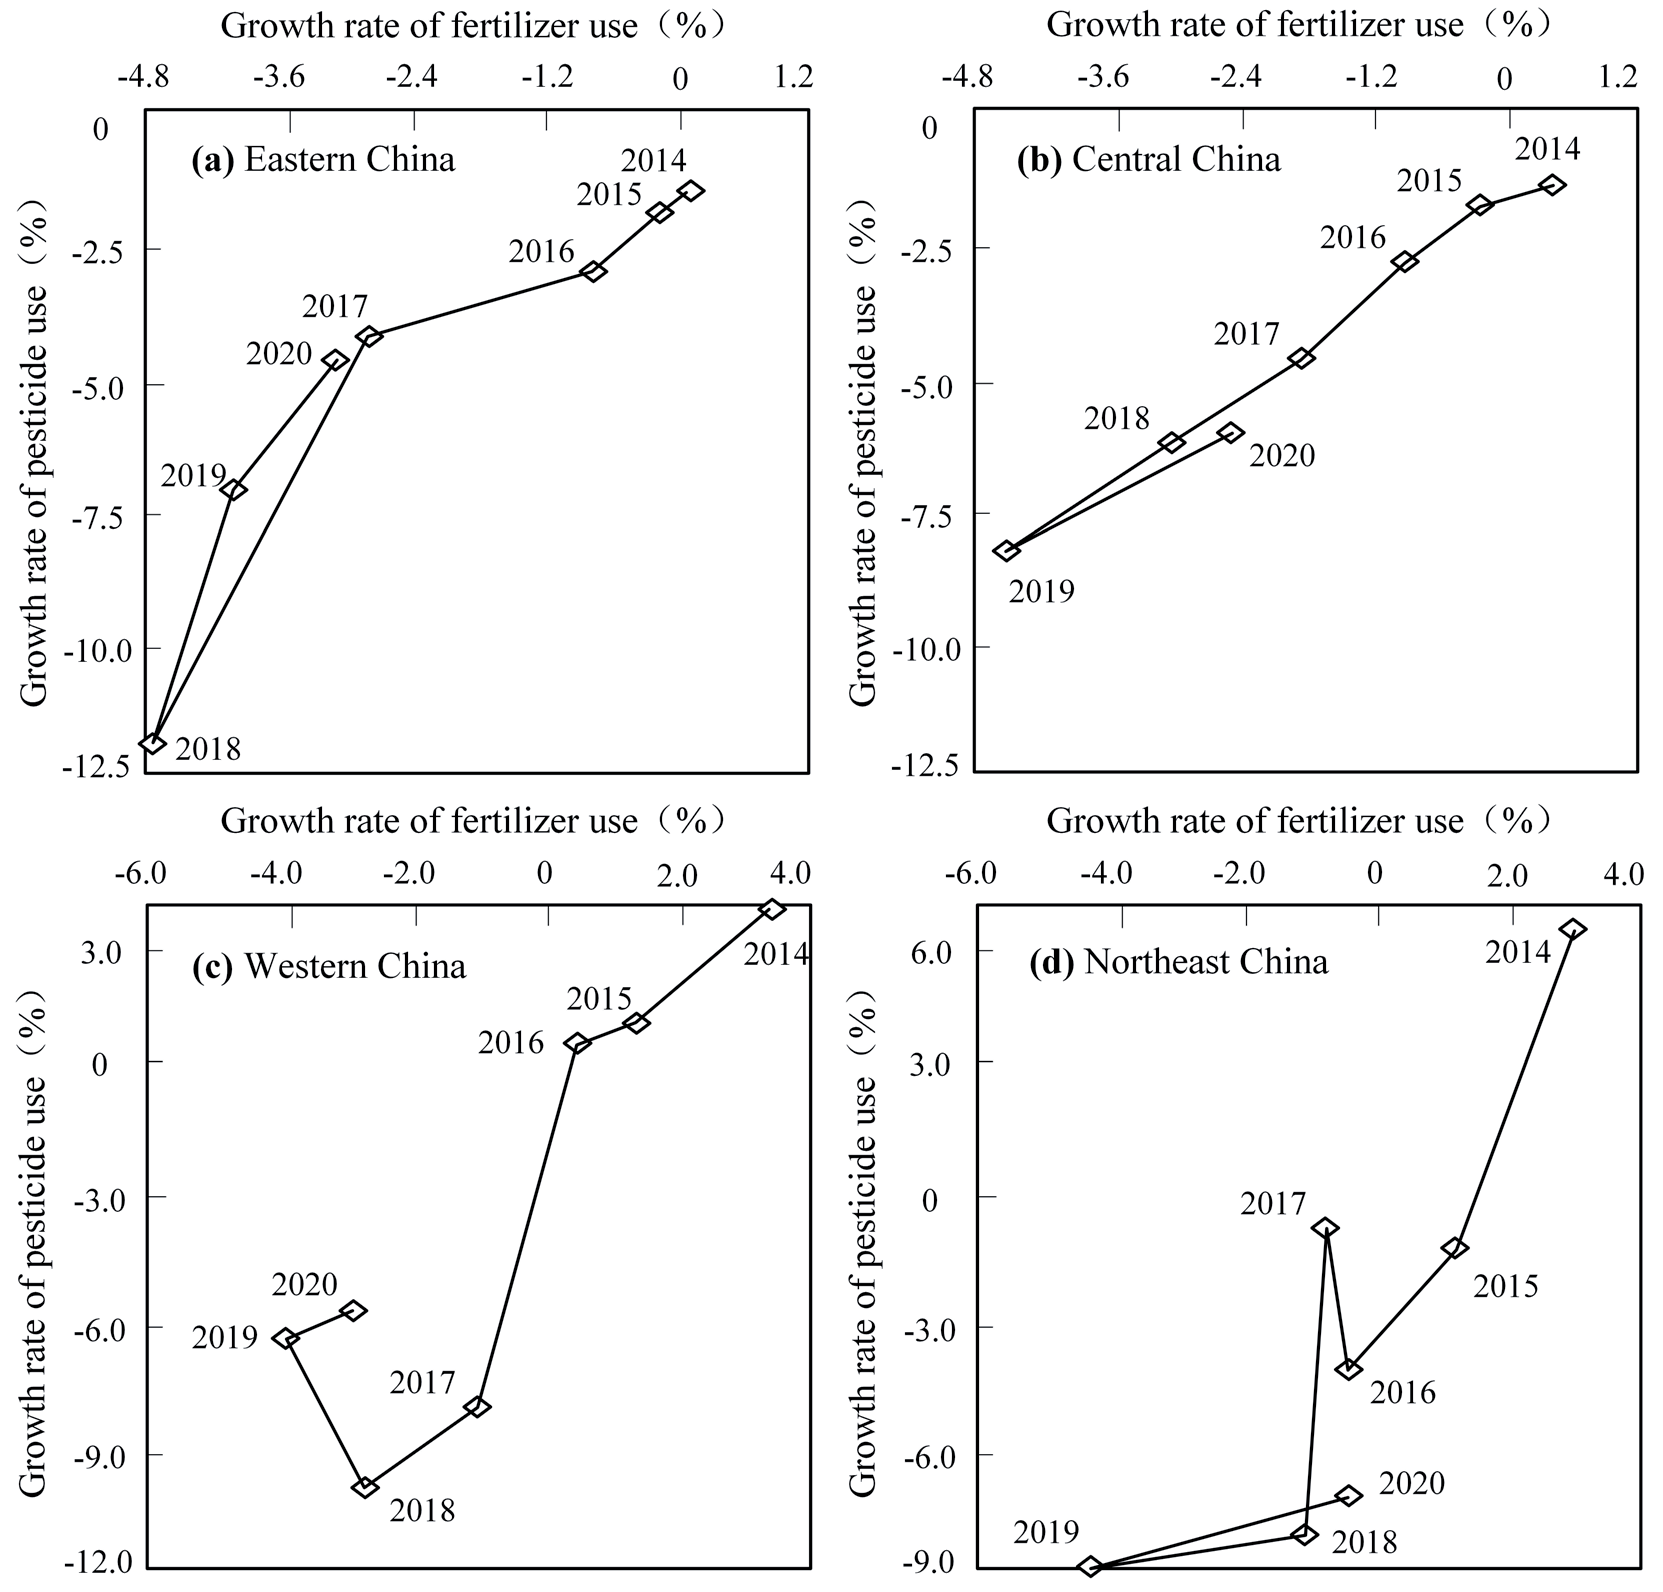
Furthermore, this research calculates the synergistic mapping of fertilizer reduction and pesticide reduction in the eastern, central, western, and northeastern regions of China from 2014 to 2020, respectively (Fig. 3). For the eastern region of China, fertilizer reduction and pesticide reduction have shown a rapid decline, followed by a gradual rebound, and in 2018 achieved greater “double reduction” results. The reasons for this finding are the results achieved in the eastern region in the promotion of green prevention and control of cash crops, pilot subsidies for biological pesticides, and promoting the application of soil testing and fertilization techniques. In the central region of China, fertilizer reduction and pesticide reduction all show a slow and steady decline followed by a gradual rebound. Because provinces such as Hubei, Hunan, Henan, and Shandong are the main grain-producing areas in China, their fertilizer reduction and pesticide reduction practices must also steadily advance and subsequently reduce the risk of grain yield reduction. In the western region of China, fertilizer reduction and pesticide reduction also showed a rapid decline followed by a slight rebound and were effective in reducing pesticides in 2017. Because Sichuan, Qinghai, Xinjiang, and Tibet grow a large number of cash crops. Cash crops have great potential for reductions in fertilizer and pesticides due to their huge amount of production in Sichuan, Qinghai, Xinjiang, and Tibet. In the northeast region of China, pesticide reduction shows a rapid decline, while fertilizer reduction shows a slow decline. In recent years, northeast China has focused on the promotion of biological pesticides and green control technologies and the development of large-efficient machinery and drones for pest management based on the scale of the land, which is the key to the remarkable results of pesticide reduction. China’s regional fertilizer reduction and pesticide reductions have slowed down in 2019 and 2020, indicating that the difficulty of sustained fertilizer reduction and pesticide reductions is increasing, but the regional trend of “double reduction” remains unchanged.
Table 1.
Definition and description of variables.
Temporal Evolution of SFPR
Equation (1) accounted for the elasticity coefficients of fertilizer reduction and pesticide reduction in 31 provinces in China from 2014 to 2020 and obtained the results shown in Table 2. The value of the elasticity coefficient ρt can determine the relative advantage of reduction in fertilizer and pesticide over time in different provinces. The results show that the relative advantage in Zhejiang, Jiangsu, Tianjin, Hebei, and Shandong in eastern China has been dominated by pesticides. Beijing and Guangdong started to shift the focus of reduction from fertilizer to pesticides. Shanghai is shifting from pesticides to fertilizer. Fujian and Hainan reduction advantage is showing an unstable trend. In central China, Hunan, Henan, Shanxi, Anhui, and Jiangxi’s reduction advantages have been dominated by pesticides, and only Hubei’s reduction advantage is a shift from pesticides to chemical fertilizers. In the western region of China, pesticides have mainly been the reduction advantage of Sichuan, Guangxi, Inner Mongolia, Gansu, and Yunnan. The reduction advantage of Chongqing, Guizhou, and Tibet has shifted from fertilizer to pesticides. The Qinghai reduction advantage is from pesticides to fertilizer. Shaanxi, Xinjiang, and Ningxia reduction advantages show an unstable trend. In the northeast region of China, Liaoning and Heilongjiang’s reduction advantage has been unstable, even showing an increase in fertilizer or pesticide use in some years. Jilin’s reduction advantage has always been dominated by pesticides.
Table 2.
Dynamic trends of fertilizer reduction and pesticide reduction in China.
The results of this study mainly reflect two features. First, China’s pesticide reduction is significantly higher than that of fertilizer. 67.74% of provinces currently have a relative advantage in pesticide reduction. Pesticide reduction is related to the quality of agricultural products and ecological safety and is an important means to achieve sustainable agricultural development and safeguard human health. The Chinese government has put forward strict requirements on the use of chemical pesticides in the newly revised “Pesticide Management Regulations” and strongly encouraged the promotion and application of biological pesticides, green prevention, and control technologies, which undoubtedly provide tremendous opportunities for pesticide reduction. Relatively, excessive fertilizer has a negative effect in the short run, which is statistically insignificant. This result implies the necessity of a long-run strategy for the challenges of irrational fertilizer application structure, low utilization of organic fertilizers, and backward fertilizer application methods by farmers. Another result is that the eastern coastal region, the western autonomous region, and the northeastern grain-producing region of China show an unstable trend of fertilizer reduction and pesticide reduction, and a few provinces are constantly adjusting the relative advantages of reduction to achieve balance. According to this finding, these regions still need to make corresponding practical efforts to find out how to achieve the synergy of the “double reduction” goal.
Driving Factors of SFPR
The panel data of 31 provinces in China are empirically analyzed with Stata software according to Equation (2). First, the regression results of the econometric model are tested for F-statistics to determine the applicability of the variable intercept model. Moreover, this study performs the Hausman test sequentially on the model estimations. The results confirm the credibility of the fixed effect model in this research. Considering the possible variability of influencing factors in different regions, this paper estimates the samples of four regions in groups on the basis of the national sample estimation. Table 3 shows the results.
At the national level, SFPR is significantly influenced by fertilizer reduction policy, pesticide reduction policy, government financial support, agricultural cropping structure, per capita GDP, and total agricultural output value. Among them, fertilizer and pesticide reduction policies show a positive impact on SFPR, which is statistically significant at the 1% level. This result implies that China’s “double reduction” policy has a considerable effect. Also, government financial support has a positive influence on SFPR, which is statistically significant at the 5% level. This result infers that the government’s supporting financial expenditure in implementing the “double reduction” policy is also a key factor in achieving the synergistic goal. An explanation for this finding is that realizing the goal of reducing fertilizer and pesticide use needs agricultural technology support, which in turn requires a large amount of governmental funding. In addition, the agricultural cropping structure has a positive effect on SFPR, which is statistically significant at the 5% level. This result means that the greater the proportion of economic crops planted in the province, the greater the probability of achieving the reduction synergy. At present, the construction of fertilizer and pesticide reduction experimental demonstration areas in China mainly focuses on cash crops such as fruits, vegetables, and tea, mainly because the use of fertilizer and pesticides for cash crops is generally higher than that of field grain crops. Moreover, per capita GDP shows a positive effect on SFPR, which is statistically at the 5% level. This result implies that the higher the level of economic development, the higher the SFPR, because provinces with better economic development have more economic strength to carry out the practice of agricultural green transformation. For example, Zhejiang Province is at the forefront of China’s green development. However, the total agricultural output value has a negative impact on SFPR, which is statistically at the 10% level, indicating that achieving the goal of “double reduction” is difficult in large agricultural provinces. A reason for this finding is that China’s major agricultural provinces are the main regions of grain production and bear the responsibility for ensuring China’s food security. Another reason is that China’s major agricultural provinces are excessively cautious about the practice of reducing fertilizer and pesticides due to concerns about whether the reduction of fertilizer and pesticides will lead to a reduction in grain yield [19].
At the regional level, SFPR’s influencing factors show some similarities and differences in eastern, central, western, and northeastern China. For example, fertilizer and pesticide reduction policies and government financial support have a positive impact on SFPR in the four regions, which is statistically significant, implying that government guidance and support are the key common elements driving SFPR. In addition, agricultural labor affects SFPR statistically significantly at the 10% level in central China. The reason for this transfer is the large number of agricultural laborers from the central region to the developed coastal areas, which hinders the promotion and application of some labor-intensive fertilizer and pesticide reduction technologies. The average arable land size affects SFPR in central and eastern China statistically and significantly at 10% and 5%, respectively, due to the hills and mountains in these areas. This land fragmentation avoids the formation of large-scale operations, which will affect the efficiency of using fertilizers and pesticides. The agricultural cropping structure has an insignificant effect on SFPR in northeast China due to the lack of water resources and the small planting area of cash crops. The per capita GDP impacts of SFPR in eastern and central China are statistically significant at 1% and 5% levels, respectively. These regions are currently in a critical period of green economic transformation. Also, the improvement of the economic level has increased the market demand of consumers for green, high-quality agricultural products, which further promotes the realization of the goal of reducing fertilizer and pesticides. Also, agricultural output value has a positive effect on SFPR in eastern China, which is statistically significant at the 5% level. The economic development of the eastern region is currently at the forefront of China, and the proportion of agricultural output value is declining, which limits the reduction potential of fertilizer and pesticides. In addition, agricultural machinery power shows a positive effect on SFPR in central and eastern China, which is statistically significant at the 10% level since the mechanization level needs improvement in the eastern and central regions, and large and efficient mechanical equipment needs upgrading.
Table 3.
Estimation results of influencing factors in SFPR.
In general, achieving SFPR requires efforts in the whole region of China. On the one hand, in China’s agricultural production practice, the technical path of fertilizer reduction is mainly “precision, adjustment, change, and replacement”, while the technical path of pesticide reduction is mainly “control, replacement, precision, and integration”. They have some similar mechanisms, so that the reduction collaboration can be realized simultaneously through technical or mechanical improvement [30]. The findings of this study show a positive correlation between fertilizer reduction and pesticide reduction in the province, which will undoubtedly provide evidence for promoting the realization of the goal of “double reduction” of fertilizer and pesticides in China. On the other hand, it is difficult to achieve regional synergy in terms of fertilizer reduction or pesticide reduction in reality. Because of the differences in geographical environment, agricultural cropping structure, and national functional location in different regions of China, the potential for fertilizer and pesticide reduction varies greatly. For example, the amount of fertilizer and pesticides used by cash crops such as fruit, vegetables, and tea is different from that of grain crops. Also, the input structure of elements is different in plain areas, hills, and mountains [29]. Some major grain-producing areas even have to bear the responsibility for national food security [19]. Therefore, each province should set fertilizer and pesticide reduction targets according to its own resource endowment characteristics and national strategic requirements, as well as different regions, crops, and time periods.
Conclusions
Despite controlling the growth rate of fertilizer and pesticide use in China, the intensity of fertilizer and pesticide use is still high compared with developed countries, and China still has a large potential for reducing fertilizer and pesticide use. This study demonstrated SFPR from the perspective of institutional and element synergy, aiming at providing a practical reference for accelerating the realization of the “double reduction” goal and reducing fertilizer and pesticides. This study used panel data from China’s provinces from 2014 to 2020 to calculate the regional differences in fertilizer reduction and pesticide reduction and reveal the spatial-temporal evolution characteristics and driving factors of China’s SFPR. This research has the following conclusions:
First, the reduction in fertilizer and pesticides reached 12.43% and 27.32% in China, respectively, showing an increase in the annual values from 2014 to 2020. Fertilizer and pesticide reductions have a positive correlation with each other in some provinces of China. Among them, the inefficient collaborative regions mainly include Guangxi, Chongqing, Ningxia, Hunan, Shanxi, Henan, Jilin, and Inner Mongolia, while the efficient collaboration regions mainly include Beijing, Shanghai, Tianjin, Qinghai, Jiangxi, Guizhou, Zhejiang, Gansu, and Hainan.
Second, SFPR is mainly affected by fertilizer reduction policy, pesticide reduction policy, government financial support, agricultural planting structure, per capita GDP, and agricultural output value. However, the driving factors of SFPR have some similarities and differences in eastern, central, western, and northeastern China.
These findings have the following policy implications: First, some provinces of China require investigating the unstable, unsustainable, and reverse increase of fertilizer and pesticide reduction. The national government should strengthen the sense of responsibility for fertilizer and pesticide reduction at the provincial government level and strengthen cooperation among regional departments. Second, actively formulating the phased target for fertilizer reduction is necessary. Fertilizer reduction needs further efforts in each region through various means, such as national system design, technological innovation, policy support, and publicity. Third, we should actively summarize the systems, models, and practical experience of achieving higher SFPR regions and explore the similarities and differences of successful cases, and provide some experience references for low-efficiency collaborative regions. Undoubtedly, some differences exist in crop structure, economic development, geographical environment, and regional functions among different provinces in China. While emphasizing the promotion of the reduction in fertilizer and pesticides, we should fully consider the differences among regions, crop types, and time stages and promote the “double reduction” step by step.

