
Introduction
The increase in population and development in the Lake Catchment Area (LCA) has led to an increase in the amount of waste entering the lake waters. This phenomenon has led to eutrophication and increased water turbidity. Eutrophication occurs due to the increase in nutrients from residual agricultural activities, settlements, and the decomposition of organic waste, both when the organic waste is still in the river and lake waters. In the past, when development activities in the lake catchment area were low, the amount of organic matter from outside the water body (allochthonous organic matter) was limited, allowing the water body to decompose (self-purification). With the increase in population and development activities in the catchment area, the amount of waste entering the lake from human settlements, agricultural land, and industry continues to increase, increasing the rate of eutrophication of the lake waters [1-3].
Eutrophication rates have increased significantly since the introduction of floating net cage (FNC) fish farming, which produces waste as feed residues, excreta, and excretion products [4, 5]. FNC fish farming is a labor- and capital-intensive enterprise that achieves high production through high stocking densities and high-protein diets [6, 7]. FNC farming techniques produce a lot of organic waste in addition to a lot of fish [8, 9]. “According to Garno (2006), regarding eutrophication in some lakes of West Jawa Province, Indonesia”, each liter of water in Saguling Reservoir received 30.42 mg of organic waste from FNC, Cirata Reservoir received 67.13 mg of organic waste, and Juanda Reservoir received 67.13 mg of organic waste [10]. The increase in eutrophication caused by FNC effluent occurs because 75-80% of nitrogen and 60-75% of phosphorus from the feed fed to fish in FNC are wasted in the aquatic environment as excreta and metabolites [11, 12], even before Guo and Li (2003) stated that more than 85% of nitrogen and phosphorus from the feed entered the area surrounding FNC [13].
The eutrophication of lake waters caused by external and internal wastes is immediately responded to by phytoplankton, which photosynthesize faster when there is sufficient light, thus increasing the abundance of phytoplankton in water bodies [14]. The density of phytoplankton in waters can be estimated by the concentration of chlorophyll a (Chl a), which serves a critical function in photosynthesis [15, 16]. In addition to its use as an indicator of phytoplankton abundance, Chl-a is also used as an indicator of water fertility [17, 18].
Organic waste from FNC activities spreads slowly but steadily in different directions, depending on the intensity and direction of the stream transporting it. Furthermore, the density and period of operation of the FNC determine the extent of organic waste dissemination. For instance, the impact of fish farming using FNC on water quality in Shirati-Sota Bay in Lake Victoria [19] and in Lake Volta, Ghana [20] is only a certain distance away. Whereas in the Umari reservoir in Brazil, the effect of aquaculture using FNCs can be identified up to 200 m from the FNC [4]. About this phenomenon, the question arises: How has the distribution of FNC organic waste been operating for a long time with a high density of FNC, even exceeding its carrying capacity? To answer this question, we conducted research at Lake Batur, Bali Island, Indonesia, where fish farming using FNC has developed uncontrollably to exceed its carrying capacity. This research includes activities to calculate the organic waste load from FNC, the impact of FNC organic waste on water quality degradation, and the distribution of organic matter. In this study, water quality includes parameters of water transparency, water temperature, dissolved oxygen (DO), total suspended solids (TSS), total organic matter (TOM), and chlorophyll a (Chl a)
.
Material and Methods
Study Area
Lake Batur in Bali is an active caldera lake that is a closed lake with a surface area of 15.91 km2, a water volume of 815.38 million m3, an average depth of 50.8 m, and a shoreline length of 21.4 km. Its water comes from rainwater and seepage from the surrounding mountains, with a catchment area of 106.35 km2 [21]. The Lake Batur ecosystem is a multipurpose resource where the land ecosystem is used for settlements, agriculture, plantations, livestock, and tourism, whereas the aquatic ecosystem is used for raw water sources, transportation, aquaculture using FNC, fisheries, and tourism. Unfortunately, the function of this multipurpose lake is now in danger of being lost due to the serious deterioration of the lake’s water quality, characterized by frequent mass fish mortalities.
The decline in the water quality of Lake Batur is strongly suspected to be caused by an increase in organic waste from FNCs, which has increased rapidly in recent years. Based on the latest report of the Department of Agriculture, Food Security, and Fisheries of Bangli Regency, the number of FNCs in Lake Batur in 2022 has reached 18,768 plots. (Fig. 1, red circular line).
Sample Collection
Water sampling for physical, chemical, and biological parameters was conducted on October 4, 2022. Water was sampled in the 0-230 cm water column, which was suspected to be the euphotic zone at the time of sampling. Water sampling was conducted at 9 sampling locations (SL) using 3 m PVC pipes, hereafter referred to as sampling locations 1 (SL 1) to SL 9 (Fig. 1). The description of the sampling sites is given in Table 1. The PVC pipe is lowered into the water column in an upright position until the lower end reaches a depth of 2.3 m. The upper end of the pipe is then sealed with a rubber plug, followed by a gradual lifting of the pipe. Finally, the top rubber stopper is pulled out, allowing the water to drain into the plastic bucket. In this way, water samples are collected through a 2.3 m column of water. Five liters of water are collected from each sampling point. The water is filtered through a Whatman GF/C filter for the determination of Chl-a, TSS and nutrients, while the water is not filtered for the determination of TOM. In addition, all samples were preserved in ice bags and taken to the laboratory for further analysis. As publications on the limnological aspects of Lake Batur in international journals are very rare and this study only conducted a survey, to complete the information on the dynamics related to the limnological aspects that occur in the waters of Lake Batur, data published by previous researchers were used [22-29].
Measurement of Environmental Parameters
Water transparency was determined using a sechi disk, while water temperature and dissolved oxygen were determined in situ using a Horiba U-50 series multi-parameter water quality meter. Nutrients, such as ammonium-N, nitrate-N, nitrite-N, and orthophosphate P were analyzed by the colorimetric method. Total organic matter (TOM) was determined by the permanganate method, total suspended solids were determined gravimetrically based on SNI (Indonesian National Standard No. 06-6989.3-2004), and Chl-a concentration was examined spectrophotometrically [30].
Determination of the Euphotic Zone and the Organic Waste Load
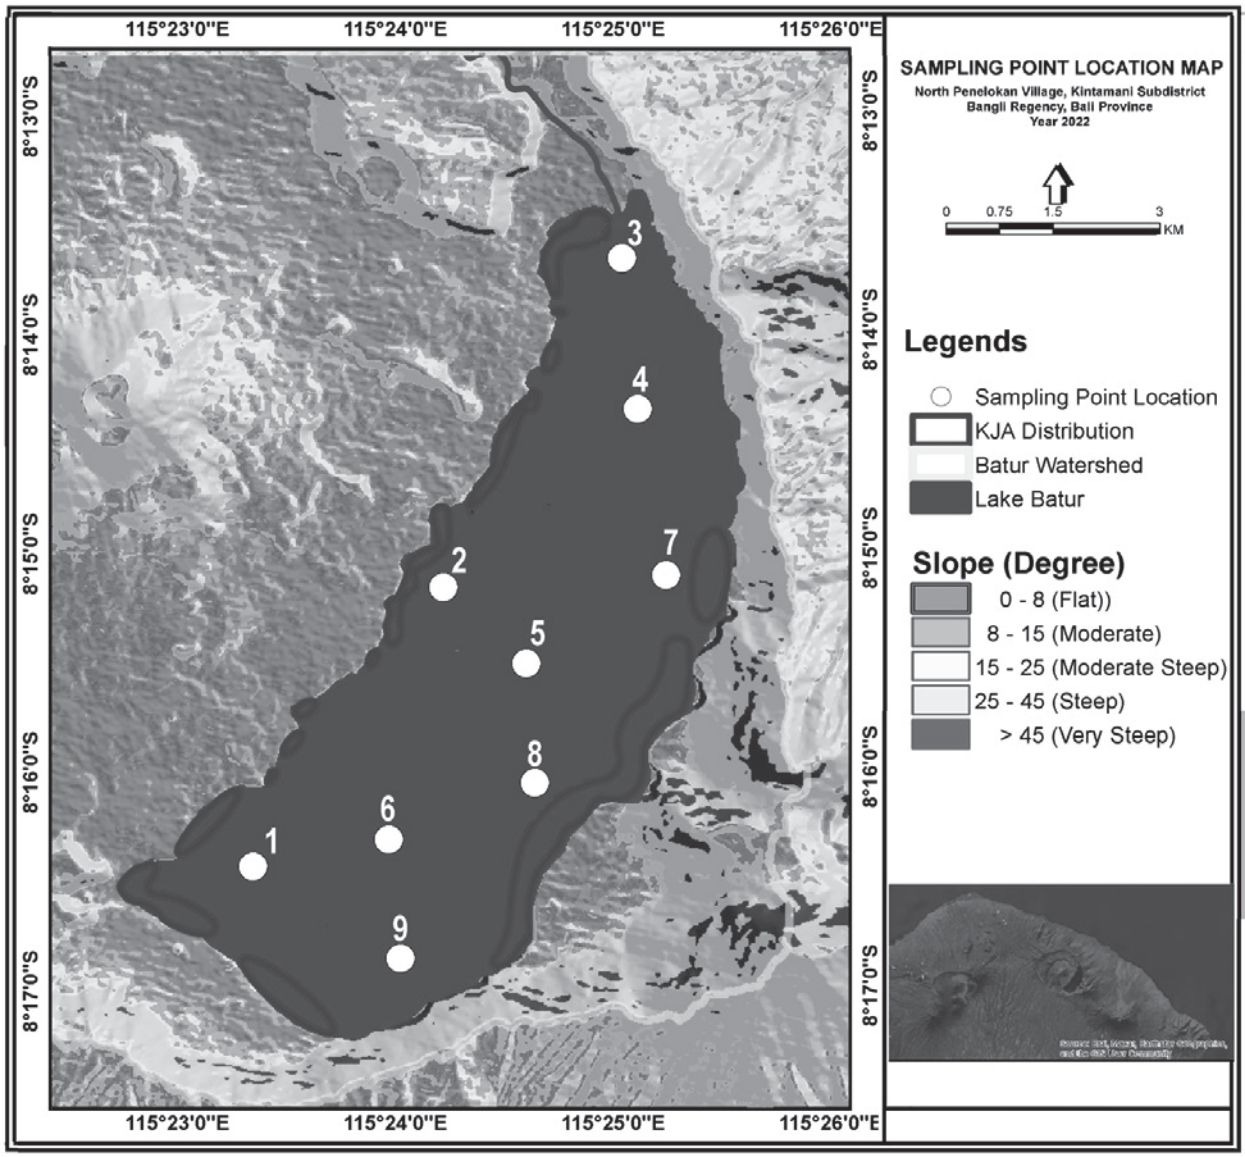
Table 1.
Sampling Location Description.
Table 2.
Steps to determine the metabolic waste load of aquaculture using FNCs.
The euphotic zone is the layer of water between the surface and the layer that receives less than 1% of its energy from the sun [31]. Photosynthesis occurs at this layer [32]. The euphotic zone is 2.3 times the thickness of the water [33]. The organic waste load from FNC refers to the amount of organic waste that remains in the water after one year of FNC fish growth. The organic waste load of the FNC is calculated by subtracting the annual fish production from the total fish feed delivery. The metabolic waste load of FNCs was determined using the procedures described in Table 2.
Results and Discussion
The study results are displayed in three tables, namely Tables 3, 4, and 5. Table 3 displays the FNC organic waste load calculations for Lake Batur during the years 2010 and 2017 to 2022. Table 4 reveals the outcomes achieved through field surveys and lab studies, and Table 5 summarizes the published literature on the limnological aspects of Lake Batur.
Load of Floating Net Cage Organic Waste in Lake Batur
Table 3.
Number of FNCs and their estimated metabolic waste loads in 2010, 2015-2022.
Table 4.
Water Transparency, Water Temperature, Concentration: Nutrients, DO, TOM, TSS, and Chl a in Lake Batur waters.
Table 3 was obtained as described in the methods chapter. The data on the number of FNCs in Lake Batur were obtained from Handayani et al., 2011 [34] and the Department of Agriculture, Food Security and Fisheries of Bangli Regency [35]. Data that fish farmers in Lake Batur feeds fish as much as 720 kg/plot/year, according to Handayani et al., 2011 [34]. The data on the 90% active FNC was obtained from Budiarsa et al., 2018 [36] and the feed conversion ratio (FCR) of tilapia in Lake Batur is equivalent to that in the Cirata Reservoir, which is 1.51 from Garno, 2002 [8].
Aquaculture using FNC in lake water was introduced to the community around Lake Batur in 1997 through pilot ponds, with an initial number of 12 plots of 4 x 4 m2 [36]. Since then, because FNC has a high production rate per unit area and the land rental price is very low or even free, FNC has been well accepted by local fish farmers and started to be developed in Lake Batur.
Table 5.
Some of the physical, chemical, and biological properties of Lake Batur waters from year to year. which are the results of previous researchers measurements.
Table 3 clearly shows the increase in the number of FNC in Lake Batur, which reached 5,625 plots in 2017 after 20 years of introduction, including 1,853 plots on the west shore and 3,772 plots on the east coast. After that, FNC continued to grow in the following years, reaching 18,768 plots in 2022, with 7,398 plots on the west coast and 11,370 plots on the east coast. The trend of increasing the number of FNCs in Lake Batur seems to be uncontrollable. It is known that NFC aquaculture is intensive fish farming that produces a lot of organic waste, affects nutrient levels, increases water and sediment pollution, and ultimately causes eutrophication [4, 37].
The Department of Agriculture, Food Security, and Fisheries of Bangli Regency has worked to reduce the number of NFC in Lake Batur by conducting a study on the carrying capacity of Lake Batur waters for aquaculture using FNC in collaboration with the University of Udayana Denpasar Bali [38]. According to the study’s findings, Lake Batur can only accept up to 1% of its surface area, or around 10,047 FNC plots. It follows that the increase in the number of FNC plots in Lake Batur had to be halted at the end of 2017, with 9,325 FNC plots in 2018 and 11,837 FNC plots in 2019 (Table 3). Efforts to limit the number of FNCs based on carrying capacity are not being met, allegedly due to the weak application of sanctions against violators. It is not unexpected that the number of FNCs expanded even quicker once carrying capacity was exceeded. By 2022, 18,768 plots had supplied 8,675 tons of organic waste containing 2,594 quintals of nitrogen and 618 quintals of phosphorus. Furthermore, as of 2017, Table 3 reveals that the metabolic effluent supply in east coast waters regularly outperformed the metabolic effluent levels in west coast waters by a factor of 1.54-2.96.
Trends in Water Quality Changes
In the past five years, the quantity of floating net cages (FNCs) in Lake Batur has escalated swiftly, surpassing its capacity of 10,074 plots by the end of 2018 and reaching 18,768 plots in 2022, as indicated in Table 3. Due to the FNCs’ ongoing expansion between 2018 and 2022, they produced 29,736 tons of organic waste, which includes 8,893 quintals of nitrogen and 2,152 quintals of phosphorus. It means that annually, the FNC contributes 5,947 tons of organic waste to the waters of Lake Batur, containing 1,779 quintals of nitrogen and 430 quintals of phosphorus. Considering Lake Batur’s water volume of 815,380,000 cubic meters, each liter of water in the lake has received an average of 7.29 milligrams per liter of organic matter with a nitrogen content of 2.18 milligrams and a phosphorus content of 0.53 milligrams annually over the last five years.
Most of the organic waste generated by FNC settles at the lake bottom [4]. The rest of the organic matter present in the water consists of suspended particulate organic matter (POM) and dissolved organic matter (DOM), which together form the total organic matter (TOM). The distribution of TOM throughout the lake is affected by the size, composition, and strength of the currents that transport it to all parts of the lake [6]. Throughout its journey, TOM gradually impacts the quality of the water. The movement of TOM and FNC causes an increase in turbidity and TSS, which decreases water transparency [39].
This decline in transparency diminishes the rate of photosynthesis. In addition, the composition of SOM and DOM fluctuates during movement as some SOM precipitates and some DOM decomposes, including nitrate-N, nitrite-N, ammonium-N (NH3+), and orthophosphate. Phytoplankton uses nutrients for growth through photosynthesis, resulting in increased biomass and dissolved oxygen. Phytoplankton abundance and chlorophyll parameters can indicate increased biomass [40, 41]. However, photosynthesis-induced dissolved oxygen increases may not necessarily raise the overall dissolved oxygen content in the water, as microorganisms may simultaneously decompose organic matter. The following is the water quality condition of Lake Batur and its changes over the past ten years.
During the investigation, the surface water temperature of Lake Batur at nine separate places ranged from 28.44 to 28.99ºC. The temperature range was 28.52-29.10ºC at a depth of 230 cm. The reported water temperature values at all sampling stations in both strata of Lake Batur waters are essentially similar, with any deviations owing to variances in measurement periods. The temperature range implies that the water temperature in the euphotic zone was steady during the study period, resulting in a consistent influence of temperature on water metabolism at all sampling points.
Water transparency measures the clarity of water, which is determined visually using a Secchi disk. The importance of water transparency stems from the need for aquatic plants to undergo photosynthesis with the assistance of sunlight. The clarity of water allows for the depth at which sunlight can penetrate. Water transparency is affected by suspended matter in the water, including organic materials like plankton, microorganisms, and detritus, as well as inorganic materials like sand and mud [39, 42]. The transparency of Lake Batur’s water at nine sampling sites (SL) ranged from 95-115 cm, with an average of 100 cm (Table 5). It means that the euphotic zone of Lake Batur during the study was (2,3 x 100 cm) = 230 cm.
The range of transparency values from this study is smaller than the transparency from previous years (Table 4). The transparency values of Lake Batur in May-October 2011 ranged from 148-297 cm [22], in February 2014 from 175-240 cm [26], and in November 2018-January 2019 from 135-140 cm [28]. The range of transparency values shows that the transparency of Lake Batur’s water tends to decrease from year to year. The decrease in transparency of the Lake Batur water body is strongly suspected to be caused by an increase in TSS originating from land (allochthonous) and water (increased FNC organic waste).
Total suspended solids (TSS) are suspended solids in water that consist of organic and inorganic matter [43, 44]. Organic matter includes phytoplankton, zooplankton, bacteria, fungi, and detritus, while inorganic matter includes sand, silt, and clay [45, 46]. In water bodies, TSS inhibits light penetration into the water column [47, 48], so the higher the concentration of TSS, the lower the transparency of the water body. Thus, TSS affects the photosynthetic activity of phytoplankton and aquatic plants [49, 50]. Human activities and natural factors in the lake catchment significantly influence TSS distribution in the lake [51, 52].
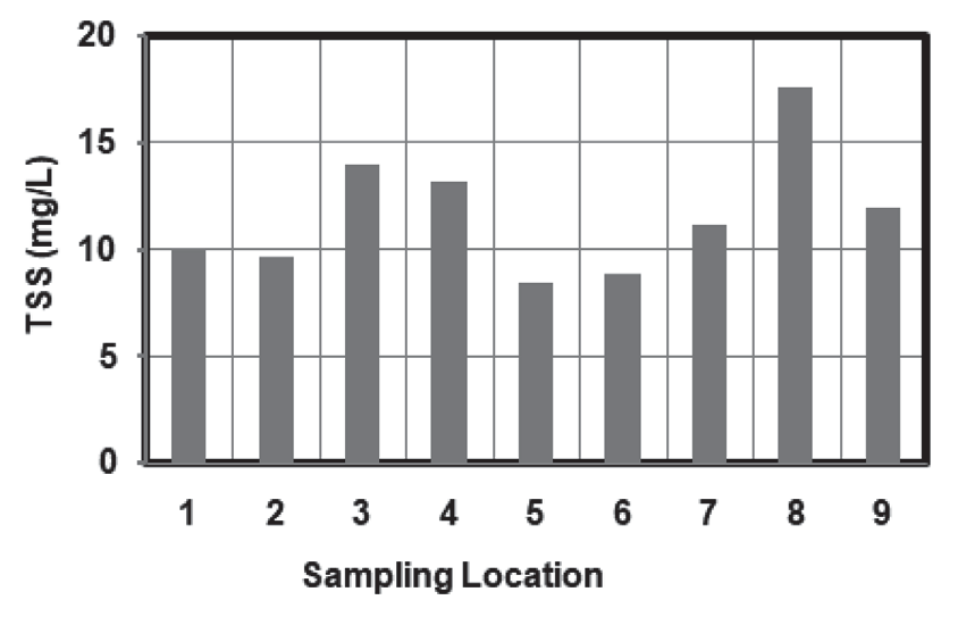
During the study, the TSS concentration in Lake Batur ranged from 8.40 to 17.6 mg/L, with an average value of 11.6 mg/L. The TSS concentration was lower than the TSS concentration in previous years (Table 5). In 2014, Lake Batur had an average TSS content of 7.5 mg/L, 9.2 mg/L in 2015, 8.8 mg/L in 2016, 9.4 mg/L in 2017, 9.9 mg/L in 2018 [51], and 5.0-6.7 mg/L in 2020 [28]. This pattern implies that the concentration of TSS in Lake Batur’s water tends to increase annually. TSS levels at the FNC site and its surroundings have risen due to waste and overfeeding [53, 54].
Nitrogen and phosphorus are essential nutrients for phytoplankton growth through photosynthesis. Chlorophyll phytoplankton can readily utilize nitrate-nitrogen, nitrite-nitrogen, ammonium-nitrogen (NH3+-N), and orthophosphate for photosynthesis. The location and density of dissolved organic matter in lake waters have a significant impact on nutrient dispersion. Nutrient concentrations were higher in areas with high levels of FNC than in areas with low levels. Furthermore, these concentrations tend to increase with water depth [4, 55].
Nitrate-N values in the euphotic zone ranged from 0.30 to 1.20 mg/L. The highest concentration was detected in SL 3, while the lowest was detected in SL 6. Nitrite-N concentrations ranged from 0.003-0.010 mg/L, with SL 1 having the highest concentration and SL 2 having the lowest. Meanwhile, NH +-N concentrations ranged from 0.01-0.10 mg/L. The highest concentration was detected in SL 3, while the lowest concentrations were detected in SL 2, SL 6, and SL 7. The concentration of orthophosphate in Lake Batur’s water ranged from 0.01-0.130 mg/L, with SL 7 recording the highest value and SL 3 having the lowest.
Previous studies on nutrient concentration in the lake yielded varied results, with some higher and some lower than the results obtained in this study (refer to Table 5). Higher concentrations of nitrate-N were found in 2012, ranging from 0.046 to 1.556 mg/L, along with concentrations of ammonium (NH3+-N) ranging from 0.120 to 1.312 mg/L and orthophosphate ranging from 0.011 to 0.384 mg/L [22]. Additionally, in 2018, nitrate-N concentrations were found to range from 0.452 to 0.596 mg/L, with orthophosphate concentrations ranging from 0.332 to 0.488 mg/L [25]. Lower concentrations of nitrate-N and orthophosphate-P were reported by Sagala and Radiarta in 2012, ranging from 0.218-0.345 mg/L and 0.001-0.083 mg/L, respectively [23]. Additionally, in 2016, Wijayana reported similar lower concentrations of nitrate-N (ranging from 0.03 to 0.32 mg/L) and orthophosphate (ranging from 0.167 to 0.318 mg/L) [24].
The existing nutrient analysis results are the nutrients that remain unabsorbed by phytoplankton and are thus contingent on the quantity of phytoplankton present. These nutrient concentrations do not demonstrate a definite connection with the nutrients from the FNC effluent on an annual basis, which amounted to an average of 2.18 mg nitrogen and 0.53 mg phosphorus per liter of lake water from 2018 to 2022. Comparing dissolved nutrients from various areas within the body of water did not indicate any connection to organic effluent supply. However, it may be more crucial to evaluate the total nutrient levels. Prior studies on Lake Batur have exhibited nitrogen concentration levels above 0.3 mg/L and phosphorus concentration levels above 0.01 mg/L, indicating the susceptibility of Lake Batur’s waters to algal growth for over a decade [56].
All aquatic organisms, except anaerobic microorganisms, require dissolved oxygen (DO) for survival. DO is used for respiration by fish and other animals, whereas aerobic bacteria use it to oxidize both inorganic and organic materials [57, 58]. Photosynthesis and atmospheric diffusion are the primary sources of DO in water [58]. The concentrations of DO in the top layer of water (15 cm deep) at Lake Batur ranged from5.75 to 6.77 mg/L, with SL 5 having the highest and SL 6 having the lowest values. The DO concentration was from 4.51 to 6.27 mg/L at a depth of 230 cm, with the highest concentration in SL 5 and the smallest in SL 3. It demonstrates that the difference in DO concentration between surface water, which is 1.02 mg/L, is less than the difference in DO concentration between 230 cm of water, which is 1.76 mg/L. The change in DO content at the FNC site was due to microorganisms consuming DO during the breakdown process [53, 59, 60]. Assuming that the decrease in DO at the same depth was due to the consumption of DO for organic decomposition, the lower difference in DO concentration between the surface water (1.02 mg/L) and the difference in DO concentration between the 230 cm depth (1.76 mg/L) is most likely due to the surface water receiving more additional DO sources than the 230 cm depth.
It shows that the difference in DO concentration between surface water, which is 1.02 mg/L, is smaller than in DO concentration between 230 cm of water, which is 1.76 mg/L. The difference in DO concentration at the FNC site was mainly due to the consumption of DO in the decomposition process by microorganisms [53, 59, 60]. Assuming that the decrease in DO at the same depth was due to the consumption of DO for organic decomposition, the lower difference in DO concentration between the surface water (1.02 mg/L) and the difference in DO concentration between the 230 cm depth (1.76 mg/L) is probably because the surface water receives more additional DO sources at the surface than at the 230 cm depth. At the water surface, DO concentrations can receive additional DO from the air and photosynthesis, while at 230 cm depth, DO is only possible from photosynthesis. Although there are differences in DO concentrations between the upper and lower layers in the euphotic zone, in general, DO in the euphotic layer of Lake Batur is still suitable for the life of aquatic organisms, especially fish. Fish can live in the range of dissolved oxygen concentrations from 5 to 7 mg/L [61].
Existing publications indicate that over the last decade, there has been a downward trend in the dissolved oxygen (DO) concentration in Lake Batur’s waters (refer to Table 5). DO levels in 2011 ranged between 4.92 and 8.25 mg/L [22], which increased to 5.01-10.62 mg/L in 2012 [23] and then ranged between 4.0 and 10.5 mg/L in 2016 [24], before decreasing further to 4.45-5.0 mg/L in 2016 and ranging between 7.41 and 10.87 mg/L in 2017 [25], DO concentrations ranged from 7.90 to 7.07 mg/L in 2019 [27], from 6.9 to 6.4 mg/L in 2020 [28] and from 6.01 to 4.81 mg/L in 2021 [29]. DO values fluctuated widely from 2011 to 2017, with no discernible changes. However, from 2017 to 2022, DO values tended to decrease. The decrease in dissolved oxygen is due to the increasing oxygen demand needed to decompose organic waste from the FNC, which has significantly increased in amount [11].
Chlorophyll-a is the density of phytoplankton that participate in the photosynthesis process within water bodies [40, 41, 62]. It is one of the factors utilized to determine the fertility of water bodies [63]. The concentration of Chl-a in water is affected by various hydrological parameters, including temperature, salinity, pH, dissolved oxygen, flow, nitrate, and phosphate. Human activities affect the concentration of Chl-a in water bodies [64], indicating that many factors contribute to this phenomenon. Chlorophyll-a (Chl-a) concentrations in the euphotic zone of Lake Batur ranged from 134 to 210 µg/L, with the highest concentration at SL 5 and the lowest at SL 3. This concentration range shows a significant difference from the conditions in 2011, where Chl-a concentration in Lake Batur’s waters was between 1.70 and 21.38 µg/L [22], and 9.91 to 61.49 µg/L [23]. Thus, the Chl-a concentration in Lake Batur has increased during the last ten years (see Table 5). Lake Batur’s waters have experienced eutrophication, with Chl-a values ranging from 134 to 210 ug/L, nitrate-N concentrations ranging from 0.046 to 1.556 mg/L, and orthophosphate-P concentrations ranging from 0.010 to 0.130 mg/L [56].
Organic Matter Distribution
The density and distance between FNC waste source sites influence the distribution of NFC organic waste [4, 19, 20]. Because the amount of FNC in the east coast waters of Lake Batur is higher than that in the west coast waters, the effluent entering the east coast waters is higher than that entering the west coast waters. Each liter of water on the East Coast receives 5.04 mg of organic waste each year, with 1.51 mg nitrogen and 0.36 mg phosphorus. Every liter of lake water on the west shore receives only 2.26 mg of organic matter each year, with 0.68 mg nitrogen and 0.16 mg phosphorus.
There is considerable discussion regarding the influence of FNC effluents on water quality, particularly its fertility. The effects of prolonged operation and exceeding the carrying limit of FNCs on organic matter dispersion are still subject to limited discussion. The following is a discussion of how FNCs, which have surpassed their carrying capacity and have existed in Lake Batur for an extended period, affect the distribution of total organic matter.
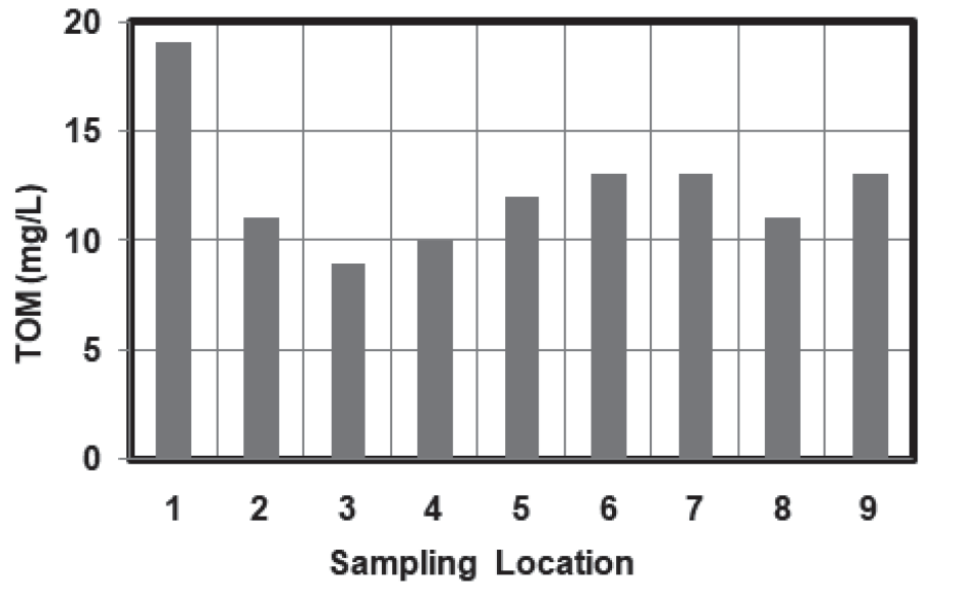
Aquaculture in Lake Batur has been around for more than a decade, and within the last five years, the population has surpassed its carrying capacity. Therefore, it is reasonable to conjecture that TOM from FNC effluent has dispersed into the surrounding waters, albeit in variable concentrations due to varying waste loads. Table 4 shows that, apart from sample location (SL) 1, which had a total organic matter (TOM) concentration of 19 mg/L, the TOM concentration on the west coast (SL 2 and SL 3) was slightly lower at 9-11 mg/L compared to the east coast (SL 7, SL 8, and SL 9), which had a concentration of 11-13 mg/L. The difference is suggested due to the East Coast having an organic waste load 1.54 times higher than that on the West Coast. The average concentration of TOM in the lake’s center was comparable to that of the east shore but marginally higher than that of the west coast. It implies that TOM in the mid-region of the lake is more affected by organic waste from the East Coast, which is more abundant than the West Coast. Therefore, even though there is a significant difference in waste load between the west and east coastlines, as shown in Table 3, there is only a minor variation in TOM concentration between the SLs (Fig. 2). Based on the given information, it can be concluded that the FNC, having operated for a prolonged period and surpassed its capacity, results in a uniform elevation of TOM levels across all sites, regardless of waste distribution (FNC). Consequently, the dissimilarity in TOM concentrations observed amongst SLs is more probable to be tied to environmental activities surrounding the SLs (Table 1). The phenomenon of TOM in SL 1, discovered to be the highest, and TOM in SL 3, found to be the lowest, serves as an example.
Fig. 1 shows that SL 1 and SL 3 are on the west coast and that the coastal area is involved in agricultural and community activities. Therefore, SL 1 and SL 3 have an equal chance of receiving additional organic waste from coastal settlements and agriculture. However, SL 1 differs from SL 3 due to the presence of a tourist pier, while SL 3 has the Tukad Balingkang River mouth. Based on the given parameters, it is reasonable to infer that the total organic matter (TOM) concentration in SL 1 has increased due to additional organic waste from agricultural activities, towns, and tourist piers. Meanwhile, the concentration of total organic matter (TOM) in SL 3 is suggested to increase due to the rise in organic waste from agriculture and settlements, but instead, it decreased. This occurrence was reportedly due to the nearby Tukad Balingkang River. It is worth noting that BMKG (Indonesian Agency for Meteorology, Climatology and Geophysics) records indicate that it rained every day in the Lake Batur catchment area, ranging from light to heavy rainfall, one week before the sampling took place [65]. Because of the frequent rains, the TOM concentration of the water entering the lake via the river is lower than the TOM concentration of the lake water. Because the concentration of TOM in the river is lower, it dilutes the TOM in the lake water as it arrives, causing the TOM in SL 3 to be lower than in SL 1 and SL 2).
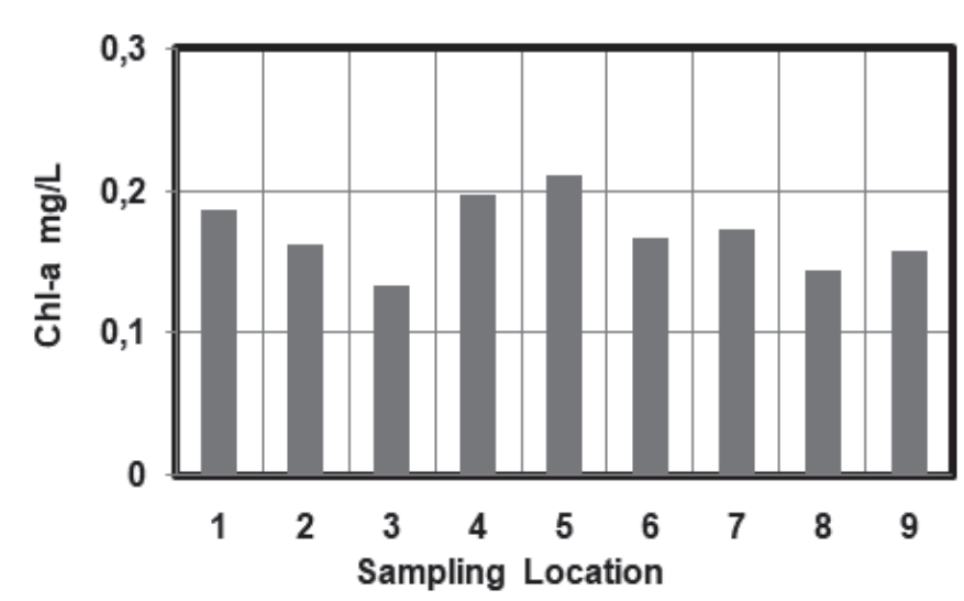
In addition to most organic waste settling, a portion of it undergoes decomposition by microorganisms that produce dissolved nutrients readily available for uptake by phytoplankton for growth and proliferation. Chlorophyll-a (Chl-a) concentrations within Lake Batur’s euphotic zone varied from 134 to 210 ug/L, with the maximum observed at a depth of SL 5 and the minimum at SL 3. Prior studies have established that Chl-a concentrations are a proxy of phytoplankton abundance [40, 41]. Therefore, Chl-a and phytoplankton abundance are used synonymously in subsequent discussions.
Due to FNC’s long-term operations in the waters of Lake Batur, the concentration of dissolved nutrients resulting from the decomposition of organic waste is suspected to be sufficient to foster maximal phytoplankton development. Lab results indicate that NO3-N concentrations ranged from 0.300 to 1.100 mg/L, and ortho-PO4 concentrations ranged from 0.020 to 0.060 mg/L during the investigation. Based on Hendersen and Markland’s (1987) research, waterways containing inorganic nitrogen concentrations above 0.30 mgN/L and ortho-PO4 concentrations greater than 0.01 mgP/L are vulnerable to algal blooms at any given time [56].
When sunlight is present, phytoplankton photosynthesis in each SL is restricted by nutrient concentrations, TSS, and transparency. This hypothesis suggests that the highest phytoplankton abundance in SL 5 is due to its lower TSS concentration and higher transparency compared to other SLs, which enable photosynthesis to occur more efficiently, resulting in an increased abundance of Chl-a (as seen in Table 4, Fig. 3, and Fig. 4). The low phytoplankton abundance at station 3 resulted from elevated total suspended solids (TSS) in the Tukad Balingkang River water, which diluted the phytoplankton. Similarly, at station 8, phytoplankton density was low due to high TSS levels that hindered photosynthesis and curtailed primary production. The TSS concentration in SL 3 is high due to frequent rainfall in the catchment area of Lake Batur before sampling. Consequently, the Tukad Balingkang River carried a significant load of suspended particles into the lake, resulting in elevated TSS levels. In addition, the high TSS in SL 6 is due to community activities and intensive agriculture in the region that result in rainwater erosion into the lake. Furthermore, SL 6 is a water body with the densest distribution of FNC, allowing for a higher contribution of suspended particles when compared to other SLs.
Conclusion
Discussion of the research results reveals that Lake Batur has exceeded its carrying capacity of 10,047 plots of FNC since 2018 and currently holds 18,768 as of 2022. Within the last five years (2018-2022), the FNC discharged 5,947 tons of organic waste into Lake Batur, containing 1,779 quintals of nitrogen and 430 quintals of phosphorus. Consequently, each liter of Lake Batur water accrues 7.29 mg of organic waste annually, including 2.18 mg of nitrogen and 0.53 mg of phosphorus. Organic waste in Lake Batur has led to a reduction in water transparency, an increase in total organic matter (TOM), a decrease in dissolved oxygen (DO), and an increase in chlorophyll-a (Chl-a) concentrations. These changes serve as indicators of eutrophication and degradation of water quality. The distribution of organic matter across the euphotic zone did not correlate with FNC distribution, suggesting that FNC distribution no longer influences organic matter distribution. Environmental factors surrounding the SL have emerged as the primary driver of differences in organic matter distribution. It demonstrates the dissemination of organic matter in the euphotic zone of Lake Batur due to the constant discharge of effluent by the long-standing FNC, which has surpassed its maximum capacity.