

Introduction
Land use and cover change is a significant topic within global climate and environmental change research [1, 2]. Land use is the most intuitive manifestation of human activities on land, and changes in land use can lead to changes in ecosystems, atmospheric conditions, and hydrological patterns. Construction land, a crucial land use type, has become a vital foundation for societal and economic development [3]. With the swift pace of urbanization and industrialization, alongside the rising demand for construction land, expansion in this sector has become a prevalent global phenomenon, especially in developing nations [4]. In recent decades, China has experienced notable changes in land use, with the most significant being the expansive growth of construction land. Data reveals that China’s construction land area increased from 362,600 km² in 2000 to 385,930 km² by 2015 [5]. However, the scarcity of land resources limits this growth, leading to high-density development and an increase in LDI. LDI, which measures the extent of land use, serves as an indicator of both the quantity and intensity of land development in a region, reflecting the combined impacts of natural and human factors [3, 5]. Understanding the spatiotemporal dynamics and driving forces of LDI is crucial for resolving land supply and demand conflicts and elucidating land use mechanisms [6].
Industrialization and urbanization have increased the demand for construction land, and construction land expansion has not only become the most important aspect of land use change but also the focus of land use research. Recent scholarly work has extensively explored the spatiotemporal dynamics, driving mechanisms, and environmental effects of construction land expansion [7-13]. Compared with research on construction land, current research on LDI remains insufficient, and relevant studies focus on the LDI in a region or city. For instance, Huang et al. [5] identified significant LDI variations within the western region, noting hotspots in the Guanzhong Plain and the Chengdu-Chongqing urban area and cold spots in the Qinghai-Tibetan Plateau, Yunnan, and Xinjiang. Despite its generally low levels, Gong et al. [14] observed a segmented upward trend in urban land use intensity in Guangzhou.
Scholars attribute construction land expansion and LDI to multiple factors, including economic growth, population increase, and regional specifics [6, 7, 15, 16]. Among these, income and urban population growth are considered primary drivers [6, 16]. Besides socio-economic factors, political and institutional elements also significantly influence construction land expansion. Scholars also report that urban land expansion results from both market forces and public policies, particularly in transitional economies like China [15, 17]. He et al. [17] examined the effects of fiscal decentralization and political centralization on China’s urbanization, concluding that political and financial incentives from land development drive urbanization. Similar findings were reported in studies of land use changes in Sihui County, Guangdong Province [18], underscoring the importance of supply-side factors in urban land expansion and addressing gaps in previous demand-focused research [8, 16, 19].
Although previous studies have enriched our understanding of the main influencing factors determining land use change, they have notable limitations. Most studies have concentrated on the scale and pace of construction land expansion, often neglecting LDI research. LDI encompasses not only the expansion in land quantity but also its quality, structure, and efficiency. Furthermore, studies on LDI in China have predominantly focused on coastal [20], western [5], and northeastern regions [21], as well as individual cities [14], providing limited insight into national-scale spatiotemporal dynamics and drivers. Key questions arise: What are the spatiotemporal dynamics of LDI in China? What driving forces affect spatial variances in LDI, and how do these factors evolve? Addressing these questions is essential for managing urban land expansion and achieving sustainable land use. Additionally, constructing an LDI analytical framework tailored to China’s national context is necessary for guiding land use planning. This study establishes such a framework and measurement model for LDI, quantitatively evaluates LDI in China, analyzes its spatiotemporal dynamics through spatial analysis, and employs the Ordinary Least Squares (OLS) and Geographically Weighted Regression (GWR) models to explore LDI’s influencing factors, aiming to uncover the intrinsic mechanisms of LDI in China.
Data and Methods
Data Sources
The study uses urban and rural construction land (including urban, industrial and mining, rural settlements, transportation, and other construction land) from the remote sensing monitoring data in China in 2010 and 2020, mainly from the spatial distribution maps of land use types covering the whole country in 1:100,000 provided by the Resource and Environment Science Data Center (RESDC) (http://www.resdc.cn). The socio-economic data were obtained from the China City Statistical Yearbook 2011 and 2021. The proportion of developable land and the degree of topographic relief were also calculated from the data provided by the RESDC.
Methods
LDI Measurement Model
LDI can be assessed using the proportion of construction land relative to the total land area, as outlined in the 2010 National Functional Zone Plan and the 2017 National Land Planning Outline (2016- 2030). This method offers a straightforward and clear representation of a region’s overall land development. The necessary data are readily available, the calculations are simple, and comparisons across different regions are feasible. The equation for calculating LDI is as follows:
where LDI stands for land development intensity, CLA is the construction land area, and TA is the region’s total area.
Spatial Autocorrelation Analysis Model
Global spatial autocorrelation measures the spatial correlation of an object from a global perspective. This study uses the global Moran’s I index to evaluate the spatial pattern of LDI in China. The index ranges from -1 to 1: values greater than 0 indicate positive spatial correlation, values less than 0 indicate negative spatial correlation, and a value approaching 0 indicates no spatial autocorrelation, meaning the attribute data are randomly distributed in space. The Global Moran’s I formula is written as [22, 23].
where xi and xj represent the LDI values of prefecture-level cities i and j, respectively; wij is the spatial weight matrix, constructed using a binary adjacency matrix based on queen contiguity; n is the number of prefecture-level cities in the study area.
Local spatial autocorrelation assesses spatial correlation from a local perspective, evaluating the similarity between observed values in a specific area and those in surrounding areas. This can identify clustering and dispersion characteristics within the local spatial pattern. The local Moran’s I (LMI) index is used in this study to identify the spatial pattern of LDI in China, classifying it into four types of agglomeration: High-High, Low-Low, Low-High, and High-Low. The LMI is calculated as [22, 23].
where prefecture-level city i is influenced by prefecture-level city j. Thus, LMI reflects the changing trend in the spatial difference between the two prefecture-level cities.
Index Selection and Model Construction of Influencing Factors
(1) Framework and index selection
To explore the main factors affecting LDI in China, the model uses LDI as the dependent variable and selects variables from natural conditions, socio-economic development, government regulation, and urban features (Fig. 1). The selection of variables is based on several assumptions:
(Ⅰ) Natural conditions are fundamental to land development, directly influencing the available area and development costs. Better conditions increase the proportion of developable land, reduce constraints from cultivated land protection, and lower development costs and expansion resistance [17, 24].
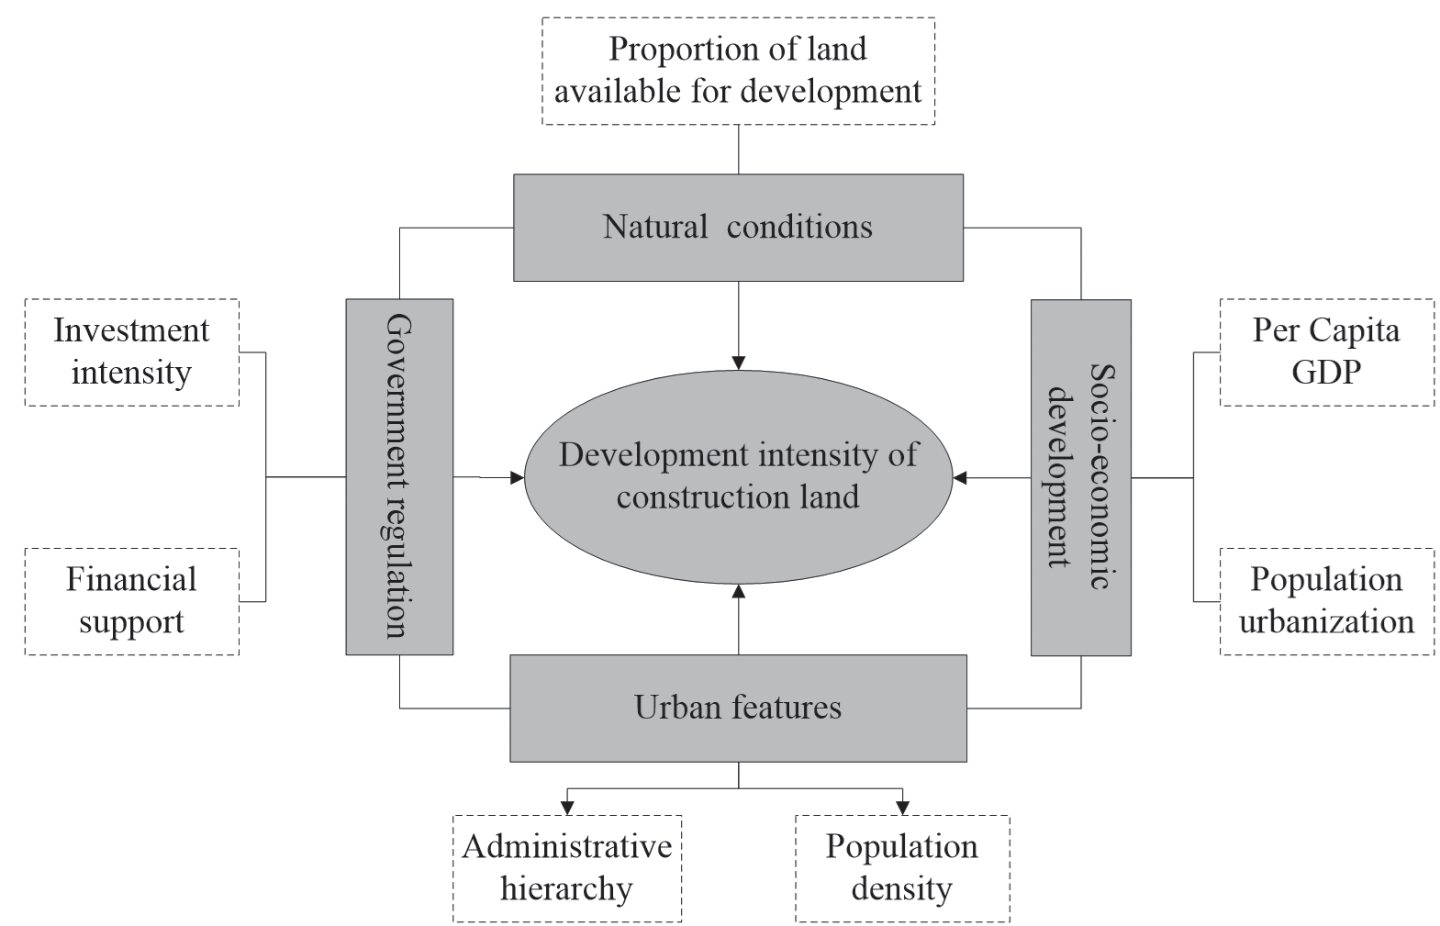
Table 1.
Selection of factors influencing LDI.
(Ⅱ) Socio-economic development is a key driver of land development. Urban population growth has become a significant force for urban construction land expansion. Higher urbanization levels lead to greater demand for construction land [12, 13]. Economic development promotes factor growth and stimulates production activities, increasing demand for industrial, residential, and transportation infrastructure land, thus positively impacting LDI [19, 25].
(Ⅲ) Fiscal expenditure is an effective variable that reflects the role of government in social development [26]. Government investment in transportation infrastructure and public service facilities affects regional development and construction. Regions with substantial investment can attract and gather population, enterprises, and capital, affecting construction land development [21]. Fixed asset investment accelerates infrastructure construction and promotes industrial development, which supports regional construction land expansion and positively impacts LDI [5].
(Ⅳ) The higher the administrative hierarchy in a city, the more it enhances its resource-gathering capability, accelerating land urbanization [27]. Population plays a crucial role in urban expansion [8, 16, 25], and population density, representing urban features and distribution, is closely related to urban markets and agglomeration capacity. High population density areas often require large-scale land development to meet residents’ needs [6, 28]. Thus, LDI results from the region’s combined influence of natural, socio-economic, and institutional factors. Considering multicollinearity, the selected indicators are listed in Table 1.
(2) Model selection and construction
To address the limitations of traditional linear regression models in providing a “global” estimation of independent variables, this study employs both the OLS model and the GWR model. This dual approach allows for a more nuanced analysis of the impact of influencing factors on LDI, both globally and across different regions, thus more clearly illustrating the spatial non-stationarity and evolving trends in the driving mechanisms of LDI. The global regression model is formulated as follows:
where: ε is the error term of the regression model, the regression coefficient β is assumed to be a constant, and the model parameter β0 is generally estimated using the classical OLS model. GWR extends the OLS model, and its regression coefficient is no longer the assumed constant β0 obtained by global information but the βj obtained by local regression estimation based on the subsample data information of nearby observations, which changes with the change of spatial geographic location. The GWR model can be described as follows:
where yj is the dependent variable, xij is the independent variable, εi is the error term, (mi, ni) is the position of i, and βj (mi, ni) is the regression coefficient of the explanatory variable.
Spatiotemporal Patterns of LDI and Its Evolution in PLAC in China
Spatiotemporal Differentiation Pattern of LDI in China
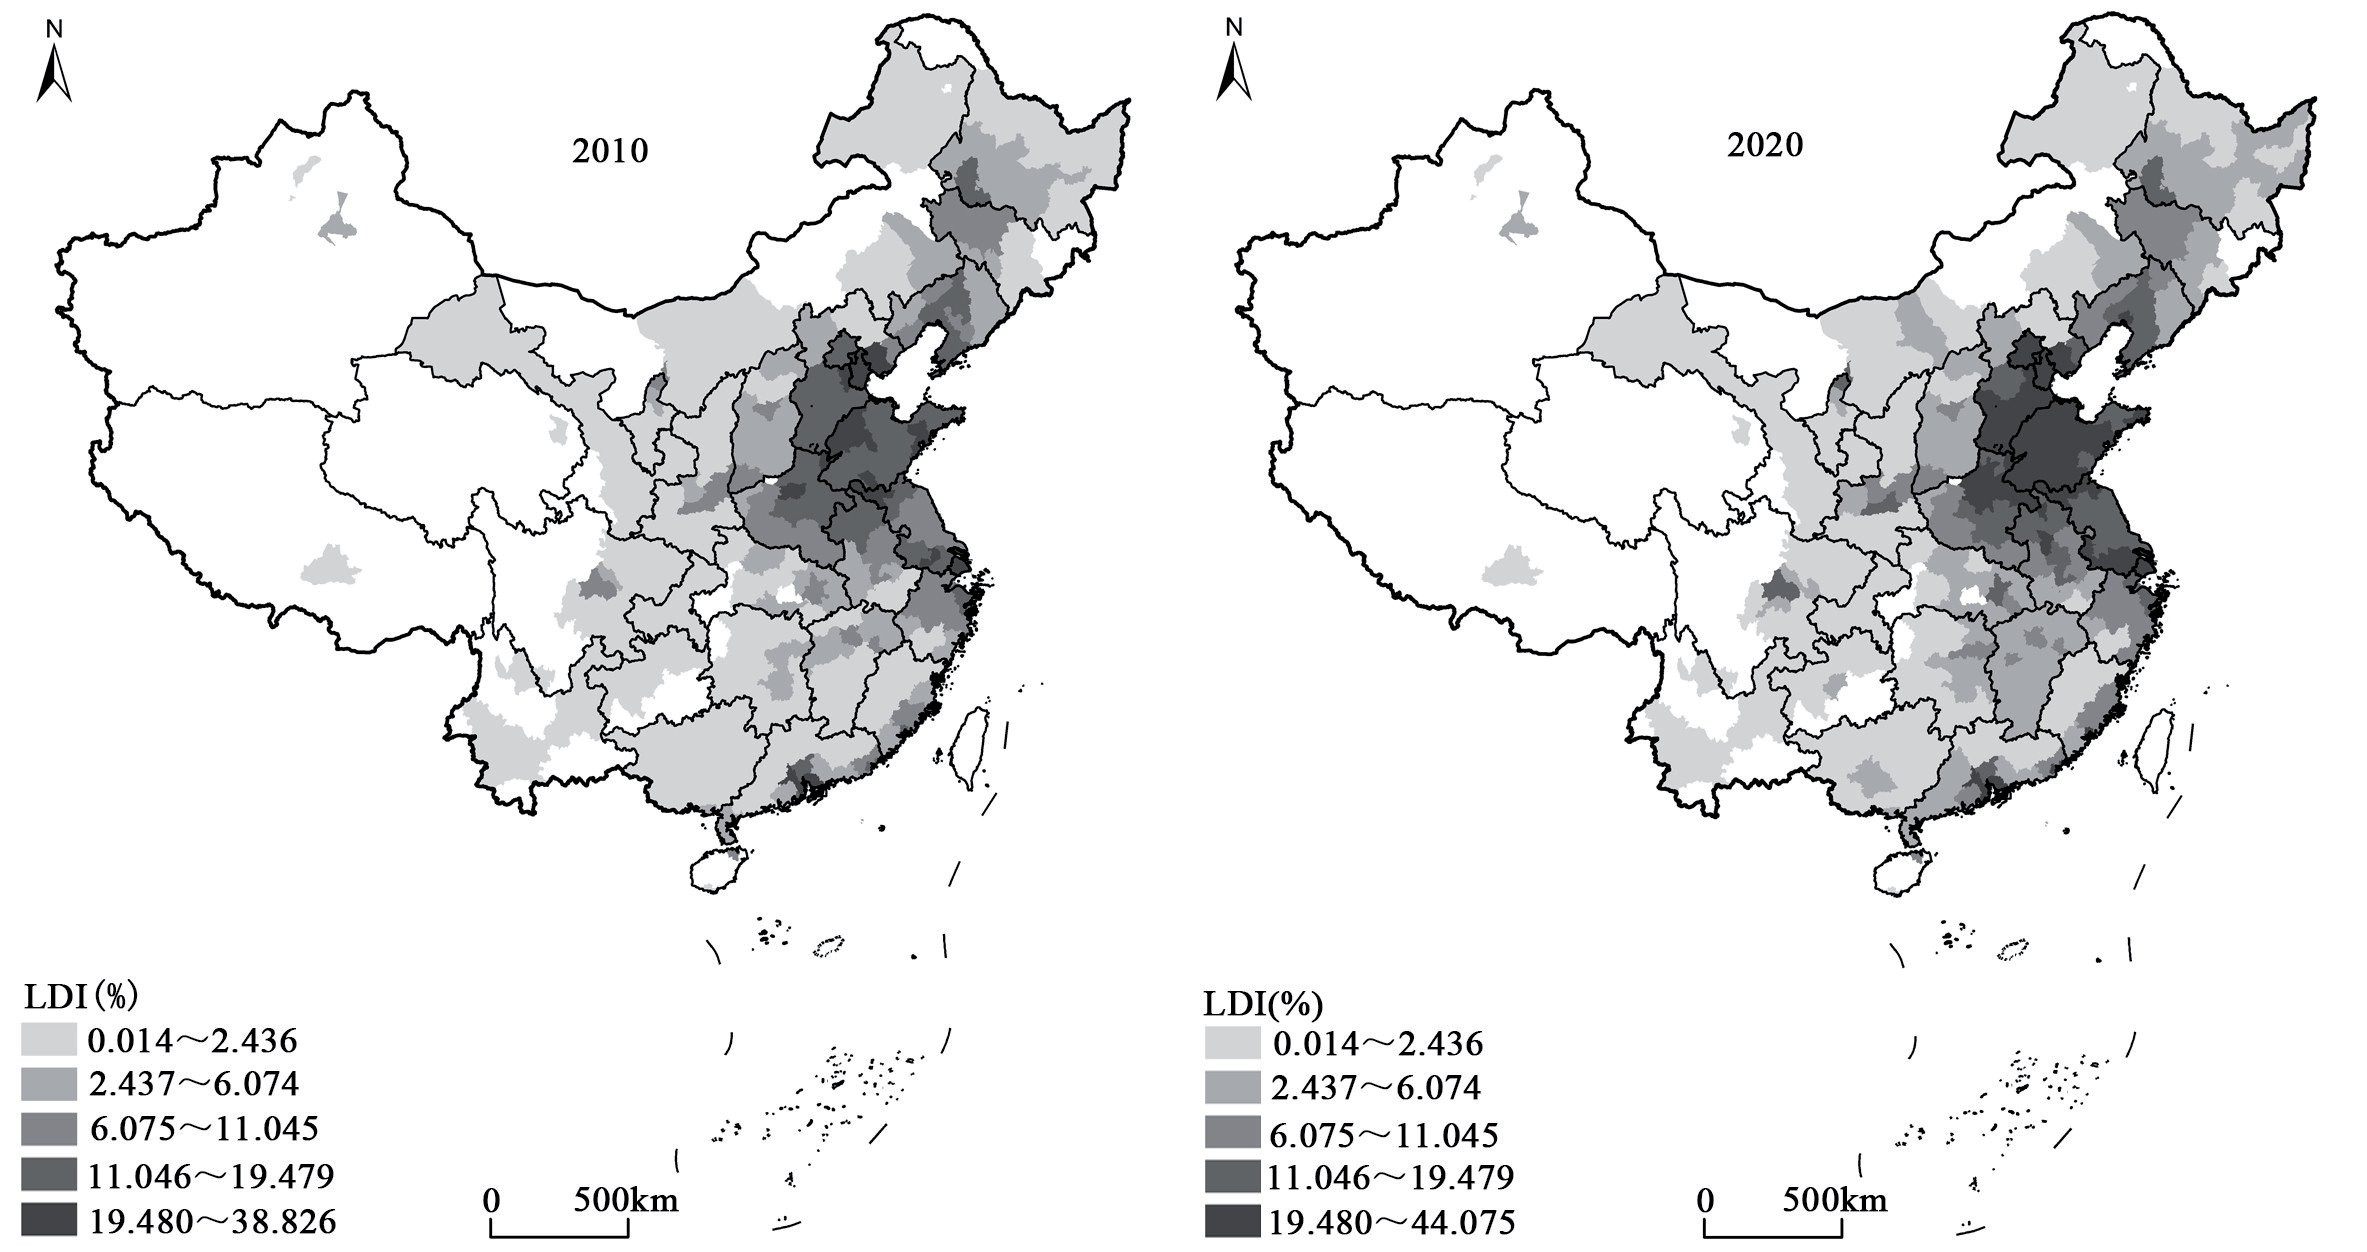
The spatial variations in LDI across China are pronounced (Fig. 2). There is a discernible trend of increasing LDI from west to east. Higher LDI values are predominantly found in the North China Plain and major coastal urban agglomerations, aligning with previous findings [3]. Additionally, provincial capital cities exhibit higher LDI values. As their provinces’ political and economic centers, these cities often benefit from the self-reinforcing cyclical cumulative effect. This necessitates more land space to support continuous urban development and provides greater financial resources for land development, thus driving urban land expansion. For instance, the average LDI in provincial capitals was 7.89% in 2010 and rose to 9.96% in 2020, compared to 3.66% and 4.59% in other prefecture-level cities during the same period.
The influence of provincial capital cities extends to surrounding prefecture-level cities, resulting in higher LDI values, particularly evident in central and eastern regions near large cities. Conversely, prefecture-level cities with low LDI are primarily located in western China and those distant from provincial capitals. These cities face constraints due to natural conditions, economic development, administrative hierarchy, and investment intensity, leading to lower LDI values.
Spatiotemporal Pattern Evolution of LDI in China
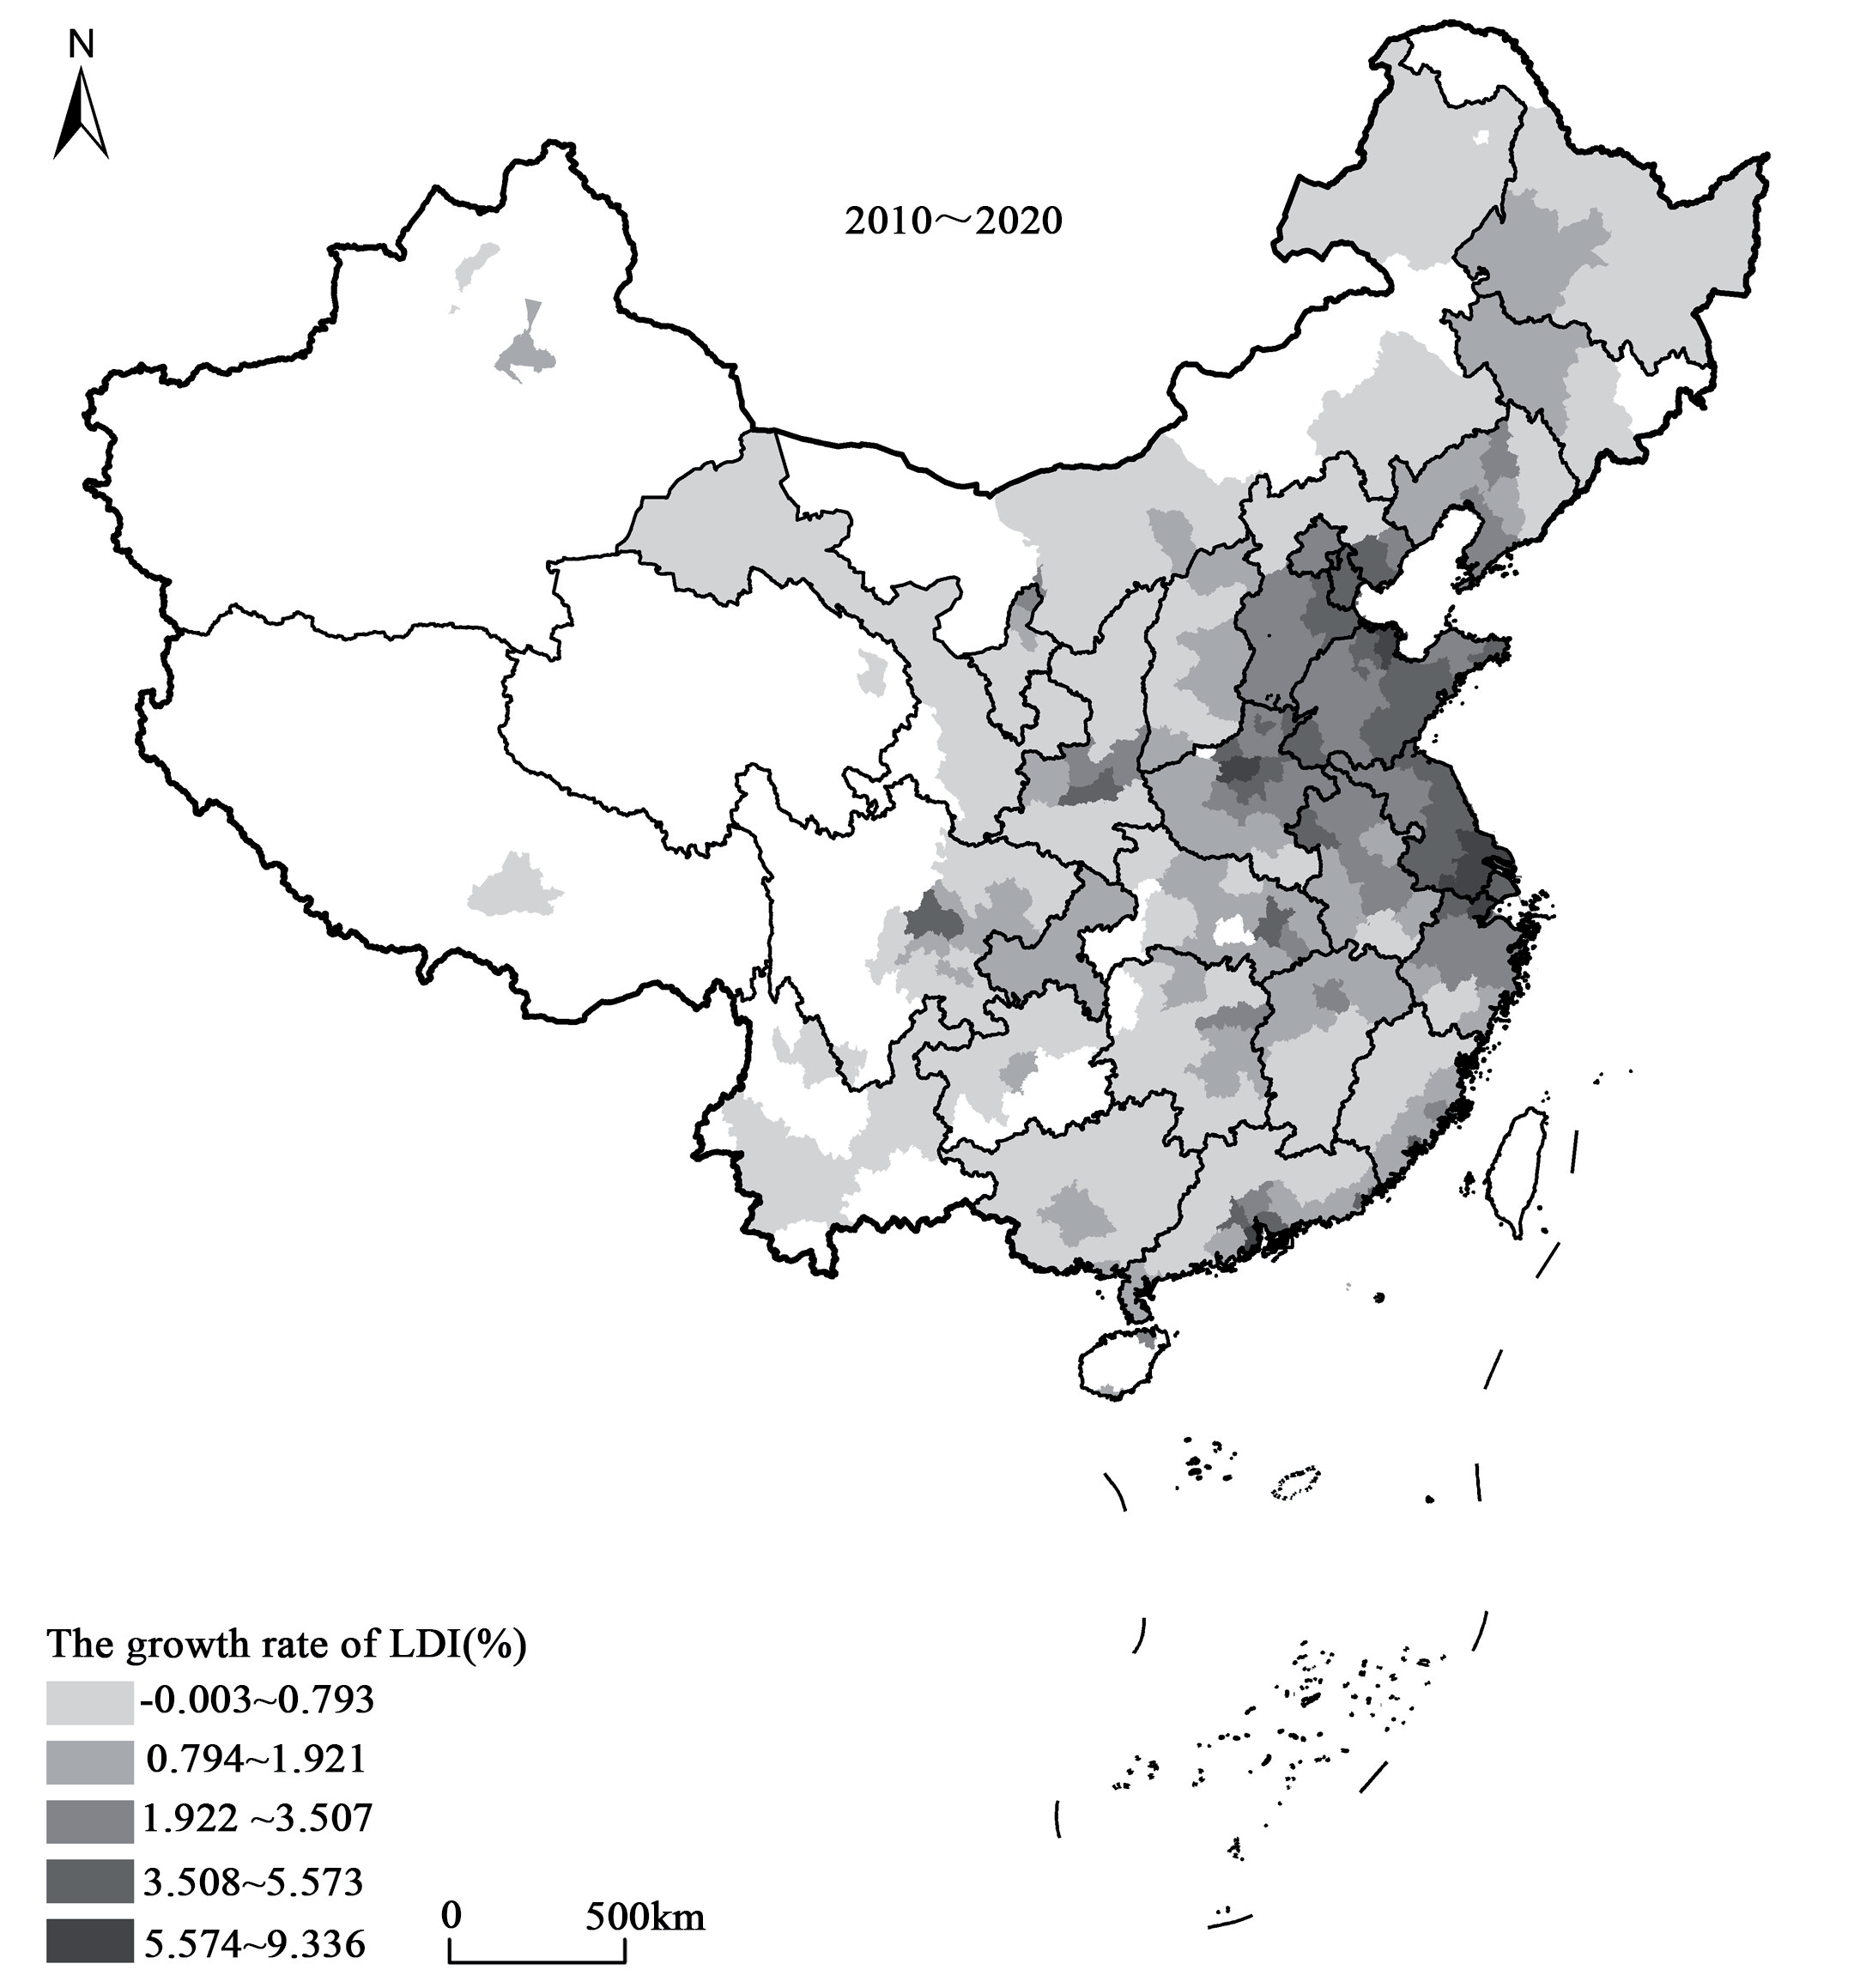
Overall, from 2010 to 2020, China’s LDI has exhibited an upward trend, with the average intensity rising from 4.03% in 2010 to 5.06% in 2020. Specific growth changes (Fig. 3) indicate that the North China Plain, the Yangtze River Delta, and the Pearl River Delta experienced the fastest growth in LDI. Additionally, large cities, especially provincial capitals, showed significant growth. The LDI of provincial capitals increased by 2.07 percentage points during this period, compared to only 0.93 percentage points for other prefecture-level cities. These areas have seen substantial development and are designated as optimized development zones and key development zones in the national “Twelfth Five-Year Plan” strategy. In contrast, the western ecologically fragile areas, where development is restricted or prohibited, experienced slower growth in LDI. Similarly, the northeast region, impacted by economic downturns and population decline, also saw relatively slow LDI growth.
Spatial Correlation Analysis of LDI in China
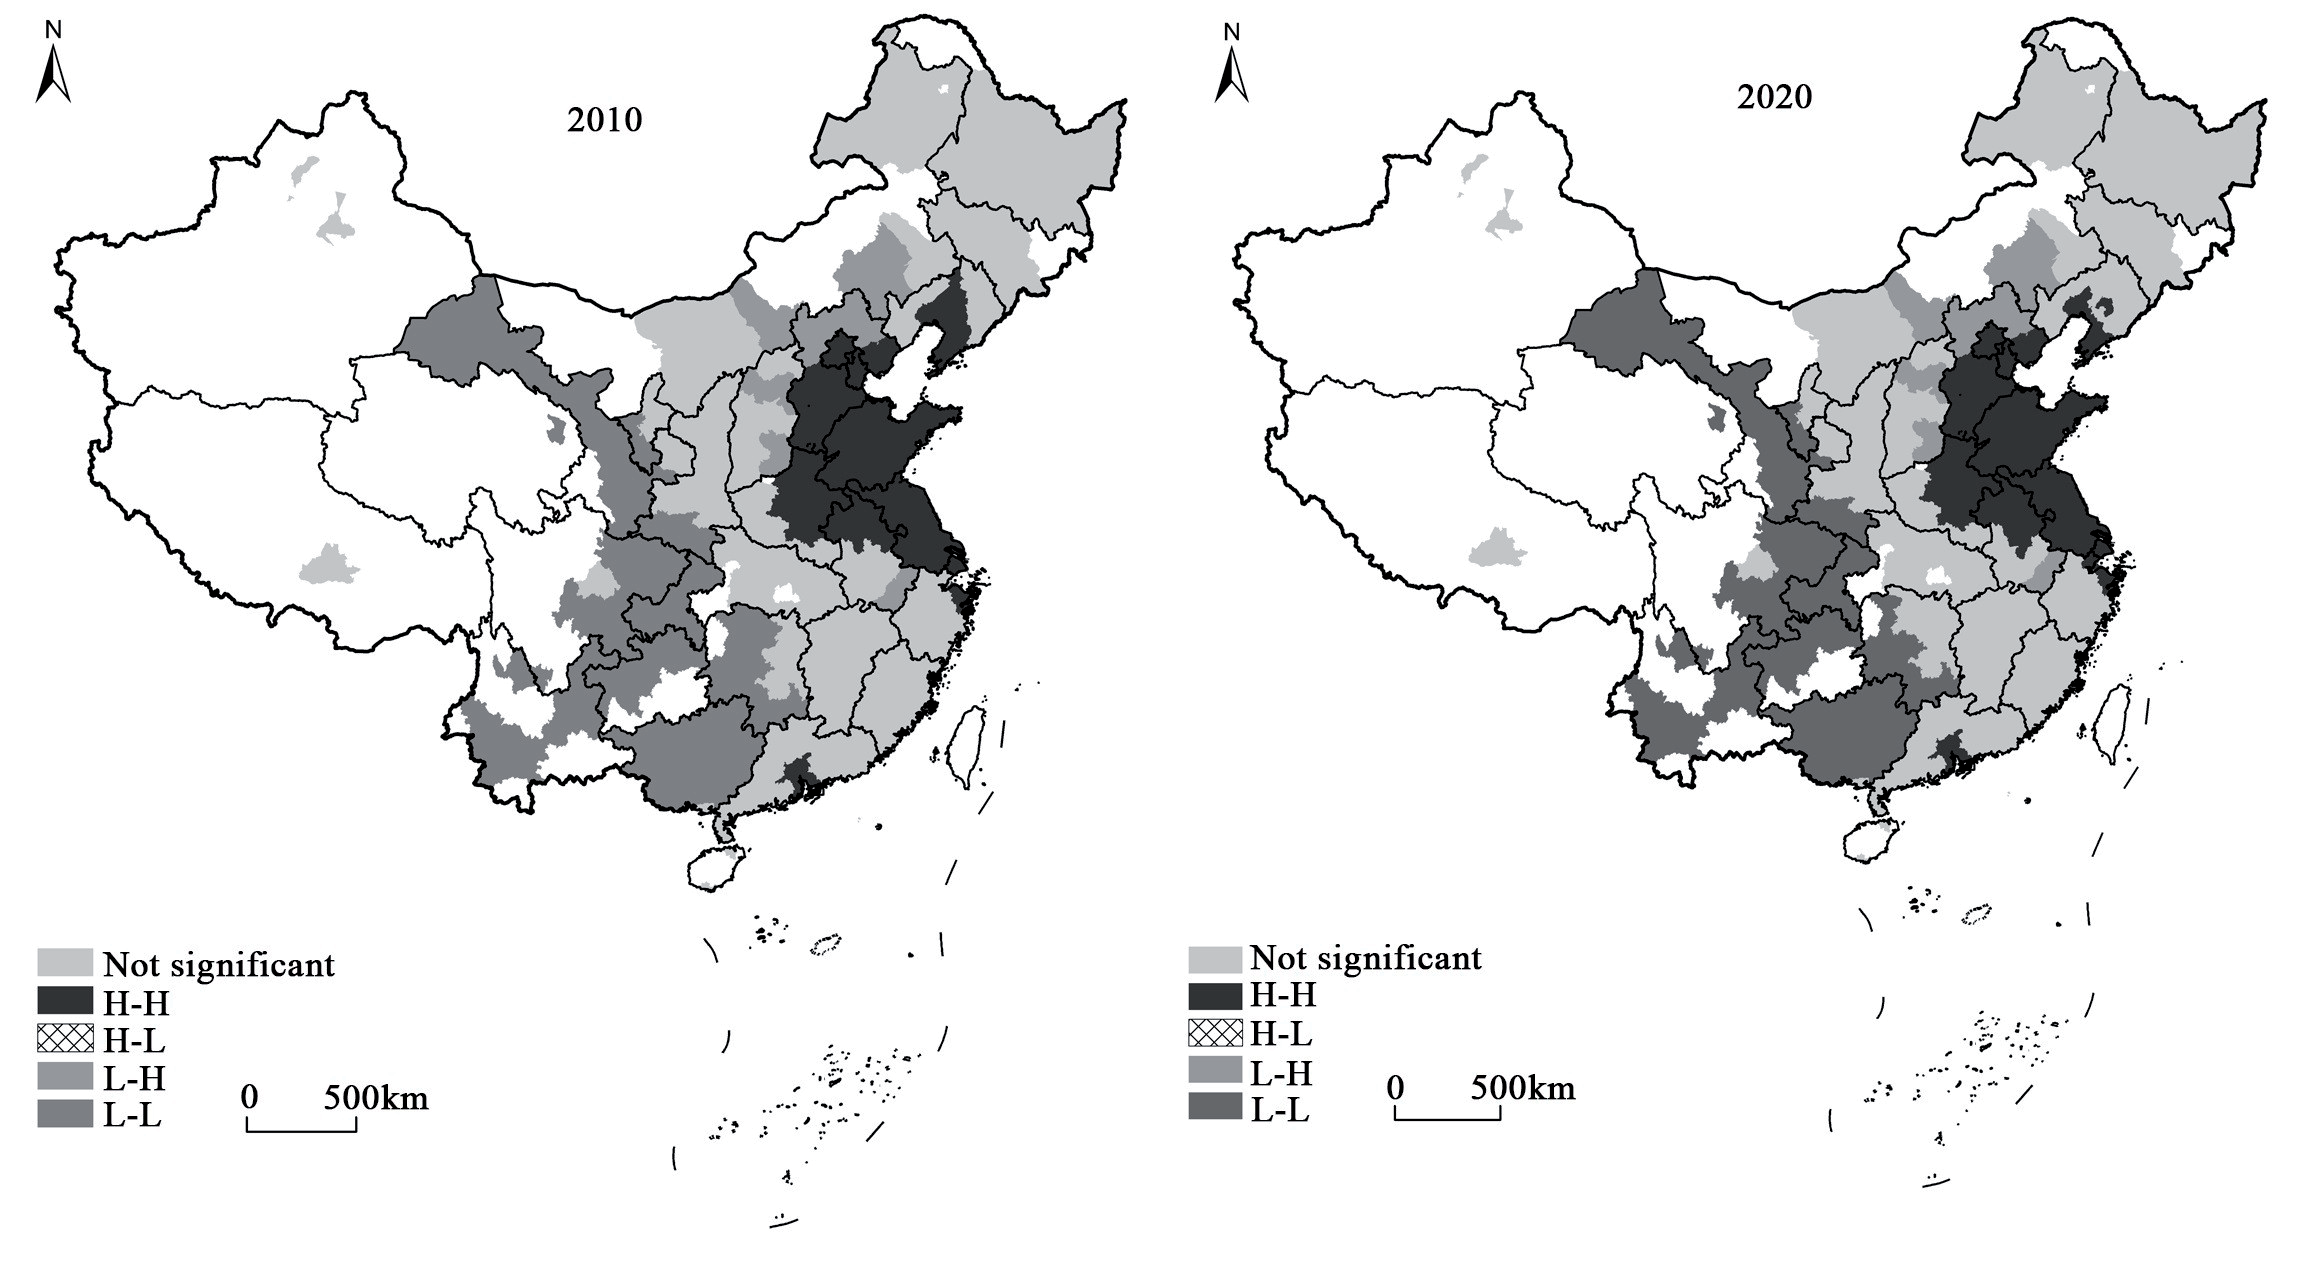
The spatial autocorrelation analysis of LDI in China for 2010 and 2020 was conducted using ArcGIS. The results indicate that the global Moran’s I index for LDI in these two years is significant at the 1% significance level, with values of 0.673 and 0.685, respectively. This suggests that the LDI in China exhibits a significant positive spatial autocorrelation. The spatial pattern analysis corroborates the various characteristics of LDI’s spatial distribution (Fig. 4). For instance, the North China Plain, the Yangtze River Delta, and the Pearl River Delta are identified as high-value areas for LDI, whereas the central and western regions, characterized by fragile ecosystems, exhibit low LDI.
Influencing Factors of LDI in China
Analysis of Influencing Factors Based on the OLS Model
OLS fitting was performed to analyze the influencing factors of LDI in China for 2010 and 2020 (Table 2). The fitting results of the OLS model indicate that the selected variables effectively explain the differentiation pattern of LDI in China for both years, with a goodness-of-fit of 68.6% in 2010 and 66.3% in 2020. In 2010, the OLS model estimation results show that, except for the population urbanization variable, which did not pass the significance test, all other indicators significantly impacted the LDI of China. The direction of the effects was generally consistent with theoretical expectations. Specifically, economic growth stimulates the need for more construction land. Higher administrative levels correlate with larger urban construction land expansion, indicating the influence of government policies and initiatives. Larger populations significantly increase the demand for construction land. High LDI in densely populated areas like the North China Plain, the Yangtze River Delta, and the Pearl River Delta highlights the impact of population size. Higher proportions of developable land, with fewer restrictions from cultivated land protection, favor construction land development. Higher investments promote the intensity of construction land development to some extent. However, financial expenditure encourages the intensive use of construction land, thus inhibiting the expansion of construction land.
By 2020, the model estimation results show that all other variable coefficients pass the 99% significance test except for land-average fixed assets investment. It continues to positively influence LDI. However, the impact of economic development on LDI has weakened due to continuous economic development adjustments and industrial restructuring. Although the regression coefficient for the administrative hierarchy is still positive, it has significantly decreased, indicating a reduction in government intervention intensity on construction land expansion. Population size remains the most influential factor on LDI, with its positive effect becoming more pronounced. The regression coefficient for the proportion of developable land has increased, suggesting that with the strengthened protection of cultivated land, cities with higher proportions of developable land are more conducive to further construction land development. Fixed asset investment no longer significantly affects LDI, indicating a diminishing impact of investment on construction land expansion. Finally, fiscal expenditure shows an increased inhibitory effect on LDI, reflecting a shift from government financial investment-driven urban development toward market and economic factor-driven urban development. Overall, the OLS model analysis for 2010 and 2020 reveals significant changes in the factors influencing LDI in China, emphasizing the evolving roles of economic, administrative, and population dynamics in urban land development.
Spatial Heterogeneity Analysis of Influencing Factors Based on the GWR Model
Model Construction and Fitting Results
The analysis above indicates a significant spatial autocorrelation in the LDI of prefecture-level cities in both years, meaning that the LDI of neighboring cities is correlated or similar. This suggests that using the GWR model to explore the factors influencing LDI is reasonable, as the model can capture the local spatial variations in LDI. Using ArcGIS, the GWR model was applied to assess the factors affecting LDI in China for 2010 and 2020 (Table 3). The spatial heterogeneity of the administrative hierarchy was not significant and thus excluded from the model. The goodness-of-fit for the two years was 81.8% and 78.6%, respectively, which is significantly better than the OLS model.
Spatial Heterogeneity of Impact Factors
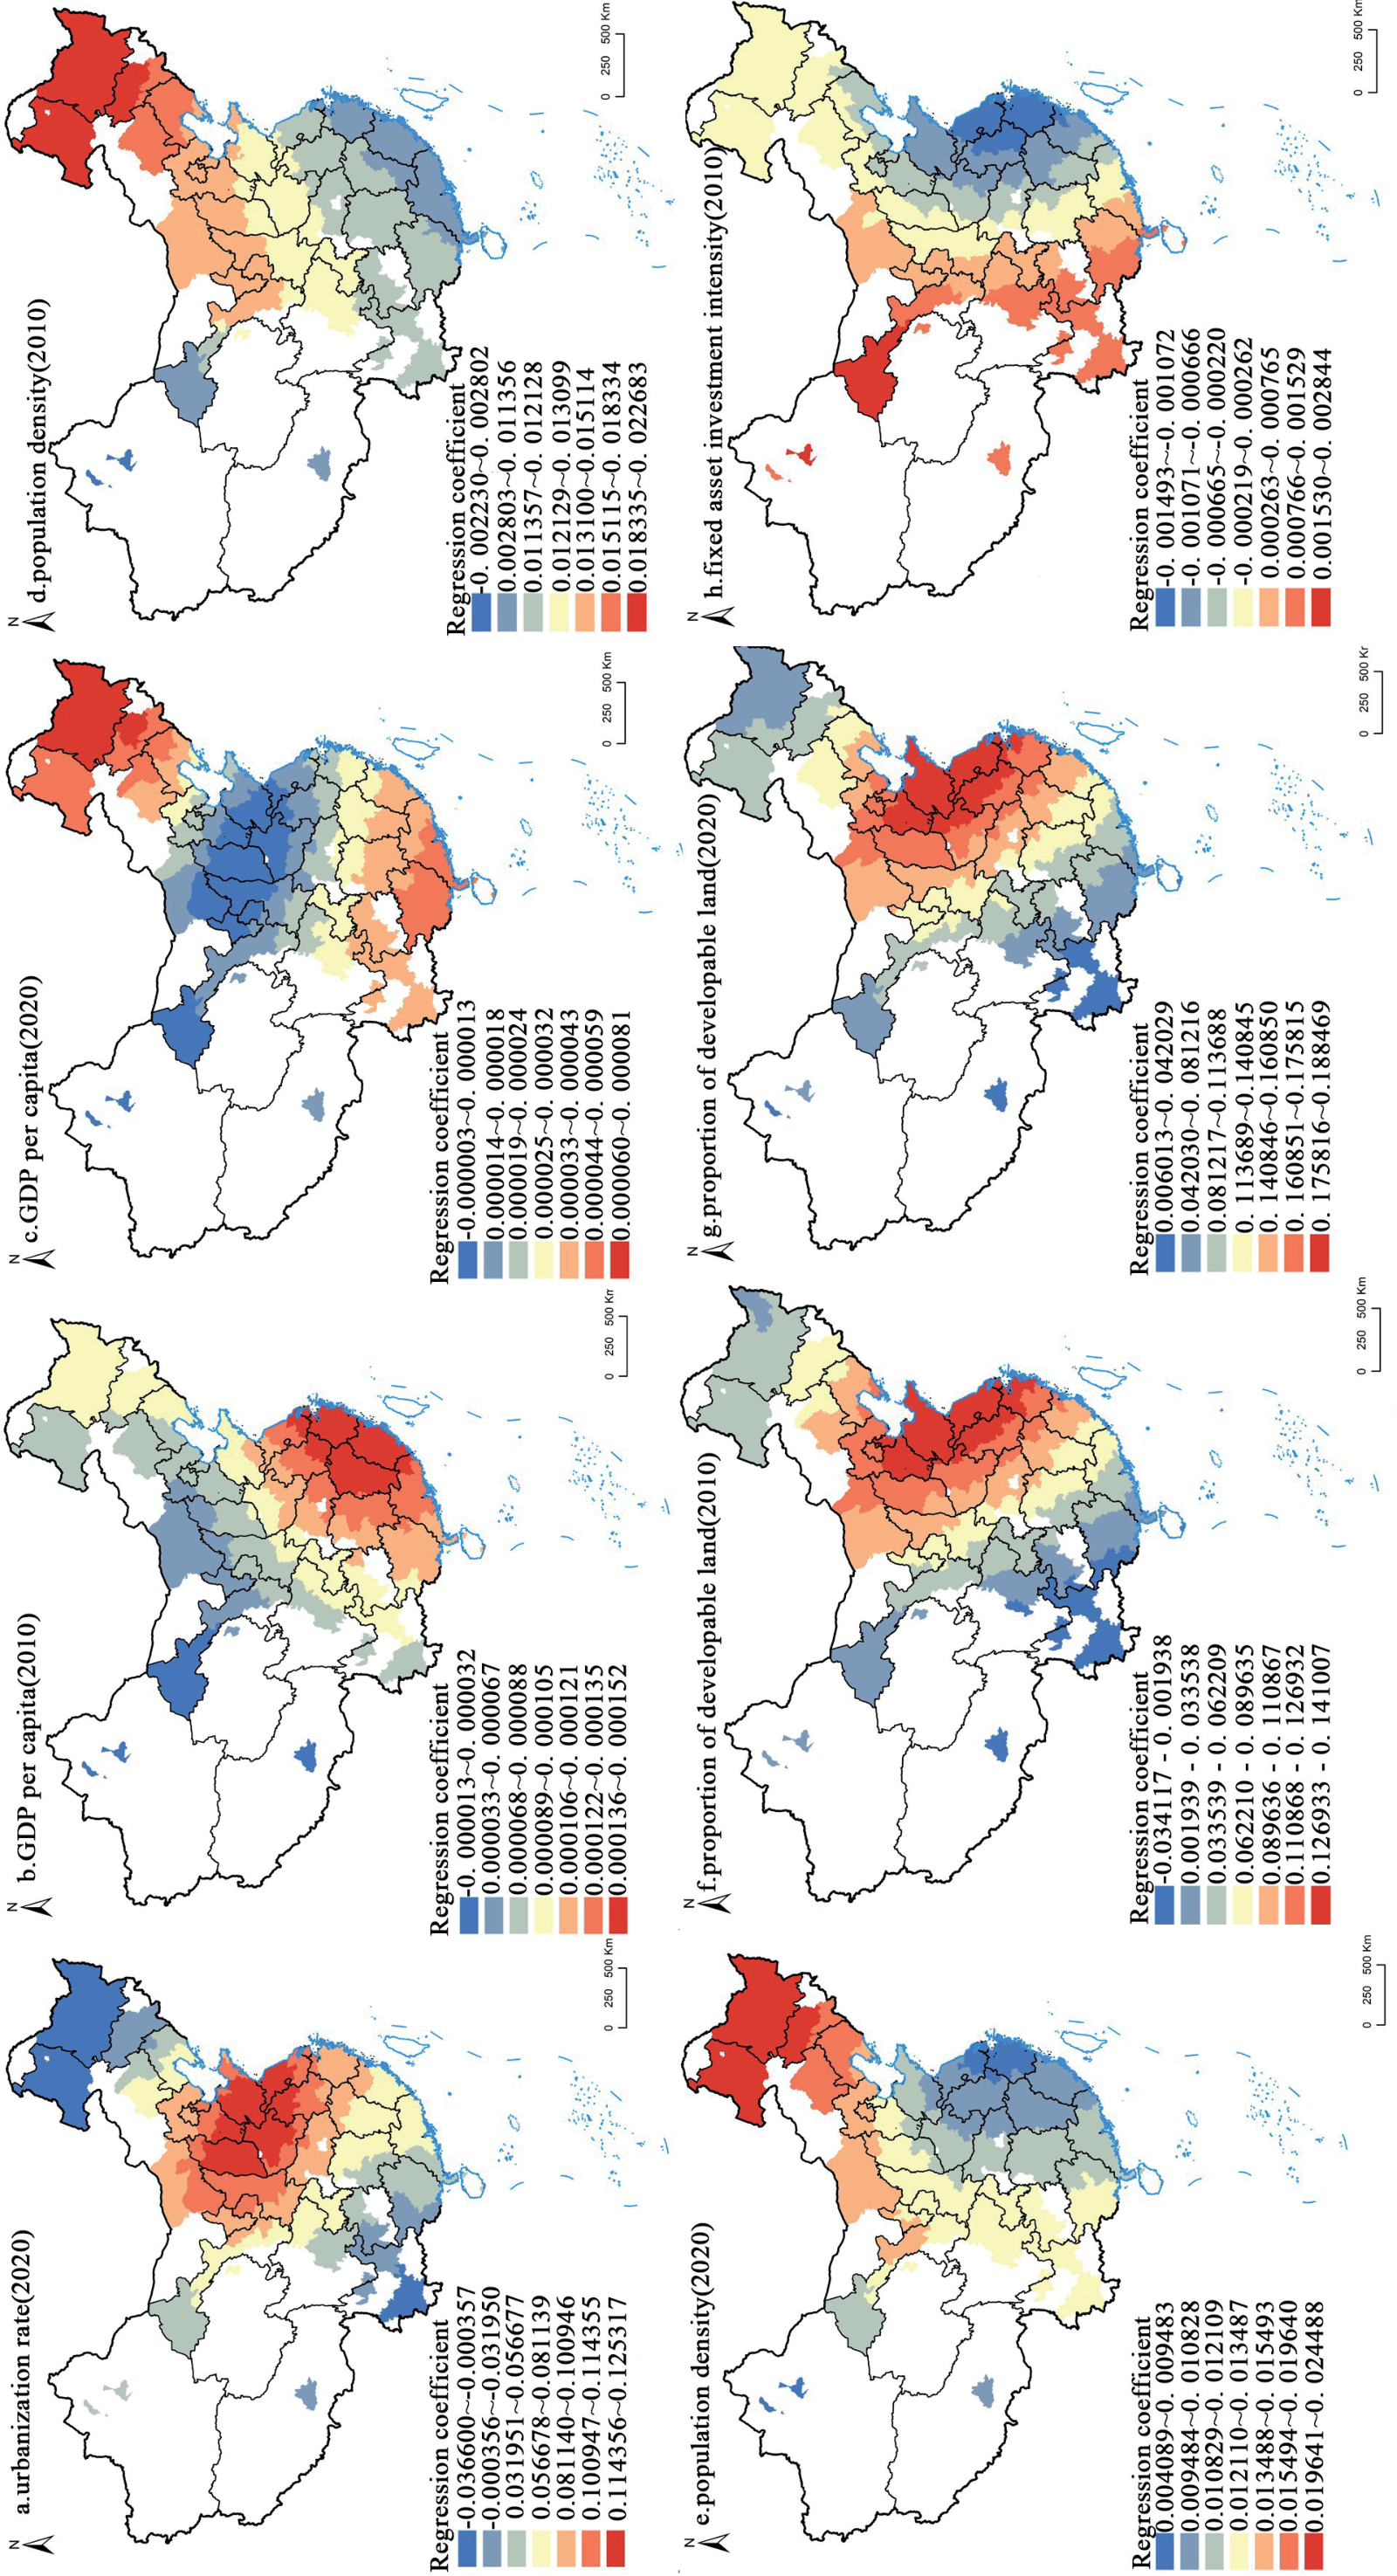
To further investigate the impact of various factors on the spatial heterogeneity of LDI, coefficient estimates for each unit were spatially visualized, allowing a clearer definition of the effects of different variables.
(1) Spatial heterogeneity of the impact of urbanization on LDI in China
The spatial distribution of urbanization regression coefficients (Fig. 5a) shows that urbanization has a greater impact on the North China Plain and southeast coastal areas, while its impact is less pronounced in the northeast and southwest regions. This distribution pattern is consistent with the spatial distribution of LDI in China in 2020. The areas with high urbanization regression coefficients correspond to the hot spots of LDI, indicating high sensitivity of urbanization in areas with high LDI and low sensitivity in areas with low LDI.
(2) Spatial heterogeneity of the impact of economic development on LDI in China
The spatial distribution of per capita GDP regression coefficients (Figs. 5b, 5c) in 2010 showed a decreasing trend from the southeast to the northwest. Economic development in the southeast accelerated LDI, whereas the economic driving effect on LDI in the western regions was relatively weak. This can be attributed to high industrialization and rapid economic expansion in the southeast coastal region, leading to a sharp increase in land demand and higher LDI. In contrast, economic development in the northwest is more dependent on resource extraction and primary industries, which do not require intensive land development. By 2020, the regression coefficients showed significant changes: the economic driving effect on LDI was strong in Northeast China and South China while weaker in North China. This shift is due to industrial restructuring and economic revitalization plans, promoting land redevelopment and utilization in Northeast China. The sustained economic growth and concentrated development of high-tech and service industries in South China strengthened the relationship between per capita GDP and LDI. In contrast, North China, focusing more on quality than quantity in land development, reflected a trend towards rational planning and sustainable land use.
(3) Spatial heterogeneity of the impact of population density on LDI in China
There is a strong positive correlation between population density and LDI. The influence of population size on LDI increased from south to north and west to east (Figs. 5d, 5e). In 2010, population density had a significant impact on LDI in northern China. In contrast, the impact was less in the southeast coastal regions due to a developed economy, higher urbanization levels, and improved land use efficiency. By 2020, the impact of population size on LDI in the Yangtze River Delta weakened, reflecting the region’s rapid technological innovation and industrial upgrading, emphasizing sustainable development and efficient land use. The coordinated regional development strategy promoted by the Chinese government accelerated urbanization in central and western regions, attracting more population and industrial transfers. However, in Northeast China, the impact of population density on LDI remained high due to population loss and slow economic structure adjustment.
(4) Spatial heterogeneity of the impact of natural conditions on LDI in China
The influence of the proportion of developable land on LDI showed a weakening trend from east to west in both years, closely related to China’s topography (Figs. 5f, 5g). The North China Plain and the Yangtze River Delta, with better geological conditions, small relief, and low development costs, effectively support the demand for construction land for urban and industrial expansion. Conversely, constrained by topography and natural disasters, the western region has a smaller proportion of usable land, resulting in a lower impact on LDI.
(5) Spatial heterogeneity of the impact of government regulation on LDI in China
Government regulation in China mainly includes public finance expenditure and fixed asset investment. The influence of fixed asset investment on LDI in coastal areas is small (Fig. 5h), linked to more efficient land use and diversified economic development patterns. In contrast, higher regression coefficients in inland areas indicate that fixed asset investment strongly promotes LDI. Abundant land resources and dependence on land-intensive industries in inland areas drive this pattern. Overall, this distribution reflects the imbalance and regional differences in China’s economic development. Coastal areas are more developed with mature land development, while inland areas are in active development stages, with fixed asset investment playing a key role. For both years, the impact of land-average fiscal expenditure on LDI was negative in most regions (Figs. 5i, 5j), indicating that the era of promoting urban development solely through government financial investment has ended. Urban land development should now leverage market and economic factors instead of relying solely on government investment. Since 2010, the Chinese government has shifted its urban development strategy to focus on new-type urbanization, directing fiscal expenditures towards non-land development fields such as education, healthcare, and social welfare. These expenditures contribute little to improving LDI and may even indirectly inhibit land development due to resource allocation. Overall, the GWR model analysis highlights the significant spatial heterogeneity in the factors influencing LDI in China, emphasizing the need for region-specific urban land development planning strategies.
Discussion
This study analyzes the spatiotemporal dynamics of LDI in China and explores the driving forces behind it. The results show that the spatial variances in LDI across China are evident, exhibiting an increasing trend from west to east. This trend is closely related to China’s geographical, economic, and social development. The western region, constrained by natural conditions such as mountains and plateaus, along with relatively lagging economic development, exhibits relatively low LDI. Conversely, the central and eastern regions have higher LDI due to favorable natural conditions and developed economies, consistent with the findings of Zhang et al. [3]. Additionally, the spatial variances in LDI across China also present characteristics of spatial agglomeration and administrative hierarchy. High-value areas of LDI in China are primarily concentrated in the North China Plain and coastal urban agglomerations, indicating the impacts of population agglomeration, economic development, and administrative hierarchy on LDI. The administrative hierarchy is reflected in the “core-periphery” spatial structure of LDI around provincial capital cities, highlighting the leading role of central cities in regional development.
China’s LDI is on the rise, with the North China Plain, the Yangtze River Delta, and the Pearl River Delta regions experiencing the most rapid growth alongside large cities. Currently, China’s economy has entered the “new normal” stage, characterized by a shift from the previous rapid growth model to a medium-to-high-speed development model and a transition from factor-driven and investment-driven to innovation-driven, resulting in reduced dependence on construction land for economic growth [3]. With the implementation of urban land reduction planning, basic farmland, and environmental protection policies, the development space of areas with rapid LDI growth will continue to shrink. The LDI of the Yangtze River Delta, Pearl River Delta, and other urban agglomerations has reached a “ceiling” [30, 31]. Under this context, local governments in these areas must explore new development models and optimization paths while controlling total land development, strengthening urban land conservation and intensive use, and improving the quality and efficiency of land development.
The study also found that LDI In C”Ina ’s Influenced by multiple factors, with the impacts of administrative hierarchy and population density being particularly prominent. The impact of government financial investment on LDI shows a negative value, indicating that increased fiscal expenditure actually suppresses construction land expansion. With the increasing scarcity of land resources, the government promotes rational land use and avoids overdevelopment by increasing financial investment [32-34]. The impact of fixed asset investment intensity on LDI has shifted from significant to insignificant, reflecting a reduced role of government regulation on LDI, which has become negative. This change results from the government no longer blindly expanding infrastructure investment, instead focusing on improving land use efficiency and curbing disorderly expansion as China’s economy enters the “new normal.”
This study suggests that the main factors affecting LDI in China are urban features rather than socio-economic or government regulatory factors, which contrasts with existing studies [3, 35]. Studies have shown that socio-economic factors, land finance, and political incentives are China’s main drivers of land urbanization [35], with government regulation increasingly influencing construction land development intensity [3]. Cities with higher administrative levels have more control over land supply and attract large populations due to higher income levels, ample employment opportunities, and improved infrastructure, increasing construction land demand and LDI [36-38]. Thus, cities with higher urban hierarchy and population densities will be key areas for controlling urban expansion and achieving sustainable urban land use in the future.
Differences in natural, economic, and social conditions across various regions mean that the impact of different factors on LDI varies. Therefore, land use policies must consider each region’s actual conditions, formulating policies aligning with local development needs. For example, cities with higher administrative hierarchies and population densities should improve land use efficiency and promote sustainable development.
This study innovatively constructs an analysis framework of LDI adapted to China’s national conditions and measures LDI in China. The research results reflect China’s socio-economic and urbanization development status and are significant for promoting coordinated land and population urbanization. The factors affecting LDI are complex, and the substantial differences in natural, economic, and social conditions across regions in China further complicate this issue. This study provides a macro-scale exploratory analysis of LDI’s influencing factors but lacks a deep analysis of the driving mechanisms. Future research should further empirically analyze the driving mechanisms of LDI at different scales and expand the long-term impact analysis of LDI changes on the social economy, environment, and residents’ quality of life, providing more comprehensive theoretical and empirical support for urban sustainable development.
Conclusions
Based on remote sensing monitoring data of land use in China for 2010 and 2020, this study analyzes the spatiotemporal dynamics of LDI and its influencing factors in China. The conclusions are as follows:
The spatial differentiation of LDI in China is significant, showing an increasing trend from west to east. The North China Plain and the major coastal urban agglomerations have become regions with high LDI, with provincial capital cities standing out as the “core” of these regions, forming a typical “core-periphery” spatial structure. From 2010 to 2020, China’s LDI has been rising, with the fastest growth concentrated in economically developed regions such as the North China Plain, the Yangtze River Delta, and the Pearl River Delta, as well as in large cities dominated by provincial capitals. The study also found a significant positive spatial autocorrelation in the intensity of urban land development in China, indicating that the intensity of land development in neighboring areas often affects each other, showing a convergence trend.
In 2010, economic development, administrative hierarchy, population density, the proportion of developable land, investment intensity, and financial input jointly influenced LDI. Among these, administrative hierarchy and population density had particularly prominent impacts on LDI, significantly determining the scale and speed of urban construction. Although fiscal investment impacted LDI, its effect was negative, indicating that increased fiscal expenditure intensity inhibited the disorderly expansion of construction land to some extent, reflecting the important role of policy regulation in land resource management. By 2020, the driving factors had changed, with urbanization emerging as a new impact factor and the inhibitory effect of financial investment on the expansion of construction land being further strengthened.
This study further reveals that different factors have varying degrees of influence on LDI in different regions. This variation reflects not only the different levels of economic and social development across regions but also the regional characteristics of policy implementation and resource allocation. Therefore, when formulating land resource management policies, it is essential to fully consider regional differences and adapt policies to local conditions to achieve optimal allocation and sustainable development of land resources.

