

Introduction
The Yellow River is the second longest river in China and an important water source [1], but the Yellow River is under-endowed with water resources [2] and has a very fragile ecological environment [3]. Despite the unified management and scheduling of water quantity in the basin through the implementation of the unified management and scheduling of water quantity in the basin, the contradiction of water resources is becoming more and more prominent with the socio-economic development and population growth, which seriously restricts the sustainable development of the local economy [4]. The Yellow River Basin is an important ecological barrier and economic zone in China, and the ecological protection and high-quality development of the Yellow River Basin has risen as a national strategy.
In recent years, academics have conducted a lot of research on water management in the Yellow River Basin, which mainly focuses on the following aspects: Firstly, the strategic allocation of water resources in the Yellow River Basin [5], legislative research [6], water rights management [7], and supply and demand balance [8]. Secondly, the water resources efficiency of the Yellow River Basin [9-11], its water resources carrying capacity [12-13], and its water footprint [14]. Thirdly, it explores synergistic management [15] and eco-compensation [16]. Some scholars have explored watershed water management from other aspects, such as spatial and temporal changes in watershed water footprints [17], sustainable management and utilization of watersheds [18], integrated water management [19- 21], and water resources accounting [22].
In summary, existing studies show that there are many studies on water management in the Yellow River Basin, and many scholars try to conduct multidisciplinary cross-sectional studies from different perspectives. However, there are fewer studies in academia on the comprehensive evaluation of water management performance in the Yellow River Basin. Evaluation performance is mostly based on holistic and static analysis, missing the study of internal differences and prediction models for trend prediction. Therefore, this paper focuses on water management in the Yellow River Basin and introduces the entropy weight TOPSIS model to evaluate the performance of water management in the Yellow River Basin while characterizing the dynamic evolution of water management performance in the Yellow River Basin with the help of kernel density curves and exploring the differences in water management performance between the upper, middle, and lower reaches of the Yellow River Basin with the help of the Tyrell’s index. The GM (1,1) model predicted the short-term (eight years) trend in order to provide a reference for promoting water management in the Yellow River basin.
Materials and Methods
Data and Indicators
Data Sources
The data were obtained from 2006-2022 provincial statistical yearbooks, the China Environmental Statistical Yearbook, the EPS database, provincial environmental bulletins, etc. Some missing values were interpolated by the interpolation method and some missing values are supplemented by interpolation. Some indicators are organized by the relevant data calculation.
Study Design
This paper takes the Yellow River Basin as the research object, takes the provincial level as the statistical unit, and establishes the evaluation system of the performance of water management based on an in-depth analysis of the ecological protection and high-quality development strategy of the Yellow River Basin. The entropy weight TOPSIS model is applied to evaluate the performance of water management in the Yellow River Basin from 2006 to 2022. To characterize the dynamic evolution of water management performance in the Yellow River Basin with the help of kernel density curves, explore the differences in water management performance between the upper, middle, and lower reaches of the Yellow River Basin with the help of the Tyrell’s index, and predict the development trend of the Yellow River Basin using the GM (1,1) prediction model, we can generate a more comprehensive overview of water management performance.
Construction of the Indicator System
This paper is based on the in-depth study of water resources protection, water environment management, rehabilitation of water ecosystems, the “combined management of Three Waters”, and the ecological protection and high-quality development strategy of the Yellow River Basin. It refers to the academic community’s selection of water management performance indicators [23-27]. The comprehensive evaluation index system of water management performance in the Yellow River Basin is constructed from the three dimensions of the utilization of water resources, water environment management, and the rehabilitation of water ecosystems. It consists of three primary indicators and 18 secondary indicators. Specific indicators are shown in Table 1.
Utilization of water resources: A water consumption of 10,000 yuan GDP reflects regional water use efficiency; a water consumption of 10,000 yuan industrial added value reflects regional industrial water use efficiency; the utilization of water resources rate reflects the degree of regional water resources development and utilization; per capita water use in the basin reflects per capita water use efficiency and the water use reuse rate; and the water-saving irrigated area reflects the water-saving status.
Water environment management: Urban sewage discharge, total discharge of chemical oxygen demand (COD) in wastewater, and total discharge of ammonia nitrogen in wastewater reflect the effectiveness of regional water pollution prevention and control; the centralized treatment rate of urban sewage reflects the efficiency of water pollution management; and the surface water monitoring section (Class III) or above compliance rate and the drinking water quality of drinking water sources to meet the standard reflect the status of the water quality of the watershed.
Table 1.
Indicator system for evaluating water management performance in the Yellow River Basin.
Rehabilitation of water ecosystems: The ecological environment water use rate reflects the degree of ecological water satisfaction; the built-up area greening coverage rate reflects the improvement of regional ecology to the water environment and the forest coverage rate; the total area of afforestation reflects the surface water storage capacity of the watershed; erosion control area reflects the status of water ecological restoration; and the groundwater water use rate reflects the status of groundwater ecological balance.
Methods
Entropy Weight TOPSIS Method
The TOPSIS model is a decision-making method for approximating the ideal solution to find the best solution. It can objectively evaluate the condition of the research object at multiple moments [28, 29]. This paper chooses the entropy weight TOPSIS model to evaluate the performance of water management in the Yellow River Basin as follows:
(1) Standardization of data and raw data is used to solve the problems caused by the unit of each indicator and attribute differences. This paper uses the polar deviation method for processing, and the formula is as follows:
Equation (1) is used for positive indicators, and Equation (2) is used for negative indicators. i is the province number, j is the indicator number, Xij is the standardized indicator value, and xij is the original value of the indicator. xmax j and xmin j denote the maximum and minimum values of indicator j.
(2) Indicator assignment: Calculate the percentage of indicators, calculate the entropy value of indicators, and then determine the weight of each indicator. The formula is as follows:
Where: i is the number of provinces, j is the number of indicators, m is the number of cities, and n is the number of indicators, Pij indicates the percentage of indicators, ej is the entropy value, and wj indicates the weight.
(3) Conduct a performance-level evaluation as follows:
First, construct the weighted normalized matrix V = (Vij)m×n, where Vij = wjXij.
Second, determine the positive ideal solution Vi+ and the negative ideal solution Vj-.
Third, calculate the distance Li+ of the positive ideal solution from the negative ideal solution Li-.
Fourth, calculate the closeness of the evaluation object to the optimal program C.
The range of values for closeness is generally 0-1, with a larger C indicating a higher level of water management performance.
Tyrell’s Index
The Tyrell’s index is named after the concept of entropy, which can measure the inter-regional gap, and the larger the Tyrell’s index is, the larger the regional gap is. The formula is as follows: Where T is the Tyrell’s index, TB is the inter-group gap, TW is the group gap, and yk is the proportion of the kth group’s water management performance to the total water management performance in the Yellow River Basin. n is the number of research subjects, gk is the group y, and yj is the proportion of the j province’s water management performance to the total water management performance in the Yellow River Basin.
GM (1,1) Prediction Models
The gray prediction model has a simple algorithm, fewer data requirements, and is suitable for medium-term and long-term prediction. The prediction model is set as follows:
It is the new sequence after one accumulation of the original sequence, and the original and new sequences can be expressed as, respectively:
â is the parameter variable to be estimated, â = [a, u]T, a represents the developmental gray, u represents the number of endogenous control grays, and â = (BT B)–1, BT Yn is calculated by the least squares method. The formula for calculating B and Yn is as follows:
Results and Discussion
Overall Situation and Spatial and Temporal Distribution of the Performance of Water Management in the Yellow River Basin
The entropy weighted TOPSIS model was used to evaluate water management performance in the Yellow River Basin from 2006 to 2022, and the results are shown in Table 2. The comprehensive performance score of water management in the Yellow River Basin is characterized by the mean value of provincial scores for each year.
From an overall point of view, the performance of water management in the Yellow River Basin as a whole shows a trend of decline followed by a steady rise, with the integrated water management performance score of the Yellow River Basin at 0.414 in 2006, the integrated water management performance score of the Yellow River Basin at 0.343 in 2011 with a decrease of 17.15%, and the integrated water management performance score of the Yellow River Basin at 0.390 in 2022 with an increase of 13.70%. In terms of time series, the water management performance of the Yellow River Basin decreased slightly from 2006 to 2011 and increased steadily from 2012 to 2022. The water management performance of the basin slightly declined from 2006 to 2011, which is presumed to be due to the weak water management of the basin under the influence of the past rough water management system and the concept of focusing on economic construction. The water management performance of the basin steadily increased from 2011 to 2022, with the No.1 document of the central government and the working conference of the Central Water Conservancy Organization requiring the implementation of the strictest water management system, clearly having an impact in 2011. In 2013, the General Office of the State Council issued the assessment measures for water management, which promoted improving water management performance from 2016 onwards. The 13th Five-Year Plan and the outline of the development plan for the ecological protection and high-quality development of the Yellow River Basin bring forward higher requirements for water management in the Yellow River Basin, which has pushed forward the further improvement of water management performance for the Yellow River Basin.
Comparing the performance of water management of each province in each year, the performance of water management of each province is Inner Mongolia, Shaanxi, Sichuan, Gansu, Henan, Shandong, Shanxi, Qinghai, and Ningxia in descending order. The performance of water management in each province, in chronological order, shows a declining trend followed by a steady increase, with slight ups and downs. The average value of performance water management in each province shows that the average value of performance water management is higher in Inner Mongolia, Shaanxi, and Sichuan. Among them, the performance of water management in Inner Mongolia over all years has been at the forefront of the Yellow River Basin provinces. The lowest average value of water management performance is in Qinghai and Ningxia; the two provinces had relatively low performance in water management over the years. Compared with the average annual growth rate, the Yellow River Basin provinces’ water management performance shows growth only in Shandong, Inner Mongolia, and Henan. The other provinces slightly decreased. Shandong province has the highest average annual growth rate of 0.98%, Inner Mongolia has faster growth with an average annual growth rate of 0.64%, and the average annual growth rate of Qinghai province has the largest decline with 2.34%. From the point of view of spatial distribution, the performance of water management in the Yellow River Basin provinces did not show more obvious differences between east and west and north and south.
Table 2.
The water management performance score in the Yellow River Basin.
Analysis of the Dimensions of the Performance of Water Management in the Yellow River Basin
Utilization of Water Resources
The comprehensive performance score of the utilization of water resources in the Yellow River Basin is characterized by the mean value of the provincial scores for each year. According to the utilization of water resources performance evaluation in the Yellow River Basin, the average value of the integrated utilization of water resources performance in the Yellow River Basin is 0.438. The overall integrated performance score for the utilization of water resources in the Yellow River Basin in 2006 is 0.358, and the overall integrated performance score for the utilization of water resources in the Yellow River Basin in 2022 is 0.515, which shows a stable and upward trend overall. The utilization of water resources performance score in each province is shown in Table 3, from large to small, in order of Shandong, Inner Mongolia, Henan, Sichuan, Shanxi, Shaanxi, Gansu, Qinghai, and Ningxia, spatially presenting the pattern of strong east and weak west. Shandong province, in the past years, has had a comprehensive performance score in terms of the utilization of water resources, ranking first among the nine provinces. Shandong’s economy is developed, the industrial water use structure is reasonable, and water conservation technology is more advanced. The lower utilization of water resources performance score is in Qinghai and Ningxia. Due to its own geographical constraints and more extensive water resources utilization, Ningxia has a larger water resources load, which, to a certain extent, affects the regional utilization of water resources. Qinghai, due to the weak water conservation technology, is affecting the utilization of water resources in the region. When comparing the average annual growth rate of water resources utilization performance in each province, it can be seen that utilization of water resources shows a fluctuating upward trend. Compared to the Yellow River Basin in 2006, the difference between the highest and lowest combined water resources utilization scores in 2022 can be seen, and the Yellow River Basin provinces’ utilization of water resources performance gap is expanding.
Table 3.
The utilization of water resources performance score in the Yellow River Basin.
Water Environment Management
According to the evaluation of water environmental management in the Yellow River Basin, the comprehensive performance average value of water environmental management in the Yellow River Basin is 0.678. In terms of time series, the performance of water environmental management in the Yellow River Basin shows a rising (2006-2009), slightly decreasing (2010-2012), and steadily increasing (2013-2022) trend. The performance of water environmental management in each province is shown in Table 4, from large to small, Qinghai, Gansu, Ningxia, Shaanxi, Inner Mongolia, Shanxi, Sichuan, Henan, and Shandong, showing a pattern of “strong in the west and weak in the east” in space. Qinghai and Gansu water environment management performance is higher; the performance of water environment management’s comprehensive average value is greater than 0.8. Qinghai water environment management performance ranks first in the Yellow River Basin’s nine provinces. The reason is mainly because Qinghai pays attention to water quality control; waste sewage discharge is less, and the sewage treatment level is higher. Henan and Shandong are the provinces with the lowest performance in water environment management.
On the one hand, Henan and Shandong have more developed industries, resulting in higher wastewater emissions; on the other hand, the two provinces have a greater population density, resulting in a greater load on the water environment. In recent years, Henan and Shandong have actively implemented the ecological compensation mechanism for the water environment, and the performance of water environment management has improved. A comparison of the average annual growth rate of the level of water environment governance in each province can be seen; the overall improvement of which Shandong, Qinghai, and Shanxi water environment governance levels of progress are obvious, and the other provinces of the Yellow River Basin water environment governance performance shows slight improvement.
Table 4.
The water environment management performance score in the Yellow River Basin.
Rehabilitation of Water Ecosystems
The comprehensive score of rehabilitation of water ecosystems performance in the Yellow River Basin is characterized by the mean value of provincial scores for each year. The evaluation of the performance of rehabilitation of water ecosystems in the Yellow River Basin shows that the basin rehabilitation of water ecosystems performance score was 0.410 in 2006, 0.282 in 2014, and 0.340 in 2022, which shows an overall trend of decreasing and then steadily increasing. In terms of time sequence, the rehabilitation of water ecosystems performance in the Yellow River Basin shows a slow decline (2006-2014) and then a steady rise (2015-2022). The performance score of the rehabilitation of water ecosystems in each province is shown in Table 5. From the mean rankings, Inner Mongolia’s rehabilitation of water ecosystems performance scores in all years ranked at the forefront of the provinces, mainly because Inner Mongolia has always adhered to the ecological priority and green development path, with higher ecological water use, a larger area of soil and water erosion control, and the active promotion of afforestation. Shandong, Ningxia has the lowest water ecological restoration performance score, mainly because of its fragile water ecological environment and low forest coverage. From the average annual growth rate, in addition to Inner Mongolia, Shandong, Henan, and the rest of the six provinces, the level of water environment restoration has slightly decreased. Among them, Henan province has improved faster, thanks to its active promotion of water management in recent years.
Dynamic Evolution of the Performance of Water Management in the Yellow River Basin
In order to analyze the evolution of water management performance in the Yellow River Basin more deeply, this paper applies the kernel density estimation method, selects the comprehensive mean value of water management performance in the Yellow River Basin in 2006, 2011, 2016, and 2022, and portrays the overall trend of water management performance in the basin, as shown in Fig. 1. In general, the distribution curve keeps shifting to the right, which means that the overall level of water management performance in the Yellow River Basin is improving steadily. Specifically, in 2006, the distribution curve was of the single-peak type, with the peak shifted to the right. The peak is higher than the peaks in other years, indicating that the performance level of water management in the Yellow River Basin has declined. In 2011, the distribution curve showed a double-peak phenomenon, but there is a certain gap in the distance between the two peaks, and the peaks of the density curves in 2016 corresponded to the changes in the horizontal coordinates of the peaks, which are not significant. The width of the peaks has broadened, and the distribution curve has become more extended, indicating that the gap between the water management levels of the provinces and regions in the Yellow River Basin has become larger. In addition, the left tail of the curve corresponds to the horizontal axis coordinates further to the left compared with the 2011 curve, and the vertical axis coordinates are significantly lower, indicating that the management level of the provinces with lower water management performance in the Yellow River Basin has declined. In 2022, the distribution curve wave peaks are of a single-peak type, and the peak value shifts to the right significantly. The right tail of the curve is more to the right compared to the previous, and the vertical axis coordinates have increased, indicating that the number of regions with higher performance has all improved. At the same time, the right tail of the distribution curve in 2022 is more to the right, indicating that some regions with high values of water management performance already exist at this time. The distribution extensibility has not changed much compared to 2016, but the peak of the wave has shifted to the right and is more convex, indicating that the gap in the performance of water management in the basin shows an increasing and stabilizing trend. Still, the overall performance of the Yellow River Basin has increased significantly and is more concentrated.
Table 5.
The rehabilitation of water ecosystems performance score in the Yellow River Basin.
Analysis of Differences in the Performance of Water Management in the Yellow River Basin
In order to further explore the characteristics of the evolution of the differences in the water management performance in the Yellow River Basin, this paper divides the study area into upstream, midstream, and downstream. Using the Tyrell’s index to analyze the changes in the overall gap in the performance of water management in the Yellow River Basin, as well as the gap between and within the three regions of the upstream, midstream, and downstream, the results of the calculation of the Tyrell’s index of the performance of water management in the Yellow River Basin from 2006 to 2022 are shown in Table 6. From the results of the calculation of the Tyrell’s index, the overall Tyrell’s index of the Yellow River Basin shows a fluctuating increase (2006-2009), a slight decrease (2009-2010), a fluctuating increase (2010-2019), and a decrease (2019- 2022). Specifically, from 2006 to 2010, the differences among regions in the Yellow River Basin first increased and then decreased. From 2010 to 2019, the Tyrell’s index rose in volatility style, the intra-group differences and inter-group differences also showed a volatility upward trend, the intra-group differences were significantly larger than the inter-group differences, and the intra-group differences were the main source of the overall differences in this period. In 2019, the Tyrell’s index reached its highest peak, and in this period, the intra-group differences began to decrease continuously, and inter-group differences began to increase, becoming the main reason for the increase in the overall differences. From 2019 to 2022, the overall Tyrell’s index showed a decreasing trend, and both intra-group and inter-group differences decreased. In recent years, inter-group differences have been the main source of the overall differences and have become the key to reducing regional disparities.
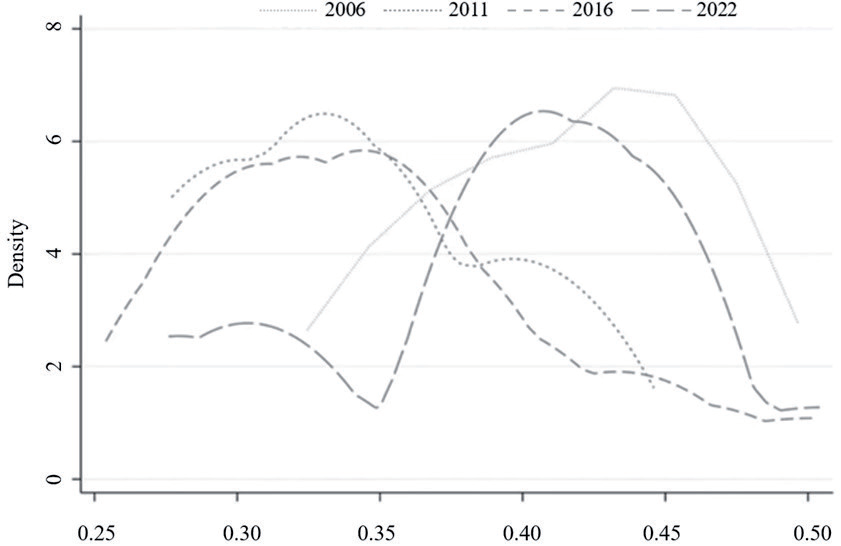
Table 6.
The Tyrell’s index of water management performance in the Yellow River Basin.
Forecast of Water Management Performance in the Yellow River Basin
The GM (1,1) gray model is suitable for predicting gray systems where some information is known and some information is unknown. It is also suitable for modeling small sample data. This paper predicts the performance of water management in the Yellow River Basin (2023-2030) based on the GM (1,1) gray model with the help of the evaluated performance from 2013- 2022. The GM (1,1) model prediction accuracy test and prediction results are shown in Table 7.
If the general a posteriori difference ratio C value is less than 0.5, then the model accuracy is qualified; the smaller the relative error value, the better, and less than 20% means the fit is good. The model prediction accuracy test results show that the general a posteriori difference ratio C value of the provinces is less than 0.5, and the relative error value is much lower than 20%, so the prediction model precision is high, and the fit is good. It can be seen from the results of the prediction model that the performance of water management in the provinces of the Yellow River Basin (2023-2030) is in a steadily increasing trend, so it can be reasonably presumed that the performance of water management in the Yellow River Basin will continue to increase steadily in the next few years.
Discussion
Policy Implications
The introduction of policies in the Yellow River Basin can improve the performance of water management. In the time dimension, the performance of water management in the Yellow River Basin is closely linked to introducing policies. From 2006- 2011, the performance of water management declined; the release of national and local policies in this period was less, resulting in the concept of water management being weaker, so the performance of water management showed a decreasing trend. In 2011-2022, the performance of water management showed a steady upward trend. In 2011, document No. 1 of the central government called for implementing the most stringent water management system. Since 2016, the 13th Five-Year Plan has put forward higher requirements for water management. In 2021, the State Council issued the “Outline of Ecological Protection and High-Quality Development Plan for the Yellow River Basin”, which further proposes improving the management system of the Yellow River Basin. The nine provinces along the Yellow River Basin put forward strategies suitable for their own development according to the ecological protection and high-quality development strategy of the Yellow River Basin issued by the state. The release of relevant central and local policy documents during this period promoted the performance of water management. The number of policy releases is, to some extent, positively correlated with the degree of government attention, and the Chinese government should strengthen the release of policies for the Yellow River Basin. In contrast, the provinces should strengthen the synergies between the main bodies and jointly release relevant water resources policies to improve water management performance.
Table 7.
GM (1,1) model predictions.
How to Improve Water Management Performance in the Future
Do a good job in the overall planning of the Yellow River Basin water management, build an integrated water management pattern, form central and departmental coordination, and implement various parts of the articulation of the management system. Each province should gradually strengthen the weak links and improve the performance of water resources in the basin according to the status of water resource sources in its own basin. The upper reaches of the Yellow River Basin provinces should actively introduce advanced water conservation technologies, with water-saving agriculture and water-saving forestry being particularly important, learn from advanced utilization of water resources experiences, comprehensively enhance water resources saving and intensive utilization capabilities, and improve the level of utilization of water resources. The middle and lower reaches of the Yellow River Basin provinces should optimize the industrial structure, strictly control the highly polluting enterprises, gradually reduce dependence on water resources, and improve water environment management and water ecology restoration. The carrying capacity of water resources, the water environment, and water ecology are limited, and it is necessary to improve the appropriateness of water resource conditions and the layout of the economic and social development of each province. At the same time, each province should establish and improve the ecological compensation mechanism for water resources so as to promote the protection of water resources and high-quality development of the Yellow River Basin through coordinated governance.
Limitations in the Choice of Time Period and Data
In addition to analyzing the reasons for the results, this paper discusses time period selection and data selection.
Firstly, the limitation of time selection. In analyzing the performance of water management in the Yellow River Basin, considering that the missing data before 2006 is relatively serious, the data from 2006-2022 is selected in time. In order to analyze the dynamic evolution of the performance of water management in the Yellow River Basin, the four years of 2006, 2011, 2016, and 2022 were selected to portray the overall trend of change. The reason for selecting these four years is that the interval is a five-year trend, which more intuitively reflects the overall trend of change and makes changes more obvious.
Secondly, data from 2013 to 2022 were selected to predict the performance level of water management in the Yellow River Basin from 2023 to 2030. These data are chosen because they are in a stable upward stage overall, and the accuracy of the prediction model is qualified, while the data from 2006 to 2022 are in a fluctuating state overall, which is unsuitable for the prediction model.
In conclusion, the choice of time period and the selection of data may introduce errors in the results and are limitations of this paper’s study.
Conclusions
(1) The performance of water management in the Yellow River Basin as a whole and in the provinces in the basin shows a decreasing and then a stable increasing trend, but the average value and the average annual growth rate show that there is a significant difference in the performance of water management in the provinces, which indicates that there is an uneven development of the regions in the basin. Among the evolution characteristics of the dimensions, the utilization of water resources performance shows a strong pattern in the east and weak in the west, while the water environment management performance shows a spatial pattern of strong in the west and weak in the east.
(2) The kernel density curve shows that the Yellow River Basin’s water management performance gap between the provinces shows an increasing and stabilizing trend, and the basin’s overall level is improving.
(3) From the viewpoint of Tyrell’s index, the overall Tyrell’s index of the Yellow River Basin shows a trend of fluctuating increase (2006-2009), slight decrease (2009-2010), fluctuating increase (2010-2019), and some decrease (2019-2022). Meanwhile, the difference between groups is the main source of the overall difference in recent years, which has become the key to reducing the regional disparity.
(4) Based on the data of the last 10 years, the results of the GM (1,1) model prediction for the Yellow River Basin for the period 2023-2030 can hypothesize that the performance of water management in the Yellow River Basin will continue to improve steadily in the coming years.

