

Introduction
In the past few years, the Chinese government has put forward an important strategy to promote the realization of high-quality development in the Yellow River Basin (YRB), to foster the synergistic development of the ecology, economy, and society of the Basin, and to ensure that the ecological environment of the Basin is effectively preserved and restored. Simultaneously, the excessive exploitation and utilization of natural resources are reduced through the promotion of green development, circular economy, and other models to provide a strong guarantee for the ecosystem services of the YRB. However, although high-quality development policies have played a positive role in the ecological protection of the YRB at the macro level, there is still a lack of comprehensive research on the trade-offs and synergies of ecosystem services in the YRB at a micro level, as well as an analysis of the driving forces behind these dynamics. An in-depth study on the long time series, multi-scale temporal and spatial change characteristics of ecosystem services, and driving force analysis in the YRB is of crucial significance for a deep understanding of the high-quality development policy in the YRB, as well as for the promotion of ecological protection in the YRB.
The term “ecosystem services” was first coined by Ehrlich et al. to refer to the range of tangible and intangible benefits that ecosystems provide to humans, including water conservation, soil conservation, climate regulation, etc., and which are essential for maintaining human well-being and regional ecological balance [1-4]. In the 1990s, Chinese scholars such as Xie Gaodi made localized modifications to the ecosystem service assessment method based on Costanza et al.’s study [5]. Through the establishment of the Equivalent Factor Method (EFM) ecosystem service valuation system, the method has become the mainstream method for scholars to evaluate the value of ecosystem services in the ensuing nearly 20 years. For example, Guo Hui et al. [6] analyzed the ecological carrying capacity of the ecological conservation and development zone in Mentougou District, Beijing, using the equilibrium factor and yield factor measurements of ecosystem service value. Linlin Zhang [7] and others proposed a regional correction factor to accurately assess the value of ecosystem services in the Sanjiang Plain of China based on the perspective of ecosystem service value and provide policy recommendations for ecological environment management, production efficiency, and ecological compensation. However, the method is mainly based on static estimation of statistical or survey data, which makes it difficult to finely quantify the spatial and temporal characteristics of regional ecosystem services and the microscopic patterns of changes [8, 9]. Another group of scholars integrated remote sensing data and ecological parameter data to quantify regional ecosystem services with the help of ecological models such as Invest. For example, Xiaolan Yao et al. [10] applied the InVEST model and scenario analysis to explore the spatial and temporal patterns and impact analysis of rainforest ecosystem services on Hainan Island in southern China, and Yuxin Hua et al. [11] used the combined GeoSOS– FLUS–InVEST model to simulate the trends and spatial distributions of five essential ecosystem services under the three scenarios of the Natural Development Scenario, Policy Optimization Scenario, and Sustainable Development Scenario and explored the trade-offs and impacts among them. The trends and spatial distribution of the five essential ecosystem services under the natural development scenario, policy optimization scenario, and sustainable development scenario were simulated using the GeoSOS–FLUS–InVEST combined model, and the trade-offs and synergistic relationships among them were explored. However, most current studies are only analyzed for single indicators and lack an assessment of multiple ecosystem services [12-16]. In addition, the literature review shows a lack of integrated multi-scale and multi-indicator analyses of the Yellow River at long time series scales.
On the other hand, scholars have conducted a great deal of research on analyzing ecosystem service drivers. The mainstream methods are traditional mathematical and statistical analyses, such as correlation analysis and regression analysis. For example, Xiong Kangning et al. [17] used correlation and principal component analysis to explore the direct or indirect influence of various drivers on forest ecosystem service provisioning capacity in karst desertification ecosystems. Fang Guangji et al. [18] used correlation and regression analyses to explore the spatial and temporal dynamics of ecosystem service values in the Beijing-Tianjin-Hebei region of China and their trade-offs between urban and rural landscapes and concluded that improving ecosystem service trade-offs in urban and rural landscapes can promote urban-rural integration and provide policy insights for landscape governance. It also concludes that the urbanization rate is significantly negatively correlated with ecosystem services in the main urban area of Chongqing. However, the regression method needs to satisfy classical regression assumptions. It is prone to endogeneity problems where independent and dependent variables are causal to each other and are relatively weak in considering multi-factor interactions [19]. With the rapid development of geostatistical modeling, methods such as geo-weighted regression and geo-probe have been widely used in regional ecosystem service driver analysis studies. For example, Dong Wei et al. [20] combined geodetector and geographically weighted regression to analyze the significant spatio-temporal heterogeneity of ecosystem services in the agro-pastoral zone and the analysis of the driving factors. Based on geodetector, Linghua Liu et al. [21] analyzed the driving factors for the changes in the value of ecosystem services in the Danjiangkou Reservoir Area from 2000 to 2018 and explored the land-use and land-cover changes [22-25]. This approach only supports the identification of spatial impacts on ecosystem services and cannot quantify the drivers of ecosystem services in the temporal dimension of the system. Therefore, this study used the random forest model and the absolute value standard deviation method of multiple linear regression to quantify the factors that influence the provision of ecosystem services in terms of space and time in the YRB [26-28].
To address the above deficiencies, this study quantified the ecosystem services of soil conservation, food supply, habitat quality, water conservation, climate regulation [29], and wind and sand control in the YRB from 2000 to 2020 based on ecological models such as Invest, quantified the multi-scale trade-offs/synergy analysis of ecosystem services using Spearman’s correlation coefficients as well as image-by-image metrics of the temporal and spatial regression models, and finally used the random forest model and absolute value multiple linear regression model to investigate the drivers influencing ecosystem services in the YRB across both spatial and temporal dimensions. Specifically, this study aims to answer the following questions: 1) How do ecosystem services’ long-time series spatial and temporal characteristics vary in the YRB watershed? 2) What are the trade-offs and synergistic characteristics of ecosystem services in the YRB at the grid and watershed scales? 3) What factors drive ecosystem services in the YRB in the spatial and temporal dimensions? This study has the following advantages over previous research: First, it employs a long time series and multi-scale spatiotemporal analysis to more comprehensively reveal the dynamic changes in the Yellow River Basin ecosystem services. Second, it conducts an integrated evaluation of multiple ecosystem service indicators, better understanding the synergies and trade-offs among different services. Third, it utilizes comprehensive models for quantification, enhancing the accuracy and reliability of the results. Fourth, it deeply explores the driving factors of ecosystem services, providing a basis for formulating more precise ecological protection policies.
Materials and Methods
Data Sources
Various types of data (Table 1) were utilized in this study. These included MODIS remote sensing satellite imagery, HWSD soil database, elevation data, temperature data, precipitation data, Normalized Difference Vegetation Index (NDVI) data, and Terraclimate reanalysis data (see Table 1). Prior to analysis, all spatial data were transformed to the WGS 1984 coordinate system, and monthly data were combined to create annual data. The MODIS reflectance dataset underwent de-clouding using the CFMASK model, annual data were spliced and median synthesized, and the data were processed using Google Earth Engine.
Methods
This study uses ecological models such as Invest to quantify the ecosystem services in the Yellow River Basin from 2000 to 2020. At the same time, the Spearman correlation coefficient and graph-by-graph regression model were applied to quantitatively evaluate the multi-scale trade-offs and synergies of ecosystem services. Additionally, Theil-Sen median trend analysis and coefficient of variation analysis were used to explore the spatiotemporal evolution characteristics of ecosystem service supply. Finally, the random forest model and absolute multiple linear regression model were employed to investigate the spatiotemporal driving forces of ecosystem services from both temporal and spatial dimensions.
Water Conservation
The main function of the water supply is to control water flow by delaying the rise in subsurface runoff, managing surface runoff, and regulating river runoff by capturing and holding rainwater through the forest canopy, underground plants, deadfall layer, and soil. This task not only fulfills the water requirements of ecosystem elements but also guarantees an ample downstream water supply, highlighting its importance in providing diverse ecological services. This investigation utilizes the Water Balance Equation (WBE) to calculate water content.
where QWC is water retention (mm yr–1); Pi is rainfall (mm yr–1); Ri is runoff (mm yr–1); and ETi is evapotranspiration (mm yr–1).
Soil Conservation
In the study of soil conservation, the main emphasis is on how forest and grassland ecosystems can reduce erosion from rainfall. This involves the slow absorption of rain energy by layers of forest cover and decaying plant matter, which improves soil erosion resistance and decreases overall soil loss. Soil conservation is essential for maintaining ecosystem services like soil creation, water storage, plant stability, and ecological security. The calculation principles for soil conservation discussed in our research can be summarized as follows:
Tab. 1.
Detailed description of data.
[i] Note: a, Resource and Environmental Science and Data Center (https://www.resdc.cn/). b, China Meteorological Science Data Sharing Service Network (http://data.cma.cn/). c, World Soil Database (https://iiasa.ac.at/models-and-data/harmonized-world-soil-database). d, Water Resources Department (http://swt.hunan.gov.cn/). e, National Center for Atmospheric Research (https://climatedataguide. ucar.edu/). f, National Aeronautics and Space Administration (https://www.nasa.gov/).
Actual soil erosion:
Potential soil erosion:
Soil conservation:
AAE measures the rate of soil erosion per unit area in (t hm-2 yr-1); APE indicates the potential for soil erosion per unit area, measured in (t hm-2 yr-1); ASE denotes the soil retention per unit area in (t hm-2 yr-1). The factor R for rainfall erosivity is a measure of the average annual rainfall erosivity index over multiple years; the soil erodibility factor K signifies the degree of soil erodibility; K is the measure of soil loss per unit area resulting from erosion caused by a standardized amount of rainfall under a standard plot; The slope length factor (L) and the slope factor (S) are both dimensionless variables that contribute to understanding terrain variability; L accounts for the influence of slope length on erosion, while S accounts for the influence of slope steepness. The factor for vegetation cover (C) and the factor for soil and water conservation measures (P) are also dimensionless and are used to delineate the impact of ground cover and conservation practices, respectively, on soil erosion rates.
Carbon Sequestration Services
Green plants play a crucial role in services related to carbon sequestration, as they absorb carbon dioxide (CO2) through photosynthesis. During this process, they transform carbon dioxide into carbohydrates like glucose, storing it as organic carbon within their structures or in the soil. This function is significant for maintaining climate regulation, as it helps balance CO2 levels in the atmosphere. Furthermore, it contributes to reducing the impact of the greenhouse effect and enhances the overall environmental quality. The study’s evaluation criterion was based on the extent of carbon sequestration utilized. This metric was used to assess the effectiveness of ecosystems in performing the essential function of carbon sequestration.
NEP signifies carbon capture within ecosystems measured in grams of carbon per square meter per year (g C m⁻² yr⁻¹), while NPP stands for the ecosystems’ net primary productivity, also quantified as (g C m⁻² yr⁻¹). Rs denotes carbon usage through soil respiration, measured similarly in (g C m⁻² yr⁻¹). On the other hand, T denotes the average annual air temperature, and P signifies the total yearly precipitation. BD is the bulk density, expressed as grams per cubic centimeter (g cm⁻³). H represents the soil depth of 20 cm, and δ indicates the percentage of soil particles smaller than 2 mm.
Habitat Quality
HQ refers to the ability of ecosystems to provide conditions suitable for the persistence of individuals and populations, which is one of the important supporting services. High-quality habitats can provide more resources for population survival to better support different levels of biodiversity. We modeled HQ using the InVEST model, which calculates habitat quality by combining the stress intensity of different land use/land cover (LULC) types and their sensitivity to threat factors. HQ was calculated using the following formula:
where Qxj is the HQ value of grid x; Hj is the habitat suitability of LULC type j; Dxj is the habitat degradation degree of grid x; z is a scaling parameter; and k is the half-saturation constant, which was set at 0.05. Except for LULC data, the threat factor table and sensitivity table are required for the InVEST model. The coefficients of threat factors, habitat suitability values, and habitat types sensitivity to threat factors were referenced from the study in similar areas.
Food Production
FP, one of the crucial provisioning services for mankind’s survival and development, refers to the food produced by terrestrial ecosystems. In alignment with previous studies, we quantified FP by combining NDVI data with agricultural statistics from statistical yearbooks. The food yield data were derived from the Chinese Statistical Yearbook.
where Yi is the total yield of food in grid cell i, A is the total yield of food, NDVIi is the NDVI value of the ith pixel, and NDVIsum is the total value of NDVI.
Climate Regulation
This study used the degree of local cooling by ecosystems to characterize the ecosystem’s climate regulation. First, we calculated the mean annual land surface temperature based on the Google Earth Engine platform, then set the cooling intensity of water and bareland to 0. Next, we calculated the mean surface temperature of each ecosystem type for each year and then subtracted the mean surface temperature of bareland from the mean land surface temperature of all ecosystem types (except water and bareland).
where CE is the climate regulation function, Ti is the land surface temperature of the ith pixel, and TBareland is the average land surface temperature of the bareland.
Ecosystem Service Trade-offs and Synergies
In this study, the examination concentrated on analyzing the balance and harmonious connections among ecosystem services (ESs) through statistical techniques at both country and pixel scales. Spearman correlation coefficients were employed at a significance level of 0.05 to quantify the correlation between ESs. A negative correlation coefficient indicated a trade-off relationship between the ES pair, while a positive correlation coefficient indicated a synergistic relationship.
where the correlation coefficient between variables m and n is denoted as Rmn. The ESs for year i are represented as mi and ni. The variable x is used to denote the year, and in this particular paper, x is equal to 5.
Random Forest Importance Analysis
The popular learning algorithm, the random forest model, is commonly used in ecosystem services research as it combines multiple decision trees. Random and putative sampling methods were utilized in this study to construct each decision tree. For the training set, 4/5 of the samples were used, and the remaining 1/5 were held for accuracy verification, referred to as Out-Of-Bag data (OOB). Calculating the OOB misclassification rate involves determining the ratio of misclassifications to the total number of samples, serving as a crucial measure to assess the significance of feature variables.
We employed the replacement method to calculate the OOB misclassification rate. Initially, we calculated the OOB misclassification rate under normal conditions. Then, we replaced the value of Xj and recalculated the OOB misclassification rate [30, 31]. The difference between the two rates represents the importance of the variable Xj in each tree, which can be calculated using the following formula.
where VIMjOOB is the importance of feature variable j, Errori is the misclassification rate before replacement, and Errorji is the misclassification rate after replacement.
Conclusion of Methods
This study was conducted based on multiple ecological process models and several geostatistical models. The innovation lies in the combination of ecological and statistical methods and knowledge to quantify the trade-offs/synergies of ecosystem services in the Yellow River Basin over the past two decades, as well as their driving factors.
Results and Discussion
Spatial and Temporal Changes Characteristics of Ecosystem Services
Spatial Dimension
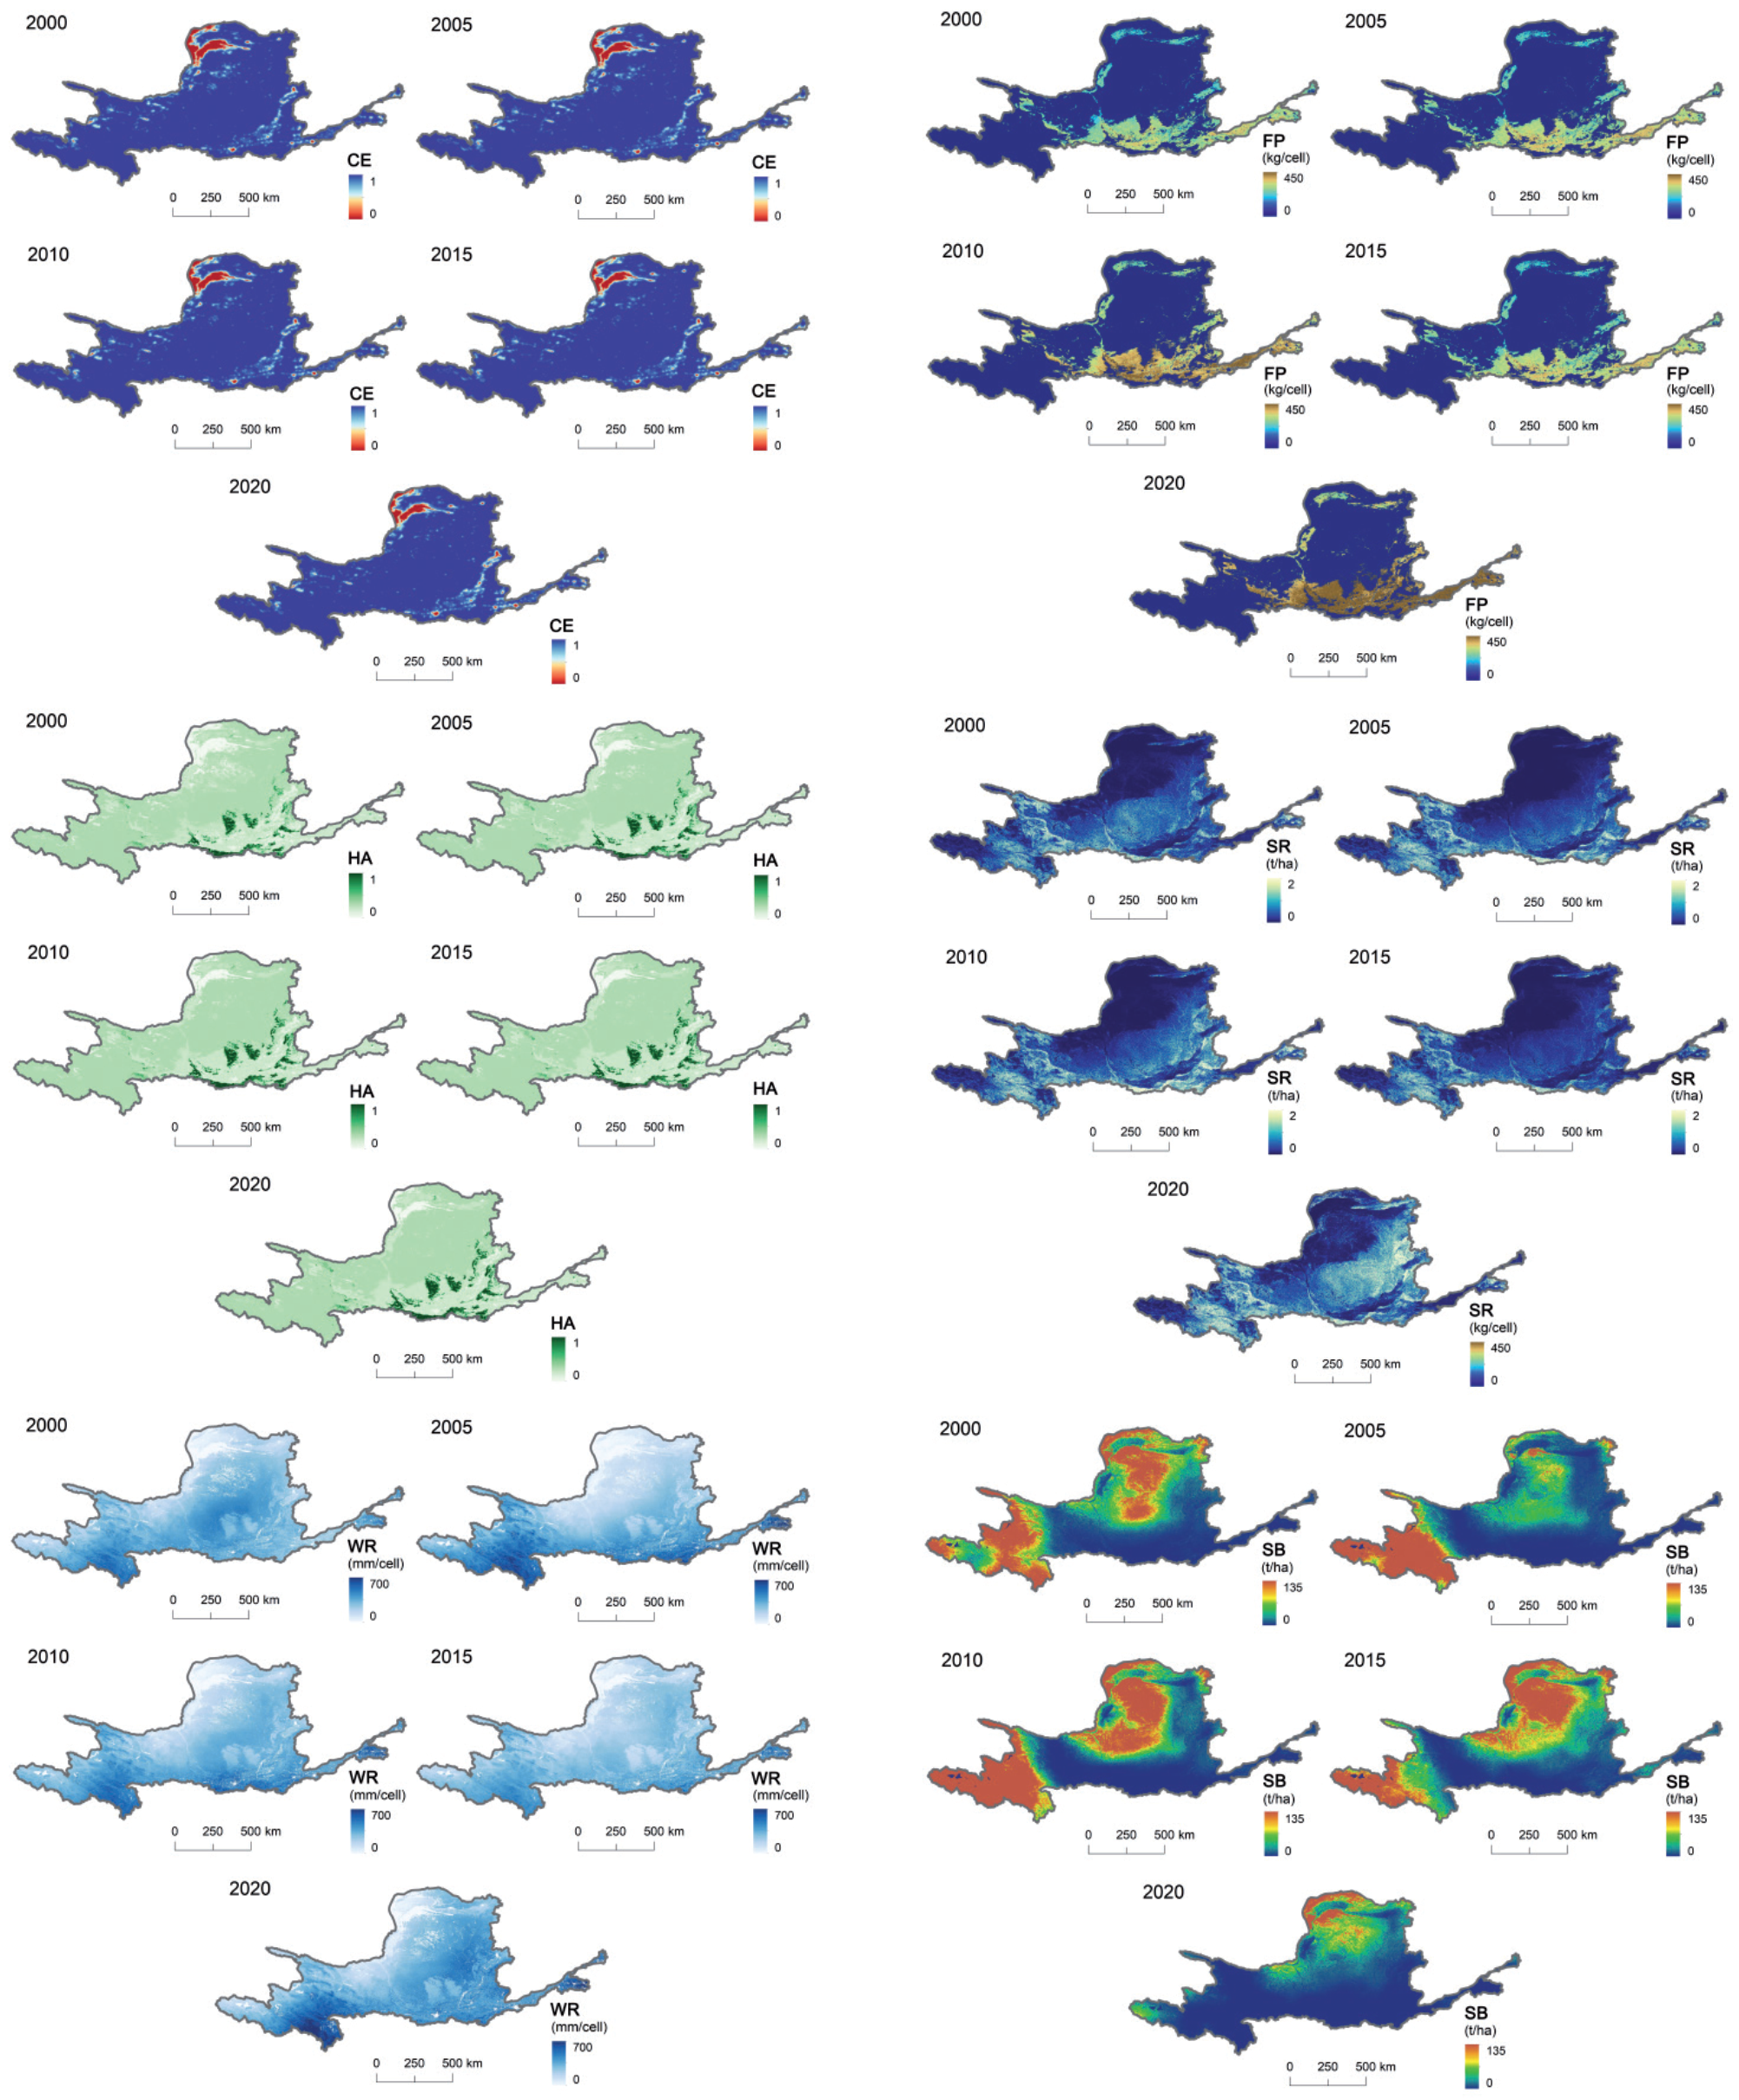
In this research, a comprehensive assessment of ecosystem services such as water retention (WR), habitat quality (HA), soil conservation (SR), food production (FP), wind and sand control (SL), and climate regulation (HM) was carried out in the YRB during 2000 and 2020 (Fig. 1). From the assessment results, these ecosystem services showed significant spatial heterogeneity within the YRB. In the past two decades, the ecosystem services in the YRB have been characterized by obvious spatial differentiation, with the range of high and medium-value zones gradually expanding and the range of low-value zones gradually shrinking in each ecosystem. Specifically, the FP high-value areas are point-like distributed in densely populated areas near the YRB, such as the Ningxia Plain and the Hetao Plain in the northwestern part of the basin and the Fenwei Plain in the downstream part of the basin. They tend to expand and gradually advance from the southeast to the northwest. Low-value areas are faceted in sandy and desert areas, hilly and gully areas, the northern part of the high loess gully area, and other areas where the population is more dispersed, with less arable land and low food production per unit area [32]. WR and SR services decreased gradually from south to north, with an obvious stratified stepwise distribution. Water production services and soil conservation in the southern Ningxia and Shandong basins were significantly improved, thanks to the gentle topography and favorable climate, and the WR and SR levels were higher. The Qilian Mountains and the Jin-Shaan-Yu basin (i.e., the middle reaches of the Yellow River) showed a significant decrease in WR and SR levels due to ecological degradation caused by frequent soil erosion [33]. HA and HM show a hierarchical stepwise distribution decreasing from the southeast to the northwest, with high values mainly in the highland meadows and mountainous woodlands in the southwest of the basin, while low values are mainly located in the desert areas in the central part of the basin and in parts of the northwest [34]. SB is the characteristic ecosystem service level of the YRB, which refers to the inhibition and fixation of wind and sand by vegetation ecosystems [35]. The high-value areas of windbreaks and sand fixation per unit area are distributed in the western and northwestern regions of the Basin, including Gansu, southern Ningxia, southern Yulin in Shaanxi, Guanzhong Plain, southwestern Shanxi, and part of Henan, and low-value areas are located in the southern part of the Basin and the lower reaches of the Yellow River, including Inner Mongolia, north-central Shanxi, and Jinan Dongying in Shandong.
Time Dimension
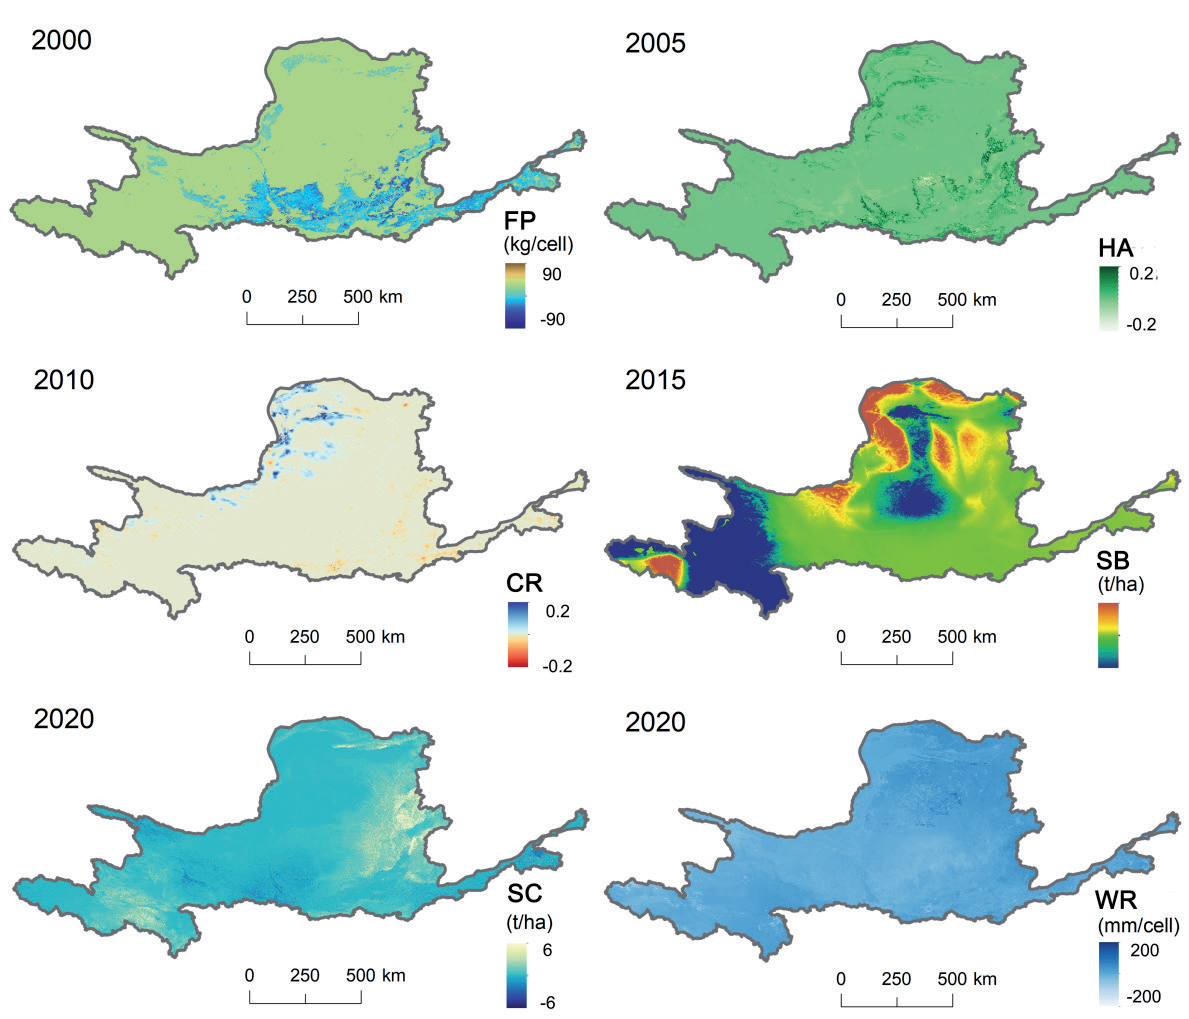
From the time scale, the supply of food production, soil conservation, habitat quality, climate regulation, wind and sand control, and water conservation in the ecological functional areas of the YRB from 2000 to 2020 changed significantly over time, and the ecosystem services showed a general trend of growth (Fig. 2).
Specifically, grain output in the YRB showed a fluctuating trend of increasing-increasing-decreasing-increasing, with a total increase of 38.505 kg/cell and an average increase of 70.333%. Among them, the grain output was the highest in 2020 and the lowest in 2000. In terms of the spatial distribution of changes, the areas with the largest increases were located in the southeastern part of the watershed, such as Slip County in the northeastern part of Henan province, Yanjin County in the northern part of Henan province, and Qihe County in the western part of Shandong province, etc.; the changes in the habitat quality index were small, showing a fluctuating trend of increase-increase-decrease-increase, with an enhancement of 0.021, with an average increase of 7.609%. Spatially, the regions with the largest increase in the habitat quality index were mainly distributed in Yulin City in northern Shaanxi Province, Tianshui City in southern Gansu Province, and Maowusu Sandy Area in Inner Mongolia. When it comes to the distribution of space, the trend of grain production and habitat quality showed a similar distribution pattern, with the increase in areas mainly distributed in the eastern and southern parts of the basin; climate regulation showed a fluctuating trend of increase-increase-increase-decrease, with an average increase of 0.422%, and spatially, the areas with the largest increase were located in the northwestern Ningxia Plain, the Hetao Plain, and the area near the Mao Wusu Sandy Land; the amount of wind- and sand-fixing services was the highest in 2010, with the highest increase in the amount of wind and sand-fixing services. The amount of windbreak and sand fixation services was the highest in 2010. When it comes to the spatial distribution of changes, the regions with the largest increases were located in the Hetao Plain, Loess Plateau, and areas near the Mao Wusu Sandy Land, as well as in areas such as Maqin County in southern Qinghai; the soil conservation showed a fluctuating trend of decreasing-increasing-decreasing-increasing, with an average increase of 74.138%, and spatially, the areas with the largest increases were located in Maqin County, northern Shanxi Province, Xinzhou City, northern Taiyuan City, and other areas in the north. The fluctuating trend of increase-increase-decrease-increase in water conservation, with an average increase of 17.677%, and spatially, the areas with the largest increase are located in Maqin County in southern Qinghai Province, Jinan City in central and western Shandong Province, and Zhengzhou City in north-central Henan Province, etc. The other areas’ changes are not significant, showing an alternating pattern of increase and decrease in distribution, with no centralized trend in distribution. There is no centralized distribution trend. In summary, ecosystem services in the YRB differ significantly in spatial distribution and show an overall increasing trend in time.
Trade-off Synergies for Ecosystem Services
Spatial Scale
According to the pixel scale, this study measured and analyzed the trade-offs and synergies among the six ESs in the YRB using the Spearman system (Fig. 3), and a total of 15 trade-offs and synergies were obtained. Overall, significant synergies between various types of ecosystem service functions dominated in the last 20 years. Of these, 9 synergistic relationships and 6 trade-offs in 2000 and 2010, 11 synergistic relationships and 4 trade-offs in 2005, and 8 synergistic relationships and 7 trade-offs in 2015 and 2020. 14 out of 15 relationships passed the significance test (p<0.05), and the difference was statistically significant. Of all the relationships, the strongest synergy was between water harvesting and climate regulation in 2000, 2010, 2015, and 2020. Water harvesting provides a stable water resource base for climate regulation, while climate regulation helps to maintain the long-term stability of water harvesting by reducing greenhouse gas levels. The strongest synergistic relationship in 2005 was water conservation-soil conservation, which helps the soil retain moisture and maintains the stability of the soil structure through the conservation and management of surface and groundwater resources. In turn, a stable soil structure further promotes water conservation, creating a virtuous cycle [36]. The strongest trade-off in 2000, 2015, and 2020 is windbreak-climate regulation, with a negative correlation to the climate regulation function due to the conversion of forested and grassed land used for windbreak into cropland, built-up land, etc., which affects the vegetation cover on the surface and disrupts the structure of the soil and the hydrological cycle [37]. The strongest trade-off in 2005 and 2010 was food supply-habitat quality, where the excessive application of pesticides or fertilizers in agricultural practices aimed at boosting crop yields frequently results in detrimental consequences such as the decline of biodiversity and contamination of water sources [38].
The ES pairs related to wind and sand conservation in 2000, 2010, 2015, and 2020 all showed trade-offs, indicating that the rise in wind and sand conservation functions over the past 20 years has decreased the functionality of other ecosystem services. For example, to enhance the wind and sand control services, managers may adopt specific land use and management strategies, such as changing the vegetation structure and adjusting the planting density, reducing the vegetation cover on the ground surface, and decreasing soil retention and water-holding capacity [39].
Time Scales
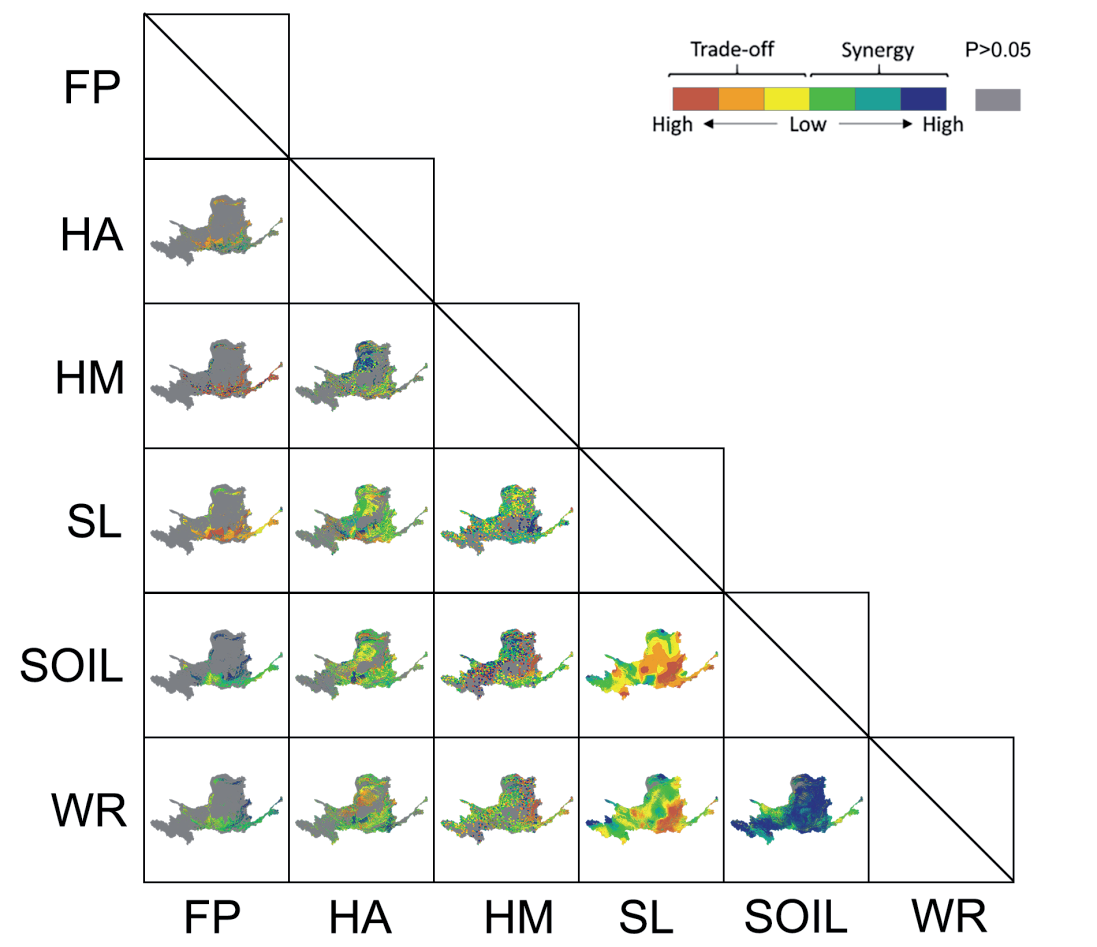
The map in Fig. 4 illustrates the trade-offs and synergies of ecosystem services in the YRB from 2000 to 2020 at the pixel scale, where most ESs are in weak synergistic relationships at the pixel scale (temporal dimension). SOIL synergizes with HA, HM, WR, FP, and SL. The study found that while land use/land cover change (LUCC) plays a significant role in determining the spatial distribution of ecosystem services (ES) in the YRB under a static dimension [40], the interactions between ES in a dynamic dimension are primarily influenced by physical processes such as energy exchange and material cycling among vegetation, hydrology, and meteorology [41]. This discrepancy results in weak synergistic relationships between most ES functions and LUCC (except FP), which contradicts the outcomes of trade-off/synergistic analyses of the static dimension (Fig. 3). This lack of consistency suggests that trade-offs and synergistic relationships between ES functions in the YRB differ depending on whether a static or dynamic dimension is considered. Using SL as a case study, in the static dimension, areas with high SL values are mainly located in landscapes such as sand dunes or deserts (Fig. 1), compared to the dynamic dimension, where SL is a more stable ES [42], showing a slightly increasing trend over the last 20 years (Fig. 2).
Driving Force Analysis of Ecosystem Services
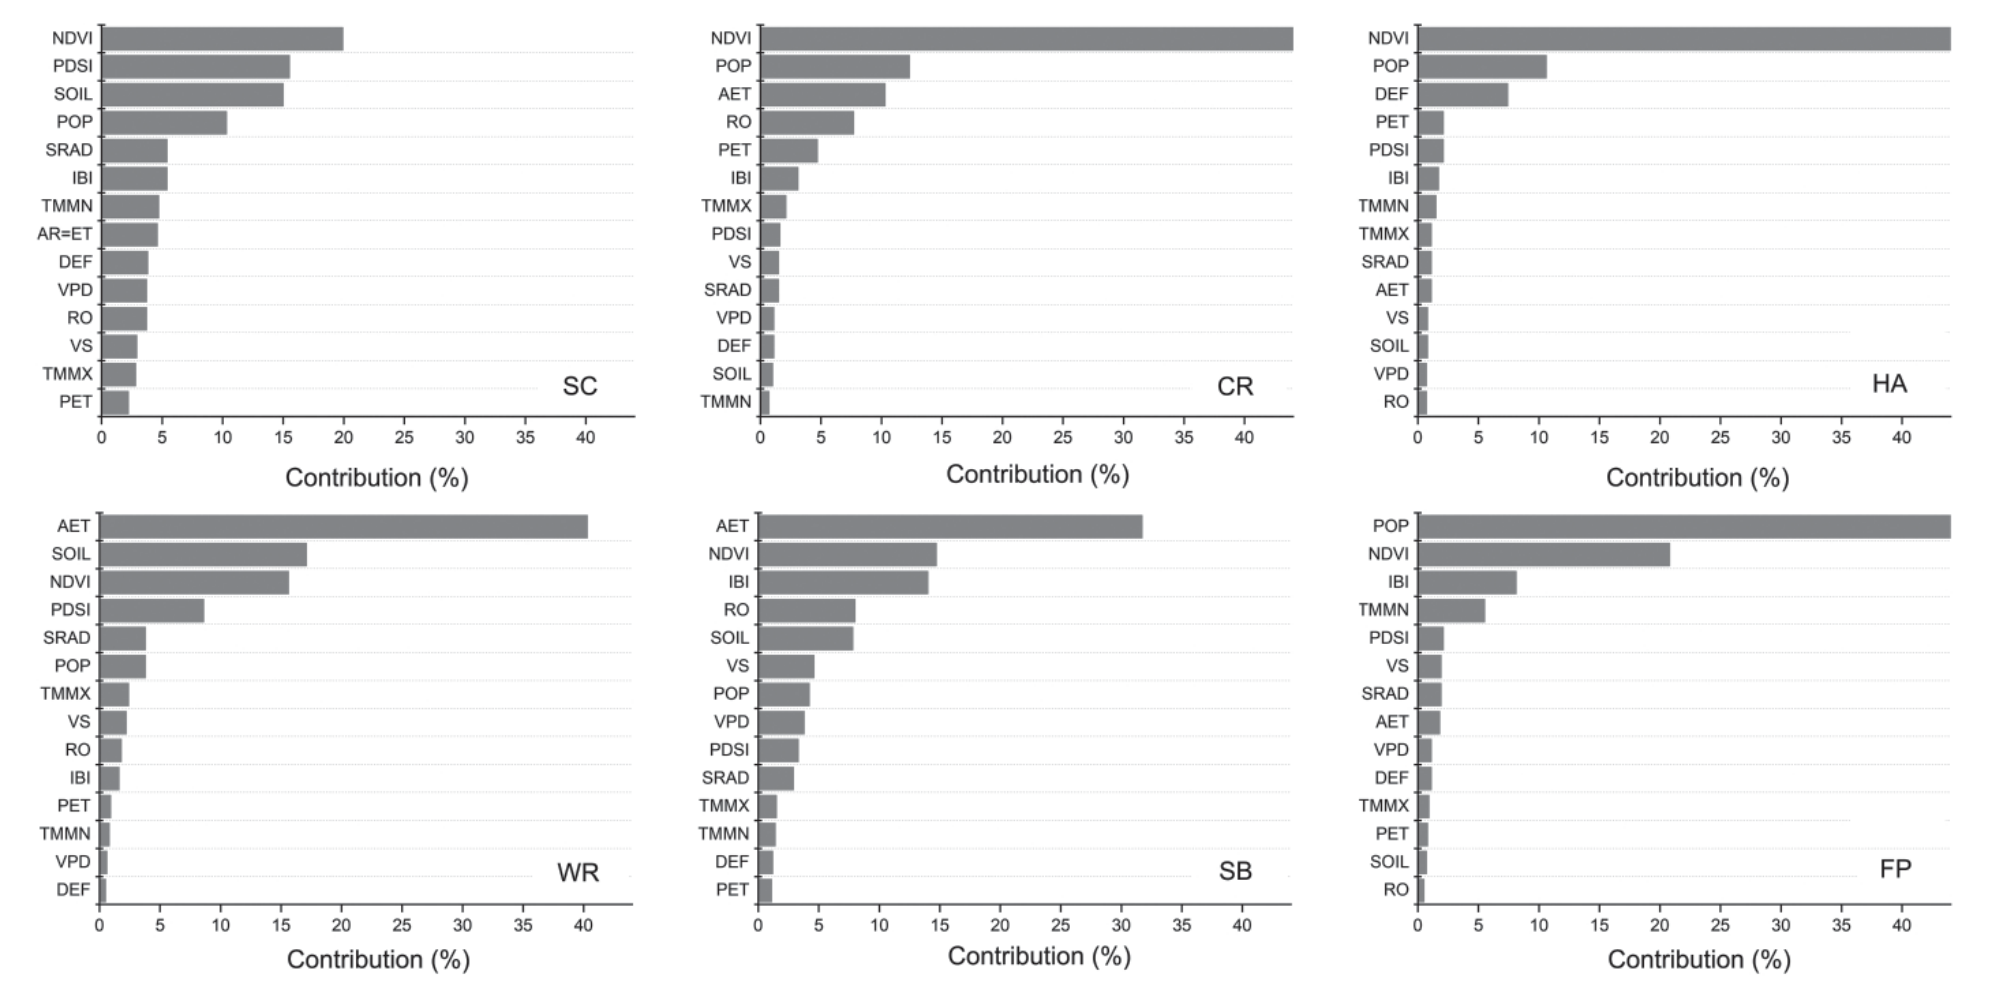
This research investigates the factors influencing ecosystem services in the YRB over time through multiple linear regression analyses, utilizing various remote sensing datasets and terrestrial climate reanalysis data. Fourteen different variable indicators were chosen for assessment, including actual evapotranspiration (AET), soil moisture (SOIL), vegetation cover (NDVI), drought index (PDSI), solar radiation (SRAD), population density (POP), maximum temperature (TMMX), wind speed (VS), surface runoff (RO), imperviousness (IBI), potential evapotranspiration (PET), minimum temperature (TMMN), saturated water vapor pressure difference (VPD), and climatic water deficit (DEF). Fig. 5 shows the ranking (in descending order) of the degree of temporal driving of WR, HA, SR, FP, SL, and HM. Natural factors and human activities significantly impact the temporal changes of all ESs, with POP dominating in HA, FP, and SR and NDVI and AET dominating in WR and SL. Secondly, PET and RO had less influence on ecosystem services in the YRB. The analyses showed that the correlation effects of human activities and natural factors (climate change) had a wide range of influences on the YRB.
Fig. 3.
Characteristics of ecosystem service trade-offs/synergies in the Yellow River Basin at the grid scale during 2000-2020.
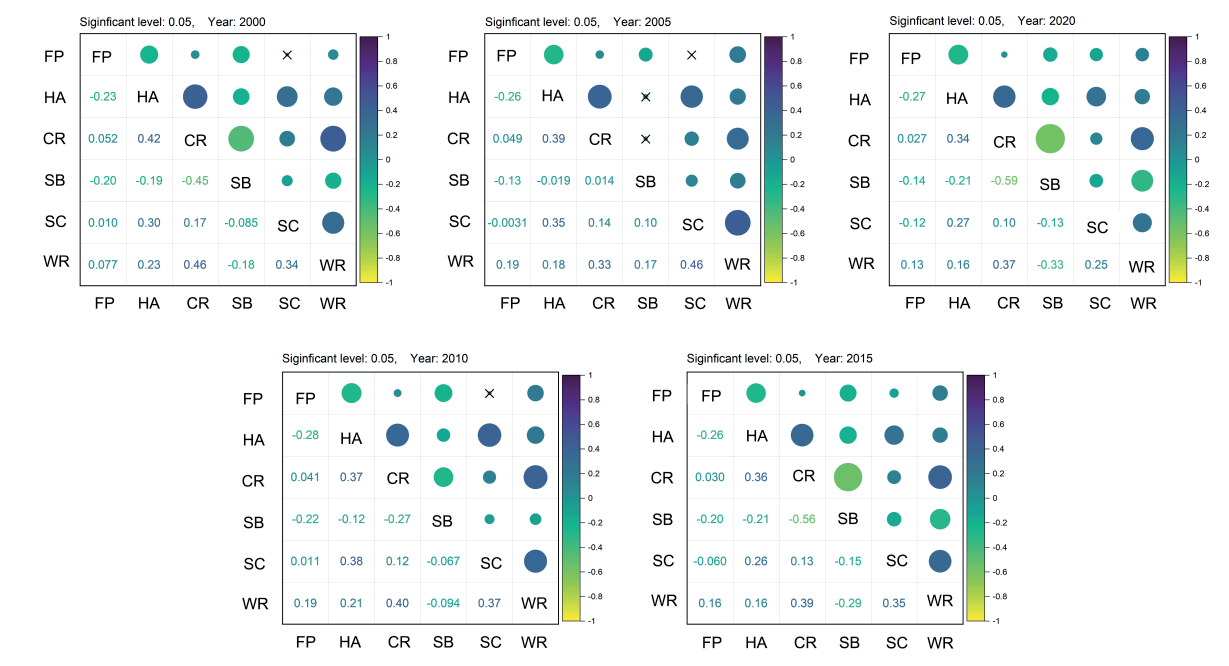
Fig. 4.
Characteristics of ecosystem service trade-offs/synergies in the Yellow River Basin at the time scale during 2000-2020.
According to the results of this research, the following recommendations are suggested: Clarify the development objectives of the YRB and the conflicts of interest that may arise. To balance these conflicts, policies should be formulated based on ecosystem services. Land allocation for construction should be strictly controlled along rivers and in key ecological areas to ensure that key ecosystem services are not compromised. Meanwhile, the YRB should strengthen the synergy between conservation and development. Ecological mitigation and protection policies should be strictly enforced in areas with high ecosystem service values, such as important wetlands, estuaries, and biodiversity hotspots. When it comes to the utilization of land in urban and rural areas, scientific and rational land planning should be formulated to maximize land use efficiency, curb the disorderly expansion of urban areas, and vigorously promote the development of new industries in harmony with ecological protection in order to reduce excessive consumption of natural resources. In addition, ecological land is being rationally allocated, key ecological corridors are being protected and restored, and a sustainable green design is being developed to promote a harmonious relationship between the natural environment and human actions.
Conclusions
Understanding the changes in the ecological environment of the YRB in light of the growing human activities and the impact of climate change on a global scale is essential to maintain the stability of the basin’s biodiversity and the balance of the ecosystem. Therefore, this study used multi-source data to estimate the major environmental evaluations (food supply, habitat quality, soil conservation, water conservation, wind and sand control, and climate regulation) from 2000 to 2020.
By analyzing the spatial and temporal changes of ecosystem services in the YRB over the past two decades and exploring the trade-offs and synergistic effects between ecosystem services at the pixel scale, the study concludes the following: The ecosystem services in the YRB showed significant spatial heterogeneity during the study period but generally showed relative stability in the temporal dimension, and the ecosystem services of the YRB as a whole showed a middle and high value in the past 20 years. In the past 20 years, the ecosystem services in the YRB as a whole showed a trend of gradual expansion of the middle and high-value zones and gradual reduction of the low-value zone. At the pixel scale (time dimension), most of the ecosystem services are in a weak synergistic relationship. Soil conservation (SOIL) showed synergistic relationships with other ecosystem services. Significantly, SL showed weak synergistic relationships with most ecosystem services (except FP) in the ever-changing realm of individual pixels. Finally, vegetation cover (NDVI) and human activities became the dominant factors driving the changes in ecosystem services in the YRB during the last 20 years.
In order to further promote the sustainable development of ecosystem services, it is recommended that the continuous monitoring of the spatiotemporal dynamics of ecosystem services, especially the in-depth analysis of the interaction between different ecosystem services at the pixel scale, be strengthened. Future research can focus on exploring how to achieve synergies in ecosystem services through scientific management and policy guidance, especially between soil conservation and other ecosystem services. In addition, vegetation cover and the impact of human activities will continue to be important research directions to improve ecosystem resilience and adaptability through developing adaptable management measures to meet changing environmental challenges.
In summary, this study aims to provide a scientific basis for the ecological protection and sustainable development of YRB, promote the in-depth implementation of ecological civilization construction, protect and restore the ecological environment, and provide more high-quality ecological products that meet human needs.

