

Introduction
As the importance of ecosystem services to socio-economic and ecological environments has become recognized, these services have become a focal point for global researchers [1-3]. Due to the heterogeneity of ecological components, structures, and processes across time and space scales, ecosystem services display prominent scale dependency characteristics [4, 5]. Grid scale is a crucial aspect of scale research and forms the basis for understanding the relationships across scales [6-8]. The quantitative analysis of the grid scale in relation to ecosystem services is not only essential for addressing scale issues but also for studying the transition of ecosystem services across different scales [9, 10].
Currently, scholars have conducted an in-depth analysis of ecosystem service evaluations and influencing factors at various spatial scales, including global, national, regional, and watershed levels. For example, Fan [11] analyzed tourists' preferences for ecosystem services experiences in 25 tropical rainforest reserves worldwide. Wu [12] assessed changes in ecosystem service values at the national scale using multi-period land-use data in China. Schmidt [13] spatially represented sediment control supply at the watershed scale. Furthermore, the study of trade-offs and synergies in ecosystem services across different spatial scales has received considerable attention. The trade-off relationships of ecosystem services across terrestrial scales have been widely evaluated [14-16]. Additionally, research has shown that there is almost no trade-off between biodiversity conservation and ecosystem services at the landscape scale [17]. However, ecosystem services exhibit scale dependency in both multi-scale and cross-scale dimensions [18-20]. The responses of ecosystem services to different scale types vary. For instance, Moreno-Llorca [21] found that the temporal evolution of ecosystem services differs across three scales: biosphere reserve, watershed, and cell level. Zeng [22] compared the spatial heterogeneity of trade-offs between ecosystem services at three different scales: grid scale, county scale, and watershed scale, and explored the driving mechanisms behind these tradeoffs. Nonetheless, quantitative analysis of ecosystem services' scale characteristics from the perspective of grid scale, particularly in mountainous areas, remains limited. It is unclear how ecosystem services in mountainous areas change with varying grid scales and how landscape grid scale changes affect the scale characteristics of ecosystem services. These questions are critical for the scientific management of ecosystem services in mountainous regions.
Southwestern China's mountainous areas are rich in diverse ecosystems, influenced by complex topography, climate, and human activities. These regions have high forest coverage, including evergreen broadleaf forests, coniferous forests, and mixed forests [23]. Grasslands, croplands, and other ecosystems also play important roles in this area [24, 25]. These ecosystems provide various important services essential for the ecological protection and sustainable development of the upper reaches of the Yangtze and Pearl Rivers [26, 27]. However, the spatial heterogeneity caused by the natural environment and human activities results in distinct scale characteristics of ecosystem services. Although previous studies have quantitatively evaluated ecosystem services in southwestern China and explored the effects of land use and climate change on these services [28-31], research on the scale characteristics of ecosystem services in these mountainous areas remains scarce. Therefore, using Wangcao Town in Suiyang County, Guizhou Province, as a case study, this research focuses on five key ecosystem services: water yield, soil retention, carbon storage, nutrient purification, and crop production. Based on four grid scales (30 m, 100 m, 300 m, and 600 m), and utilizing GIS technology and the InVEST (Integrated Valuation of Ecosystem Services and Trade-offs) model, this study investigates the response of ecosystem services to changes in grid scale.
The study proposes the following hypotheses: (1) Ecosystem services in mountainous areas are highly sensitive to grid scale changes, and the sensitivity varies across different services. (2) Changes in the grid scale affect the relationships (trade-offs and synergies) between ecosystem services, and the response of these relationships differs across services. (3) Grid scale changes have varying impacts on ecosystem services and their relationships in different terrains.
Materials and Methods
Study Area Overview
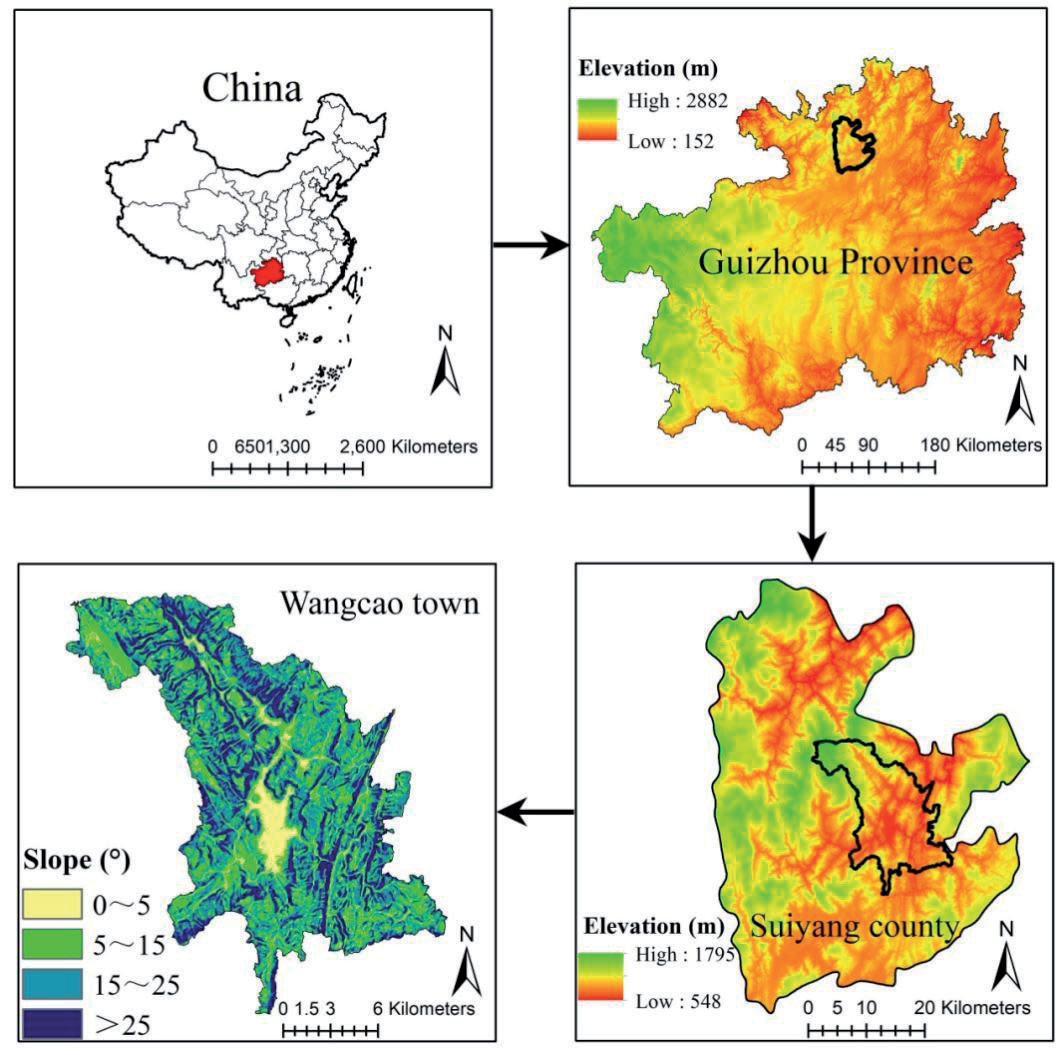
Wangcao Town is located in Suiyang County, Guizhou Province, China, between 107°14′-107°38′ E and 28°01′-28°43′ N, covering a total land area of 272.5 km² (Fig. 1). The area is characterized by a typical subtropical mountainous terrain, with altitudes ranging from 780 to 1,400 m. Major landforms include karst basins and middle mountain valleys. The town has a mean annual temperature of 19°C and an average annual precipitation of 1,100 mm. The central and southern parts of the town feature a large plain, making it one of the main rice and rapeseed-producing areas in Suiyang County. The western part of the town hosts an important subtropical nature reserve with high forest coverage, typical of the karst mountain landscape. Yellow soil, known for its fertility, is the dominant soil type. As of the end of 2020, Wangcao Town had a population of over 76,000, with more than 80% engaged in agriculture, which remains the dominant sector of the local economy.
Data Sources and Processing
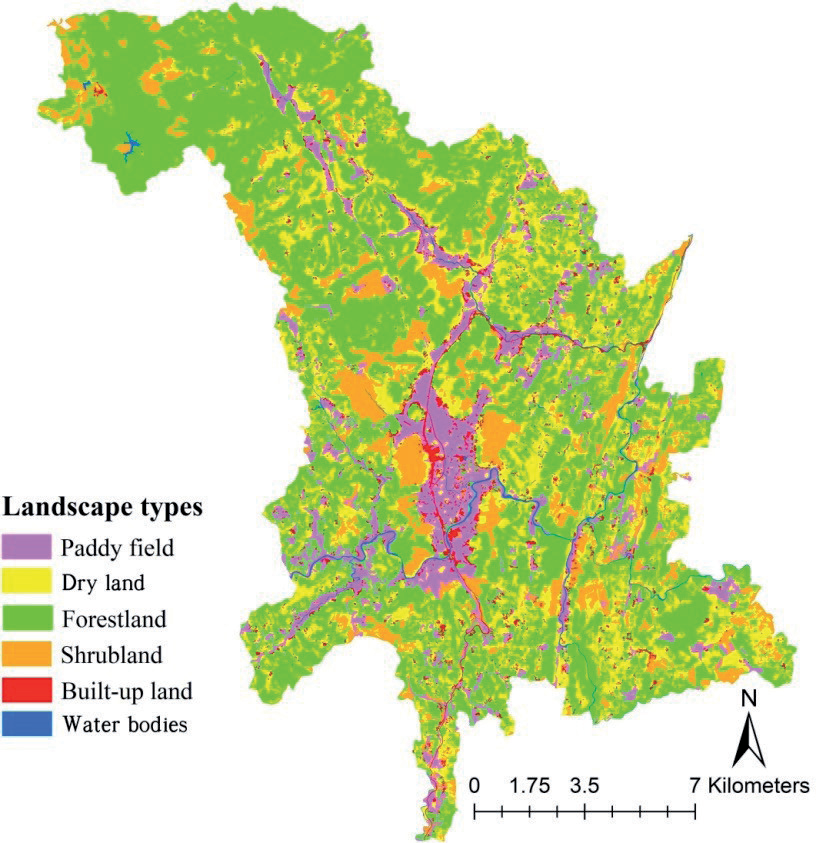
Land use data were obtained from 30-meter spatial resolution Landsat satellite images for 2020, using a human-computer interactive visual interpretation method. Field validation confirmed that the interpretation accuracy was high, with a Kappa index greater than 90%, meeting the research needs. Based on the characteristics of the study area, land use was classified into six types: paddy fields, dry land, forestland, shrubland, built-up land, and water bodies (Fig. 2). Soil data were sourced from the Guizhou Soil Database, which includes information on soil texture, thickness, and organic matter content. Meteorological data were provided by the Guizhou Provincial Climate Center, consisting of daily observational data from 1980 to 2020. Elevation data were obtained from the Geospatial Data Cloud platform (www.gscloud.cn) using ASTER GDEM data (30-meter resolution). Based on the elevation data, slope data were generated using ArcGIS's slope tool, and slopes were categorized into four gradients: 0-5º, 5-15º, 15-25º, and above 25º.
Grid Scale Division
Grid size division is crucial for data processing. The basic data for this study mainly consist of 30-meter resolution land use, terrain, and ecological environment data, determining the lower limit of grid scale. The microtopographic variations in the southwestern mountains of China significantly influence landscape patterns. Considering data accuracy and topographic differences, four grid scales (30 m, 100 m, 300 m, and 600 m) were selected through repeated trials. Resampling was performed using ArcGIS’s Resample tool to obtain base data for different grid scales.
Ecosystem Service Assessment Methods
Based on the ecological characteristics of the southwestern mountainous region of China, five key ecosystem services—water yield, soil retention, carbon storage, nutrient purification, and crop production— were selected. The services were assessed at different grid scales using the widely used InVEST model [32, 33]. The determination of the model parameters is primarily based on existing literature from similar study areas and the recommended values of the model, making it more aligned with the actual conditions of the study area and ensuring higher data reliability.
(1) Water yield
where Y is water yield, AET is actual evapotranspiration (calculated using the Budyko curve), and P is precipitation. Precipitation was interpolated using Kriging; soil depth was derived from the Guizhou Soil Database; potential evapotranspiration was calculated using the Penman-Monteith method [34]; land use was based on remote sensing interpretation data; vegetation root depth was determined using model-recommended values [35] and field surveys; soil water content was calculated based on soil texture data using the method from Zhou [36]; and plant evapotranspiration coefficients were taken from FAO's Irrigation and Drainage Handbook [34].
(2) Soil retention
where W is soil retention, R is rainfall erosivity, K is soil erodibility, L is slope length, S is slope, C is vegetation cover factor, and P is engineering factor. Rainfall erosivity was calculated using the method from Zhang [37]; soil erodibility was calculated based on soil texture and organic matter content using the Erosion/Productivity Impact Calculator [38]; slope length and slope were derived from DEM data using the 3D Analyst tool in ArcGIS; and vegetation cover and engineering factors were sourced from Han [39]. This study uses the southwestern region of China as a case, which closely aligns with the vegetation cover and management conditions of the study area, offering high reference value.
(3) Soil storage
where Ct is total carbon storage, Ca is aboveground carbon, Cb is belowground carbon, and Cs is soil carbon. Land use data were interpreted from Landsat remote sensing images, and carbon density values were referenced from Han [40].
(4) Nutrient purification
where WP is the nutrient purification value, POLx is the output coefficient, λw is the average runoff coefficient, and Yu is the water yield. Water yield was taken from the water yield module; the average runoff coefficient was automatically calculated using the DEM data in the model; and nutrient (nitrogen and phosphorus) output coefficients and removal efficiencies were referenced from Han [39].
(5) Crop production
where C is crop production, Li is the area of paddy fields and dry land, and Wi is the yield per unit area of paddy fields and dry land. Land use data were interpreted from remote sensing images, and yield data were sourced from the 2020 Guizhou Statistical Yearbook (http://stjj.guizhou.gov.cn/tjsj_35719/ sjcx_35720/gztjnj_40112/).
Calculation of Relationships Between Ecosystem Services (Trade-offs and Synergies)
Pearson correlation analysis was used to quantitatively analyze the relationships (trade-offs/ synergies) between the five ecosystem services. First, the evaluation results for the five services at each grid scale were normalized. Then, Pearson correlation analysis was conducted to calculate the correlation coefficients between pairs of ecosystem services at each grid scale. Correlation coefficients greater than 0 indicated synergies, while negative coefficients indicated trade-offs. This method was used to analyze how tradeoffs and synergies between services respond to changes in the grid scale.
Table 1.
Coefficient of variation for landscape areas under different grid scales.
Coefficient of Variation Calculation Method
The coefficient of variation (CV) was used to measure the sensitivity of landscapes and ecosystem services to changes in grid scale:
where CV is the coefficient of variation, SD is the standard deviation of landscape or ecosystem service changes, and MN is the mean value of landscape or ecosystem service changes.
Results
Changes in the Landscape Area under Different Grid Scales
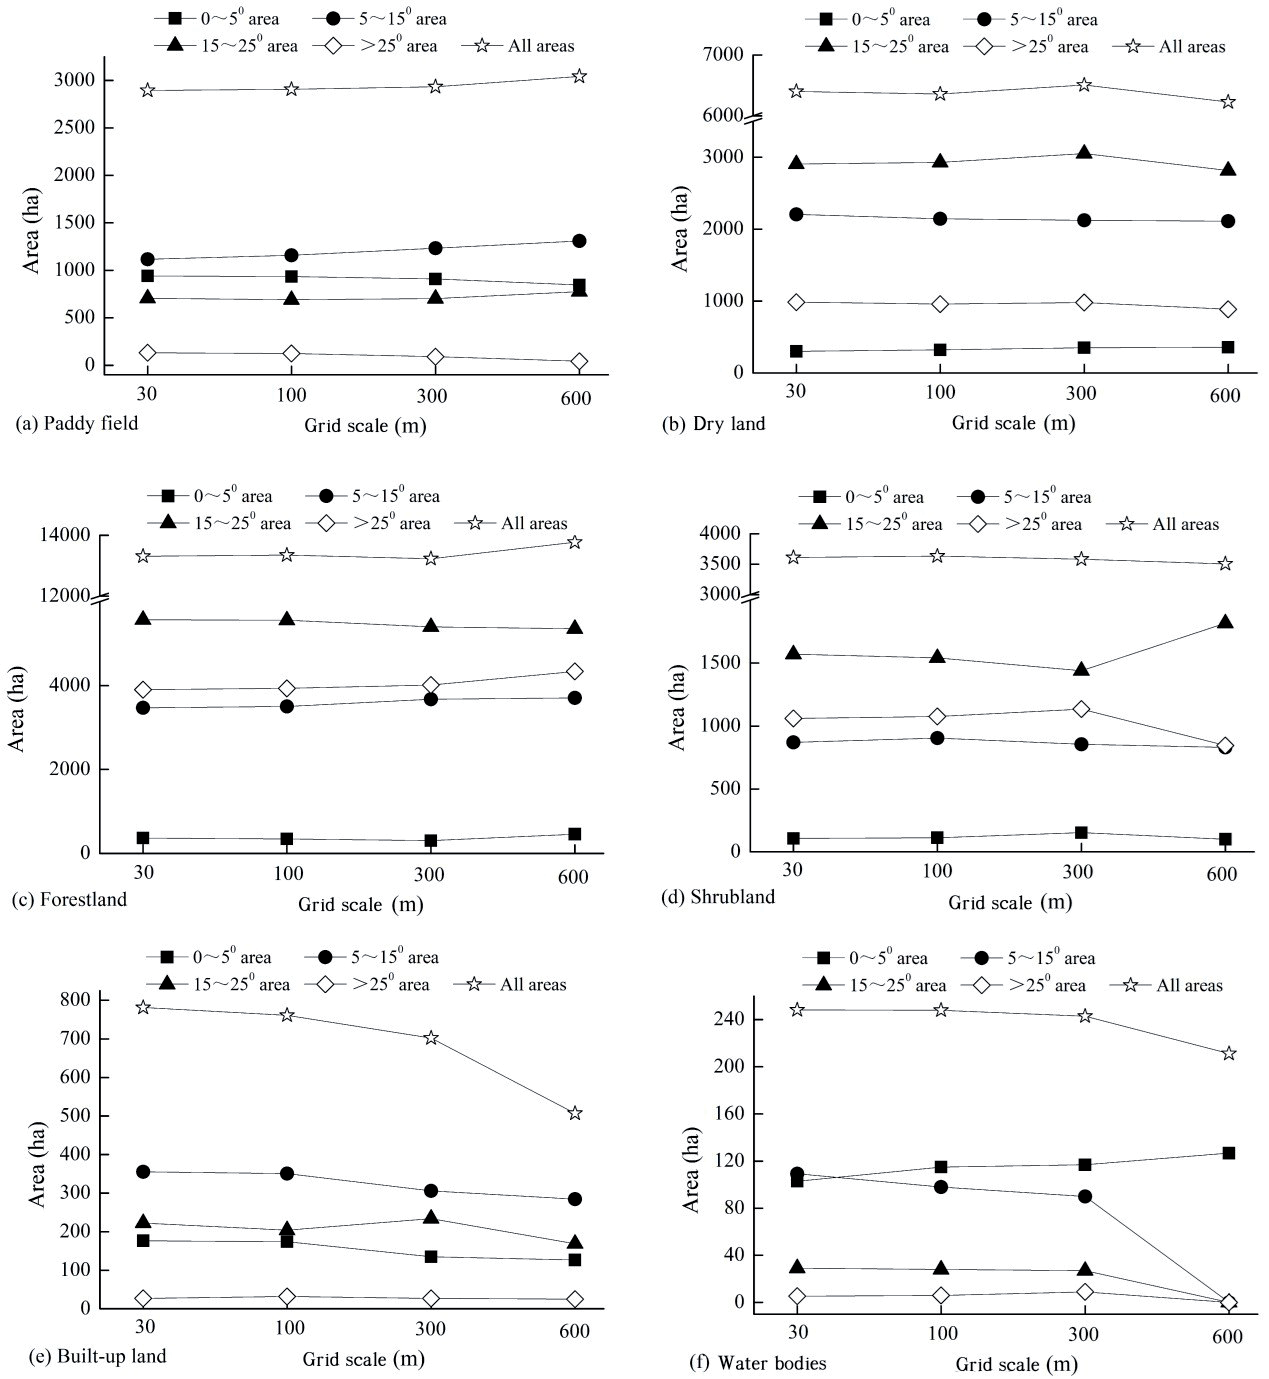
The area of various landscape types in the study region exhibited scale dependency across the entire region and different slope gradients. As the grid scale increased, the area of paddy fields and forestland showed an upward trend across the entire region, while the area of dry land, shrubland, built-up land, and water bodies displayed a decreasing trend, with the decline in built-up land being particularly pronounced. In the 0–5º slope gradient, apart from the decline in paddy fields and built-up land, the area of other landscape types increased to varying degrees. In the 5–15º slope gradient, the area of paddy fields and forestland increased, while the area of dry land, shrubland, built-up land, and water bodies decreased. In the 15–25º slope gradient, the area of paddy fields and shrubland increased, while dry land, forestland, built-up land, and water bodies decreased. In the >25º slope gradient, the area of paddy fields, dry land, shrubland, and water bodies declined, while forestland area increased, and the built-up land showed no significant change (Fig. 3).
The coefficient of variation (CV) of landscape area for different types of landscapes varied significantly across different regions under changing grid scales. Across the entire region, water bodies (CV=46.47%) and built-up land (CV=15.76%) demonstrated strong scale dependency, while other land types showed relatively low scale dependency (CV<2%). The CVs of paddy fields and water bodies in the >25º slope gradient were significantly higher than those in other slope gradients, whereas the CVs for dry land, forestland, shrubland, and built-up land were higher in the 0–5º slope gradient (Table 1).
Changes in Ecosystem Services under Different Grid Scales
As the grid scale increased, the changes in the five ecosystem services showed significant heterogeneity. Water yield, soil retention, nutrient purification, and crop production all exhibited a decreasing trend across the entire region, except for carbon storage, which showed an increasing trend. In all slope gradients except for the 15–25º gradient, water yield decreased. Soil retention in the 0–5º and 5–15º slope gradients was less sensitive to grid scale changes than in the 15–25º and >25º slope gradients. Carbon storage and nutrient purification consistently increased and decreased, respectively, across all slope gradients. Crop production showed a slight decline in the 0–5º and >25º slope gradients, with little change in the 5–15º and 15–25º gradients (Fig. 4).
The CV of nutrient purification across the entire region was relatively high and significantly greater than that of other ecosystem services. Water yield exhibited higher CVs in the 0–5º and >25º slope gradients, while the CVs in the 5–15º and 15–25º gradients were smaller. The CVs of soil retention, carbon storage, and nutrient purification in the 0–5º slope gradient were markedly higher than those in other slope gradients. Crop production in the >25º slope gradient had a noticeably higher CV compared to other gradients (Table 2).
Changes in Correlation Coefficients between Ecosystem Services under Different Grid Scales
As the grid scale increased, the correlation coefficients between water yield and soil retention, water yield and crop production, soil retention and nutrient purification, carbon storage and nutrient purification, and carbon storage and crop production all showed an increasing trend across the entire region and across slope gradients. However, the correlation between soil retention and carbon storage decreased across all areas and gradients. Except for the 15–25º slope gradient, the correlation between water yield and carbon storage showed a declining trend, as did the correlation between water yield and nutrient purification across all areas and slope gradients, except for the 0–5º gradient. Meanwhile, the correlations between soil retention and crop production and between nutrient purification and crop production showed an increasing trend (Fig. 5).
The CVs of the correlation coefficients between ecosystem services across the entire region ranged from 0.60% to 15.95%. Higher CVs were observed for the correlations between soil retention and carbon storage, soil retention and nutrient purification, soil retention and crop production, carbon storage and nutrient purification, and nutrient purification and crop production, while other ecosystem service correlations had smaller CVs. Across slope gradients, the CV of the correlation between water yield and carbon storage was the smallest, while the correlations between soil retention and nutrient purification, soil retention and crop production, carbon storage and nutrient purification, and nutrient purification and crop production had higher CVs. In the 0–5º slope gradient, the CVs of the correlations between soil retention and carbon storage and between carbon storage and crop production were significantly higher than in other slope gradients (Table 3).
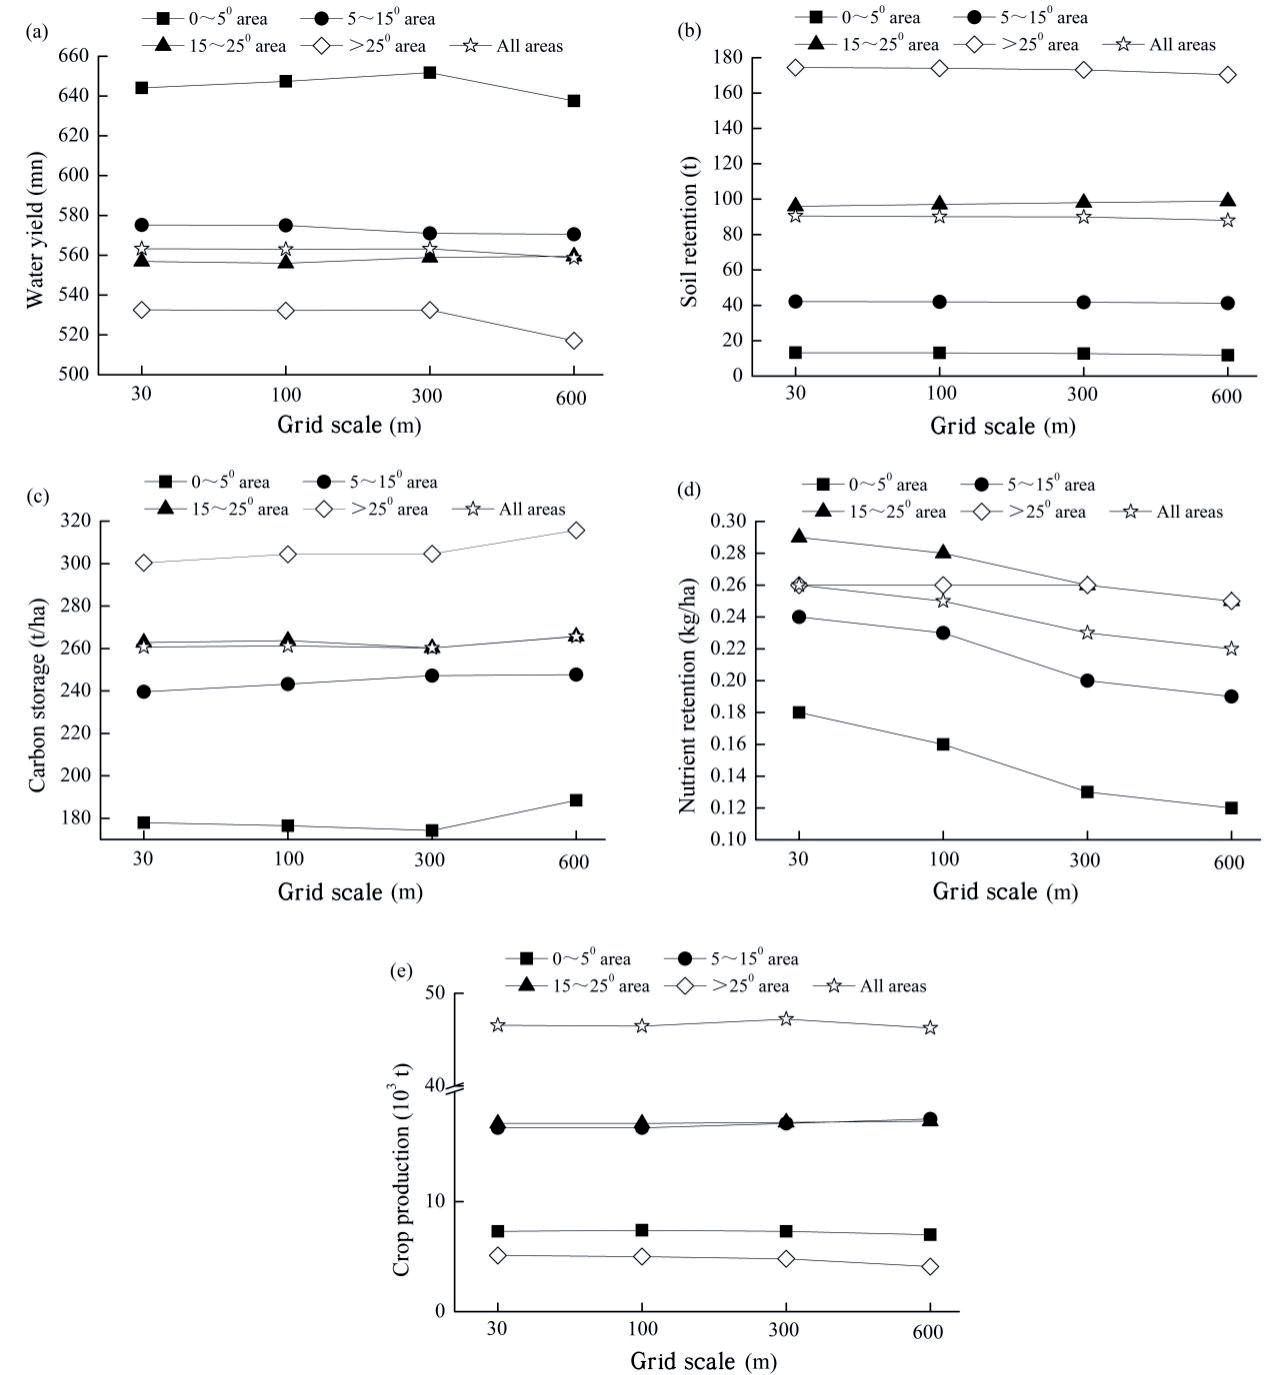
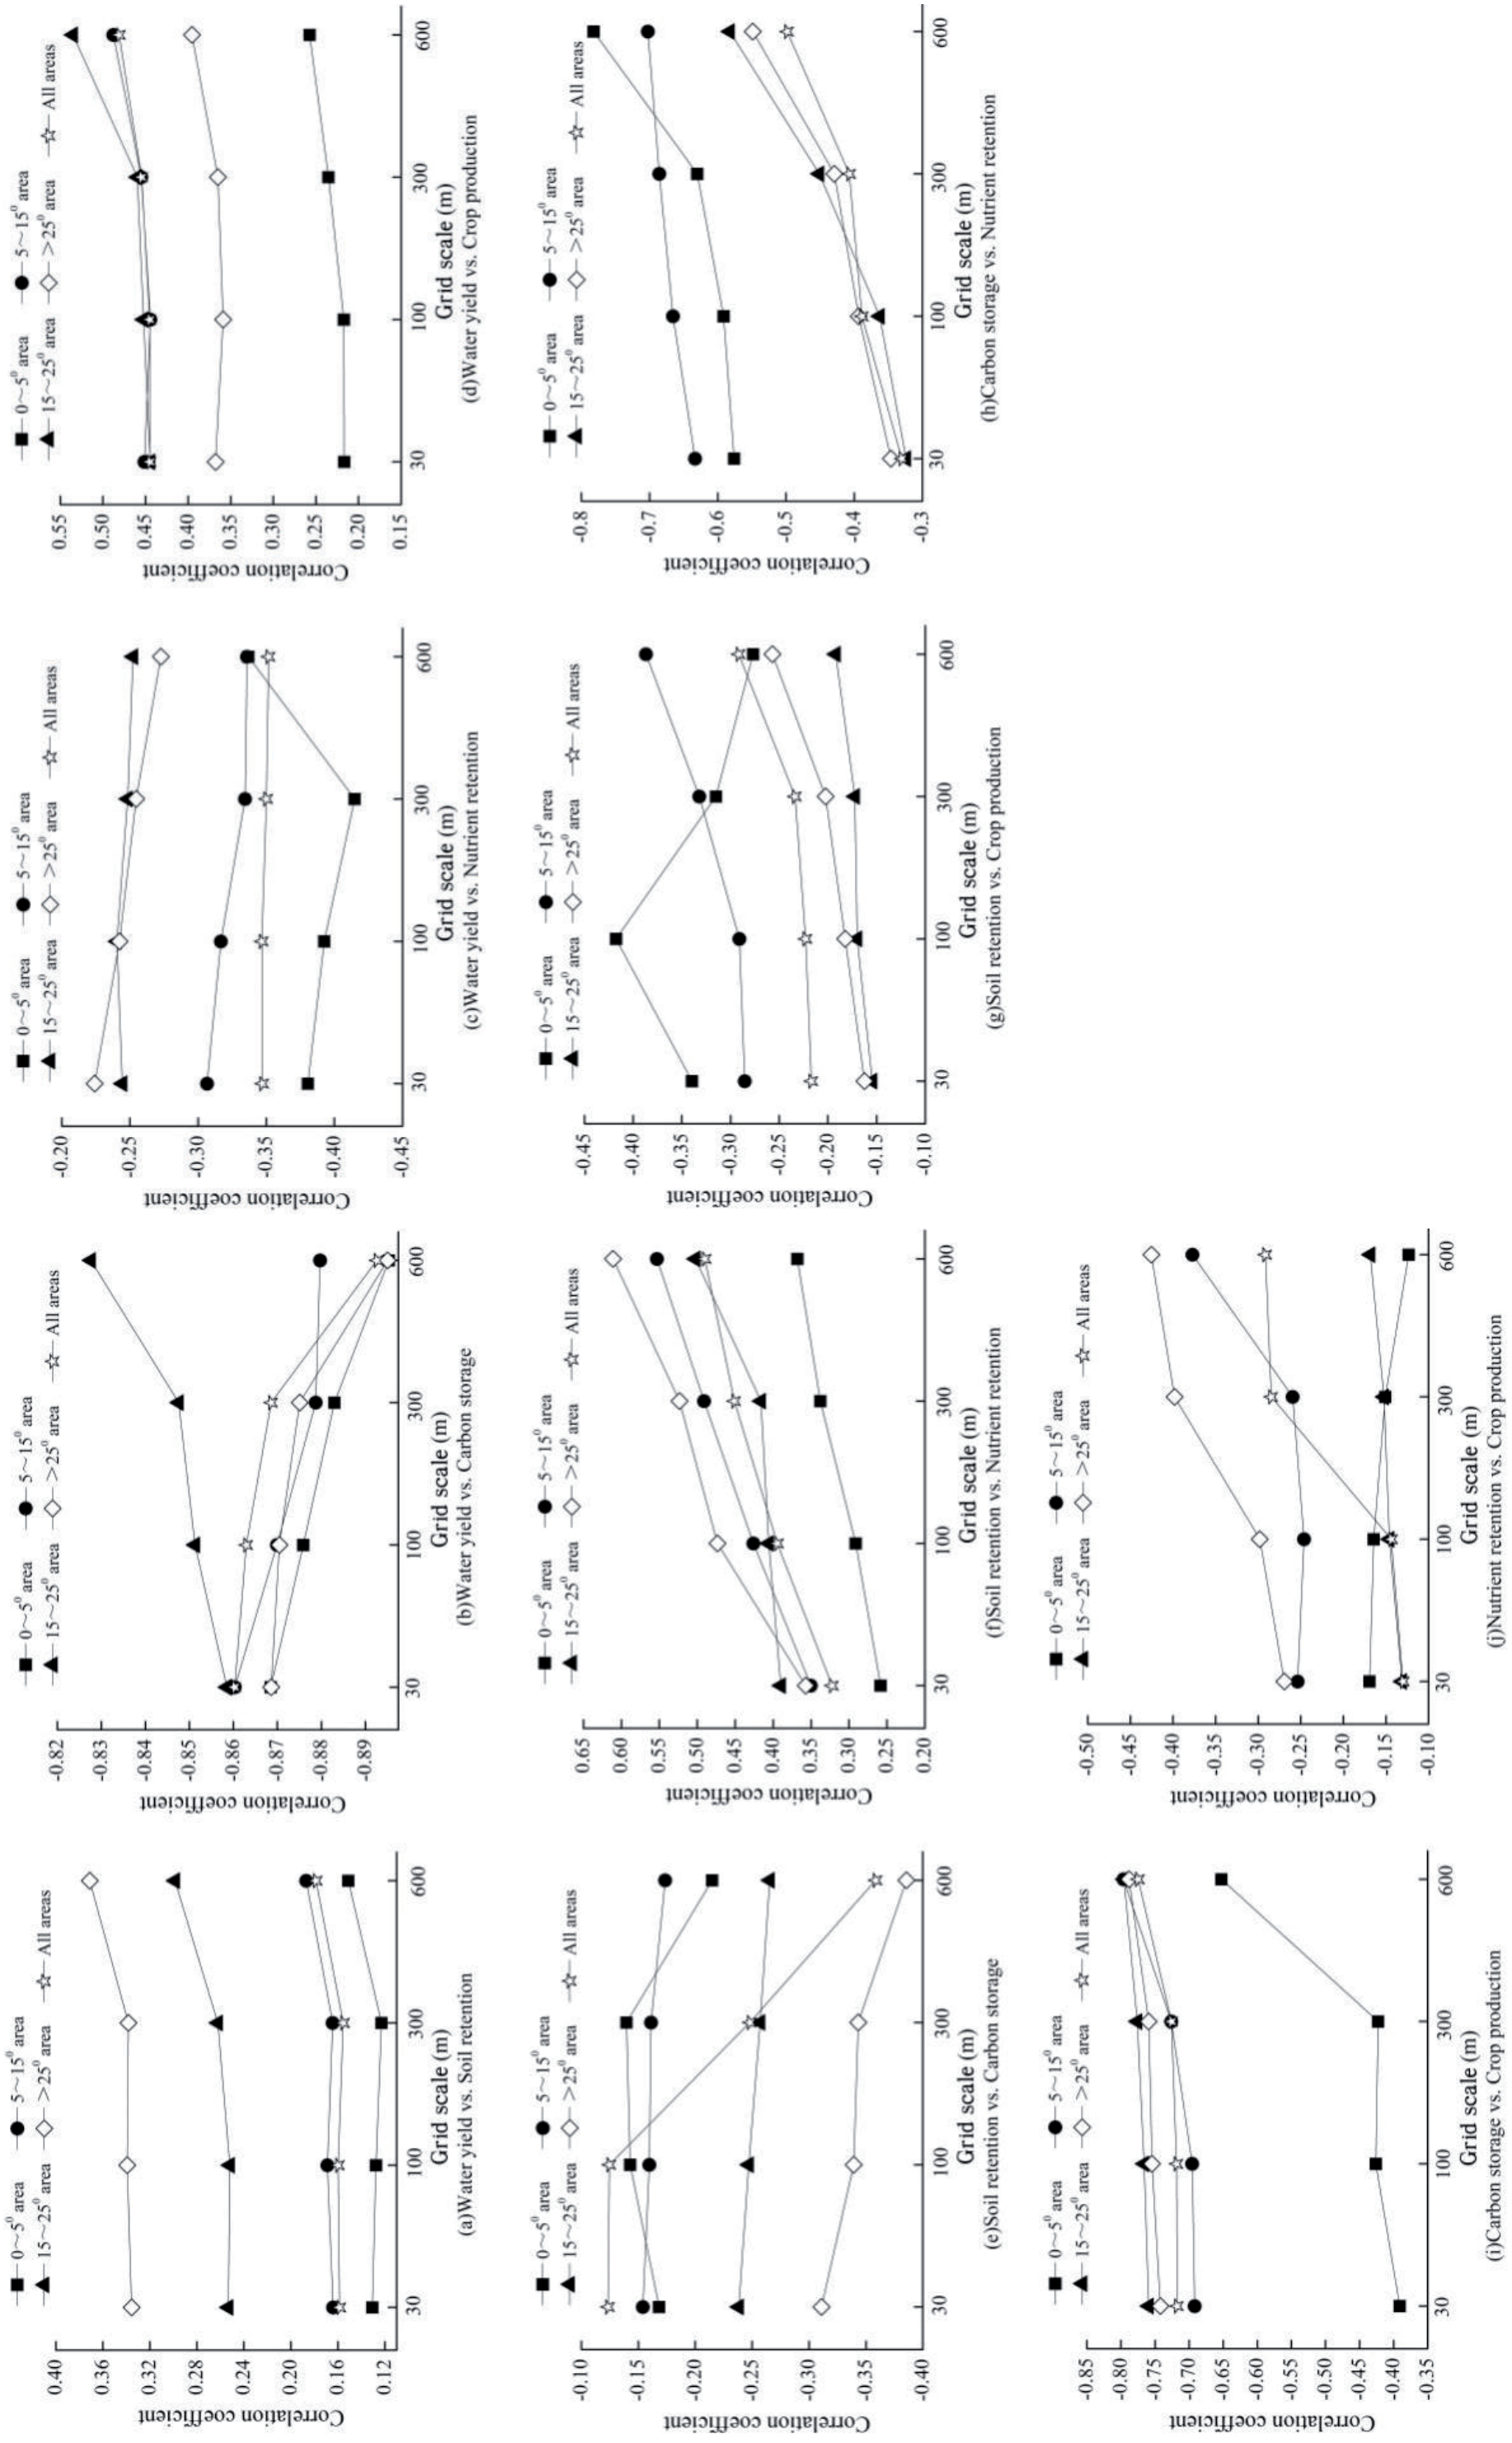
Table 2.
Coefficient of variation for ecosystem services under different grid scales.
Table 3.
Coefficient of variation for correlation coefficients between ecosystem services under different grid scales.
Discussion
Impact of Grid Scale Variation on Ecosystem Services
The scale effects on ecosystem services arise from natural factors such as climate and topography, as well as changes in landscape patterns influenced by human activities [41-43]. This study found that changes in the grid scale lead to variations in landscape-type areas, which in turn affect ecosystem services, creating a dependency of ecosystem services on the grid scale. Different landscape types have varying impacts on ecosystem services depending on grid scale characteristics. As the grid scale increases, the dominant forestland area in the study region grows while the dry land decreases. The increase in natural vegetation enhances the water retention capacity of soil and plants, leading to reduced surface runoff and a decrease in water yield. Similarly, increased forestland area and reduced dry land enhance carbon sequestration by vegetation, resulting in higher carbon storage. However, despite the decrease in dry land due to grid scale changes, the increase in paddy field area offsets this reduction, so changes in crop production function are not pronounced (Fig. 3 and 4).
The response of landscape types to grid scale changes varies across different slope gradients, resulting in different impacts on ecosystem services at various gradients. As the grid scale increases, significant changes in farmland, forestland, shrubland, and built-up land are observed in the 0-5º slope gradient, leading to pronounced changes in soil retention, carbon storage, and nutrient purification services compared to other gradients. Additionally, the variation in crop production in gradients greater than 25º is notably different from the other four ecosystem services, closely related to the substantial decrease in paddy fields in this gradient (Tables 1 and 2).
Impact of Grid Scale Variation on Relationships between Ecosystem Services
The scale characteristics of relationships between ecosystem services are closely linked to the heterogeneity of scale dependency among landscape types. As the grid scale increases, the increase in forestland area and decrease in dry land leads to a trend of increasing carbon storage and decreasing nutrient purification, resulting in a correlation coefficient approaching -1, indicating a stronger trade-off relationship (Fig. 3, 4, and 5). Similarly, the decreasing trends in water yield and crop production due to grid scale changes increase the correlation coefficient between these services, indicating a stronger synergistic relationship (Fig. 4 and 5).
There is heterogeneity in the scale characteristics of ecosystem service relationships across different slope gradients. As the grid scale increases, the change in soil retention and carbon storage in the 0-5º slope gradient is notably higher than in other gradients, enhancing their negative correlation (trade-off relationship) (Table 2 and Fig. 5). However, the relationship between water yield and carbon storage shows minimal variation across different slope gradients, likely due to the close relationship between these services and forestland and dry land, leading to similar impacts on water yield and carbon storage across gradients.
Comparison with Related Studies
This study finds that changes in ecosystem services and their relationships with increasing grid scale exhibit scale dependency, which aligns with findings from Di Sabatino [44] and Qiao [45]. This study further validates these conclusions, particularly highlighting the increased sensitivity and complexity of ecosystem services to grid scale changes in complex mountainous terrains. Additionally, this study observes differences in the sensitivity of various ecosystem services to grid scale, similar to Grafius [46]. However, the higher variability in nutrient purification compared to other ecosystem services in this study differs from Grafius [46].
Despite more pronounced changes in ecosystem services with increasing grid scale, the correlations (i.e., positive and negative relationships) between them do not fundamentally shift, suggesting that grid scale changes do not drastically alter landscape spatial patterns or the correlations between ecosystem services. This contrasts with Yu [47], primarily due to differing research perspectives (i.e., scale types). This study and Yu [47] analyzed ecosystem service correlations from grid scale and multi-scale perspectives, respectively. Additionally, this study reveals differences in the scale characteristics of ecosystem services across terrain gradients, consistent with the findings of Zhang [48].
The results of this study resonate with ongoing cross-scale research. For instance, Malinga [49] and Wang [50] found significant effects of spatial scale changes on the spatial expression of ecosystem services. This study further reveals the spatial response patterns of different ecosystem services and their spatial associations at various grid scales in mountainous terrains.
Innovations
The innovation of this study lies in its systematic analysis of ecosystem service responses to different grid scales in the typical mountainous region of Wangcao Town, Suiyang County, Guizhou Province, China, using GIS technology and the InVEST model. The study clarifies the sensitivity of various ecosystem services to grid scale changes and reveals how the relationships (trade-offs and synergies) between ecosystem services are influenced by grid scale. This careful consideration of terrain gradients, grid scale, and the relationships between ecosystem services provides a scientific basis for mountainous ecosystem management, particularly in optimizing ecosystem services and supporting policy decisions.
Additionally, the study quantifies the sensitivity of different ecosystem services to grid scale changes using variation coefficients for the first time, revealing scale dependency features in complex mountainous terrain conditions. The analysis of grid scale impacts on ecosystem services across different slope gradients indicates that low-gradient areas are more sensitive to grid scale changes, while high-gradient areas show relatively stable service performance. This finding provides important insights for differentiated management in mountainous regions.
Policy Recommendations
Based on the findings of this study, the following policy recommendations can enhance the sustainable management of ecosystem services in southwestern China’s mountainous regions:
(1) Zonal Management and Detailed Planning: The study shows varying sensitivities of ecosystem services to grid scale changes across different slope gradients. Therefore, ecological protection and land use policies should be based on terrain characteristics with zonal management. In lower-gradient areas, it is recommended to strengthen detailed management of ecosystem services such as water resources, soil retention, and nutrient purification.
(2) Promote Regional Ecological Synergies: Practical management should leverage the synergies between ecosystem services in different regions, particularly for services like soil retention, carbon storage, and water yield. For services with pronounced trade-offs, such as crop production and nutrient purification, integrating ecological compensation mechanisms and optimizing land use structures is necessary to avoid the negative impacts of overdevelopment on ecosystem services.
(3) Enhance Ecosystem Service Monitoring and Evaluation: Given the significant impact of grid scale changes on ecosystem services, future policy development should incorporate high-resolution remote sensing technologies to dynamically monitor changes in ecosystem services across different grid scales, ensuring scientific and effective management measures.
Limitations
This study focuses on the impact of grid scale on ecosystem services without considering the effects of scale dependency on natural factors such as climate and topography. It also lacks research on the combined effects of natural factors and human activities on ecosystem services. Additionally, this study primarily analyzes ecosystem service scale characteristics from a grid scale perspective without considering the effects of different spatial extents (e.g., provincial, watershed, transect, or sampling points) and does not include analysis of cultural services, hydropower, pollination, or pest control.
Conclusions
The study concludes that, under the influence of grid scale, the overall areas of paddy fields and forestlands increase, while areas of dry land, shrubland, built-up land, and water bodies decrease. There is heterogeneity in the area changes of different landscape types across slope gradients. Built-up land and water bodies show higher sensitivity to grid scale changes compared to other landscape types. With increasing grid scale, water yield, soil retention, nutrient purification, and crop production generally decrease, except for carbon storage, which increases. Nutrient purification shows greater sensitivity to grid scale changes compared to other ecosystem services. Soil retention, carbon storage, and nutrient purification show pronounced changes in the 0-5º slope gradient, while water yield and crop production show notable changes in gradients greater than 25º. The positive correlations (i.e., synergies) between water yield and soil retention, water yield and crop production, and soil retention and nutrient purification increase with grid scale, while negative correlations (i.e., trade-offs) between other ecosystem services also increase. The relationships between ecosystem services vary across different slope gradients under grid scale influence. Variations in the grid scale of forestlands, paddy fields, dry land, and shrublands are key factors in forming the scale characteristics of ecosystem services in mountainous regions.

