

Introduction
Wetlands are unique ecosystems with important roles in the environment, including water storage and purification, but also as providers of habitat, species refuges, nurseries, and aesthetics, which are all extremely valued by environmental scientists and naturalists [1-3]. Preserving these valuable biological communities is, therefore, of great importance. However, urban and infrastructure development, agricultural activities, and other anthropogenic influences could endanger ecosystems. Sensitive water bodies are being targeted due to uncontrolled use for long periods of time [4]. Given the imperative to prioritize the protection and restoration of wetlands on a large scale as one of the targets within the Sustainable Development Goals (SDG) by 2030, it is essential to address the numerous threats facing these protected areas, including water pollution influenced by anthropogenic activities and climate changes.
Different physico-chemical parameters influence the quality of water in protected ecosystems. Besides the laboratory analyses of physico-chemical parameters, the utilization of appropriate indices is crucial for understanding trends in water quality [5]. Different indices are used to assess water quality, especially for river water and groundwater [6]. According to the literature review, 23 different Water Quality Index (WQI) models and 10 Water Pollution Index (WPI) models are commonly used in research to assess water quality and measure pollution levels [7]. These indices can help in the assessment of ecosystem health, as well as in providing information to the general public and decision-makers, which is of crucial interest for future monitoring programs and management strategies aimed at enhancing water quality and biodiversity preservation, especially in protected areas such as wetlands [8].
Besides inorganic pollution, which different indices could assess, agricultural activities can introduce organic micropollutants, such as different pesticide residues, into delicate ecosystems. The contamination of freshwater with pesticide residues is of concern due to pesticides’ long-term and low-dose effects on non-target species [9]. In previous research of protected areas reported in the literature, pesticides, such as glyphosate and organochlorine pesticides, were detected in surface and groundwater in Mexico [10], water from phytotelmas (plant-held water) in Central America [11], lake sediments in Spain [12], and the atmosphere in Costa Rica and Uganda [13]. Research on pesticide residues in water bodies of protected areas, lakes, and wetlands, to our knowledge, has not been reported, but a study by Dhananjayan and Muralidharan [14] shows the presence of organochlorine pesticide residues in wetland fishes in India. The risk assessment of organic pollution has usually been used in other fields, such as river water or groundwater quality modeling [15, 16]; however, for protected areas such as wetlands, the pressure from runoff water was underestimated and not taken into account. Runoff water monitoring is important to identify pollution sources, predict and manage flooding risks, and protect water quality and ecosystems. Therefore, EU regulations, such as the Water Framework Directive (WFD), the Nitrates Directive (91/676/EEC), and the Floods Directive (2007/60/EC), establish a legal framework for monitoring runoff, while national laws ensure the implementation of EU requirements at the local level [17-19]. Also, monitoring runoff data is important for the risk impact assessment of runoff pollution, which could help evaluate its effects on the environment, thus supporting sustainable water management, climate change adaptation, and biodiversity protection.
Micropollutant contamination processes and sources for protected areas, such as wetlands and lakes, are rarely researched, especially in Western Balkan countries. The specific aims of this work are to 1) identify inorganic and organic pollutants, with special focus on pesticide residues in water samples at the protected area of Lake Zobnatica; 2) compare the reliability of different indices in water quality assessment in the protected area; 3) investigate the occurrence and spatial distribution of specific organic pollutants in protected water areas related to possible pollution sources; and 4) assess the environmental risk to the ecosystem in water of the protected area. To determine the natural and artificial impacts and to maintain the required water quality in the protected area, it is necessary to conduct a comprehensive water monitoring program and to provide a reliable interpretation of organic pollution, which was conducted by screening analyses of samples collected within three sampling campaigns.
This research builds on previously published study data in the protected area of Lake Zobnatica [20, 21] to calculate the Water Pollution Index (WPI), Weighted Arithmetic Water Quality Index (WAWQI), and Organic Pollution Index (OPI) for the same monitoring period. This offers a deeper understanding of water quality in the protected area. Water quality indices have been successfully used to assess surface and protected area lakes and rivers in Serbia [22-24].
Given the lack of detailed studies on water quality and environmental risk assessment concerning organic contamination in protected wetland areas, this research offers valuable insights. These findings can inform future responses to global climate change and anthropogenic activities, contributing to developing management plans that aim to mitigate pollution in wetland areas and align with the Sustainable Development Goals (SDGs).
Materials and Methods
Sampling
Water sampling campaigns were conducted at Lake Zobnatica, a protected area in Serbia that was artificially formed in 1976 in the valley of the River Krivaja, which led to the expansion of wetland habitats [20]. Surrounded by agricultural land, Lake Zobnatica serves multiple purposes: it is primarily used for irrigation, provides a crucial refuge for wetland species endangered by the regulation of the River Krivaja, and has become a popular countryside tourist destination with various leisure activities [25].
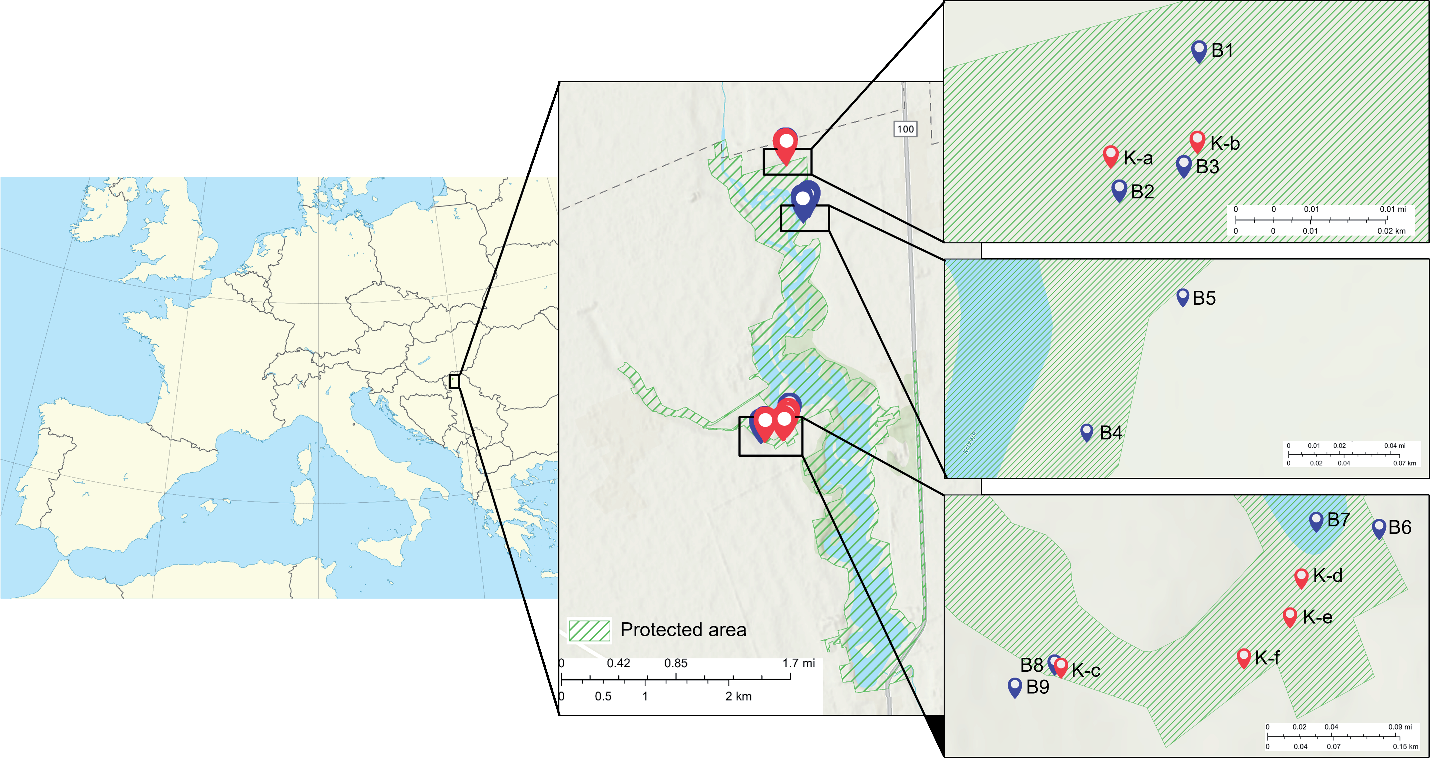
Seven sampling campaigns during different seasons were conducted at Lake Zobnatica to determine the water’s physicochemical properties. Samples collected in spring, summer, and autumn were specifically analyzed for the presence of individual organic pollutants. Water samples were taken from collectors labeled K-a to K-f to assess runoff water quality and the presence of organic pollutants, while samples from piezometers labeled B1 to B9 were used to analyze groundwater quality. Detailed information on the sampling points and their locations is provided in Table S1 and Fig. 1.
The detailed procedure for collecting samples for physicochemical parameter analysis is described in previously published papers [20, 21]. The groundwater and runoff sample collection processes were conducted in compliance with ISO 5667-1:2008, ISO 5667-3:2007, and ISO 5667-11:2019 [26-28] criteria. The sampling equipment was carefully assembled prior to each sampling campaign. A pretreatment of 1 L polyethylene (PE) bottles was performed to prevent potential sample contamination. For the quality assurance and quality control of the water sampling, replicated and field blank samples (deionized water) were considered. While runoff samples were taken from the constructed collectors, groundwater samples were taken from installed piezometers utilizing a manual point source bailer. After collecting samples, several measurements were carried out at the sampling site, such as pH, conductivity, dissolved oxygen, and temperature, to assess overall water quality. Samples were sealed and stored at 4°C to avoid possible contributions of light and temperature.
Water samples were collected in amber glass 2 L bottles to analyze organic pollutants. Each sample represented a 2-hour composite of 8 random samples taken in 15-minute intervals over 2 hours. Samples were then transported and kept at 4°C until analysis.
Sample Preparation and Analysis
For organic pollutant analysis, 800 ml of each water sample was placed in a 1000 ml glass separatory funnel and extracted with two 50 ml portions of dichloromethane for 20 minutes using an automatic shaker. After extraction, both extracts were combined, dried, and concentrated to a final volume of 1 ml using a heart-shaped flask for evaporation. Fifty µl of the extract was injected into the gas chromatography (GC) system by a large volume injection in solvent vent mode. The GC-MS screening analysis was performed using an Agilent 6890 gas chromatograph coupled to an Agilent 5973 mass spectrometric detector. The GC system was equipped with a programmed temperature vaporization (PTV) injector, suitable for large volume sampling, that was ramped from 60ºC to 260ºC (5 minutes) at 720ºC/ min. The capillary GC analysis was conducted on a 30 m x 250 μm I.D., 0.25 μm df DB-5MS column. The oven was programmed from 50ºC (10 minutes) followed by a slow temperature gradient of 2ºC/min to 250ºC and 20ºC/min to 310ºC (3 minutes). Helium was used as a carrier gas. The mass selective detector (MSD) was used for all the samples in the scan mode (m/z 45-600). The identification of compounds was done using Wiley7n and NIST17 mass spectral libraries. Blank samples were also analyzed following the same procedure to monitor the potential contamination of samples.
Water Pollution Index (WPI)
The Water Pollution Index (WPI) developed by Hossain and Patra [29] is a versatile and straightforward model for evaluating water quality. It can incorporate unlimited input parameters, making it adaptable to different water quality indicators and conditions. This flexibility enables comprehensive assessments across various contexts and water sources [30-33]. The WPI does not require weighted input parameters, which reduces potential bias.
In this paper, fifteen input parameters were considered for both runoff and groundwater samples: pH, EC, DO, PO43-, NO2-, NO3-, SO42-, Cl-, F-, Cr6+, Ni2+, total Fe, Zn2+, Cu2+, and COD. The WPI was calculated using the following Equations:
Where PLi is the pollution load, Si is the standard allowable limit, and Vi is the measured value of the ith parameter.
For dissolved oxygen (DO), the approach was based on the fact that higher levels of dissolved oxygen are desirable; therefore, the calculations were done using the following Equation:
For pH values, different approaches are used based on whether pH is below or above 7:
Where Sia represents the minimum permitted pH value (6.5), and Sib represents the maximum permitted pH value (8.5).
The WPI is calculated as the sum of the obtained PLi scores divided by the number of variables:
The WPI categorizes water quality into four classes: excellent (WPI<0.50), good (0.50≤WPI<0.75), moderately contaminated (0.75≤WPI≤1.00), and extremely polluted (WPI>1.00).
Weighted Arithmetic Water Quality Index (WAWQI)
The calculation of WQI was made using the weighted arithmetic index method first introduced by Horton [34], improved by Brown et al. [35], and later by Cude [36]. In the paper, the same fifteen parameters as for the WPI calculations were used for calculating WAWQI, using the following steps: calculation of the ith parameter’s subindex (qi) using the observed value (Vo), ideal value (Vi), and standard value (Vs).
Optimal values for pH were set to 7 and for DO 14.6 mg/L, while it was set to 0 for all other parameters. The subindex for pH and DO is expressed in Equations (7) and (8):
Calculation of unit weight: The unit weight (Wi) of various water quality parameters is inversely proportional to the recommended standards of the corresponding parameter.
Where Wi is the unit weightage for the ith parameter, Vs is the standard permissible value for the ith parameter, and K is a proportionality constant.
WQI is calculated using the following Equation:
After calculating the WQI, the measurement scale classifies the water quality as excellent (values from 0-25), good (26-50), poor (51-75), very poor (76-100), and highly polluted (>100).
Organic Pollution Index (OPI)
The organic pollution index (OPI) is calculated from the monitoring measurement of COD, DO, dissolved inorganic N (DIN), and dissolved P (DIP) using the following Equation [37]:
Where CODs, DINs, DIPs, and DOs are standard concentrations. Water quality can be classified into six classes according to OPI: excellent when <0, good when 1>OPI≥0, water beginning to be contaminated when 2>OPI≥1, lightly polluted when 3>OPI≥2, moderately polluted when 4>OPI≥3, and heavily polluted when OPI≥4.
These estimates are considerably more comprehensive than a single measurement and clearly demonstrate water quality. These indices can be used as a reference in monitoring surveys to inform decision-makers and the public about the state of a water body.
Environmental Risk Characterization
An environmental risk characterization procedure was conducted for detected organic compounds, in which measured environmental concentration (MEC) and ecological safety threshold – Predicted No Effect Concentration (PNEC) – were compared. Compounds with a Risk Quotient (RQ = MEC/PNEC) value above 1 are regarded as compounds of concern [38, 39].
PNEC is the concentration of a compound in any environment (in this study, in an aquatic environment) below which adverse effects will most likely not occur during long-term or short-term exposure. The PNECs are based on experimental ecotoxicity data, or in the case of no available experimental data, quantitative structure-activity relationship (QSAR) predictions could be used to estimate the provisional PNEC (P-PNEC) value. This study used the lowest PNEC values from the NORMAN Ecotoxicology Database for prioritization purposes [40].
Results and Discussion
Indicators of Water Pollution
Table 1 summarizes the analysis of the Water Pollution Index (WPI), Weight Arithmetic Water Quality Index (WAWQI), and Organic Pollution Index (OPI) for both runoff and groundwater samples.
According to WPI, the groundwater quality was assessed as excellent or good, except for one sampling point (B6) collected only in one sampling campaign due to the absence of water, which is located near the Krivaja River and agricultural areas without vegetation buffer strips and qualified as moderately polluted (Fig. 2). WPI also indicated excellent to good quality for runoff samples, per the requirements for wetland protected areas.
Compared with WPI, WAWQI shows a slight difference in the categorization of the water quality of groundwater and runoff samples, indicating differences between locations where WPI, which uses no weighing factor in the calculations, shows similar results (Fig. 3). WAWQI showed data matching for groundwater quality (excellent or good) in the upper and middle parts of the observed locations of the protected area; however, in the lower part, the status was indicated as poor for two close locations (B8 and B9). Runoff samples that are directly influenced by anthropogenic activities showed poor (K-a, K-e) to very poor (K-b, K-f) quality for most investigated locations. The excellent runoff water status by WAWQI was obtained only for K-d, corresponds to WPI.
OPI presented that most groundwater samples had excellent water quality, except in the lower part of the protected area, where B9 was classified as ‘begin to be contaminated’, corresponding to WAWQI and B6 being lightly polluted (Fig. 4). For location B6, moderate pollution was also indicated by WPI. Runoff water samples were: excellent quality (K-c), good quality (K-d), begin to be contaminated (K-a), lightly polluted (K-f), and moderately polluted (K-e). OPI corresponds to WAWQI for most of the analyzed samples. The influence of vegetation buffer strips could be noticed for sampling locations K-a and K-b, where location K-a is protected with vegetation buffer strips, which retain the pollutants, while location K-b is without vegetation buffer strip protection. Thus, higher pollution could be expected. The largest width of the vegetation buffer strips is observed in the middle part, while the smallest is in the lower part of the protected area, resulting in reduced retention of nutrients and other pollutants.
Table 1.
WPI, WAWQI, and OPI for runoff and groundwater samples.
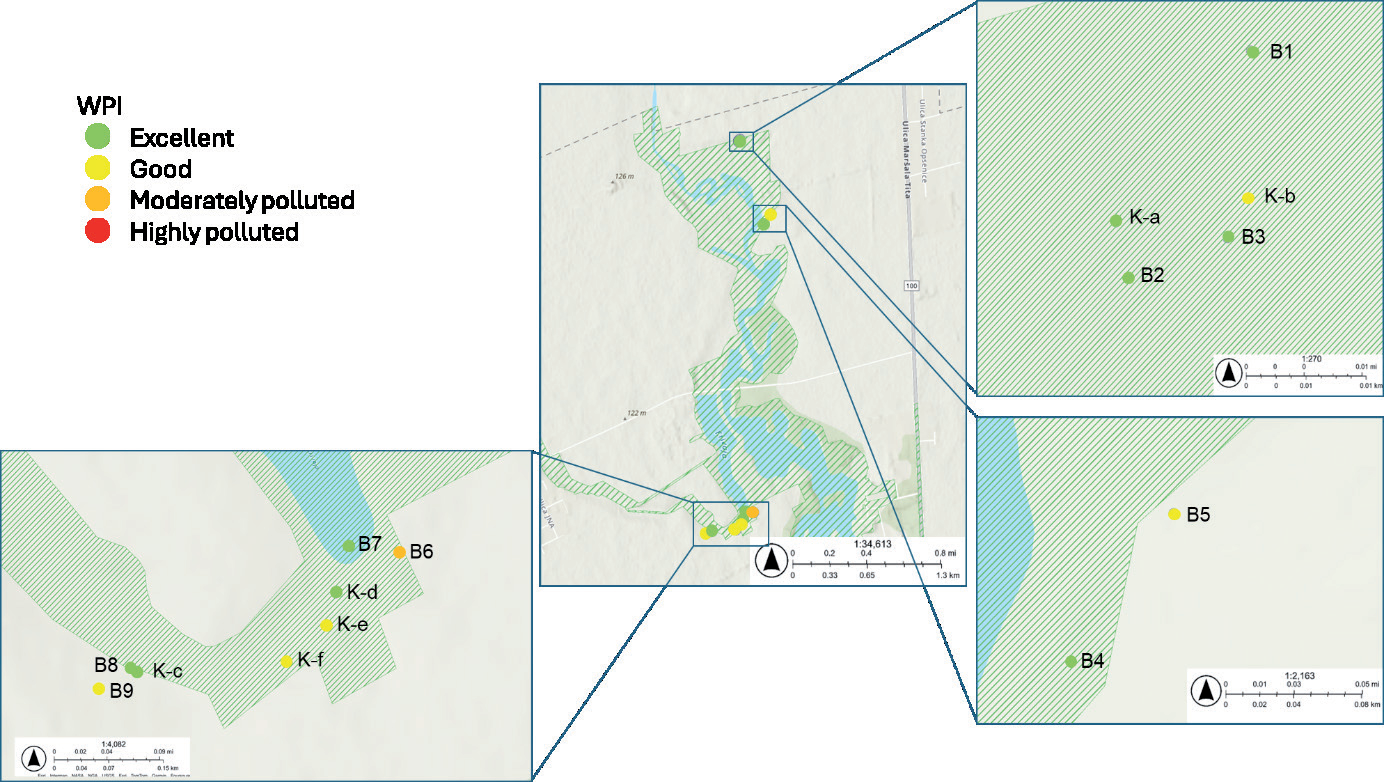
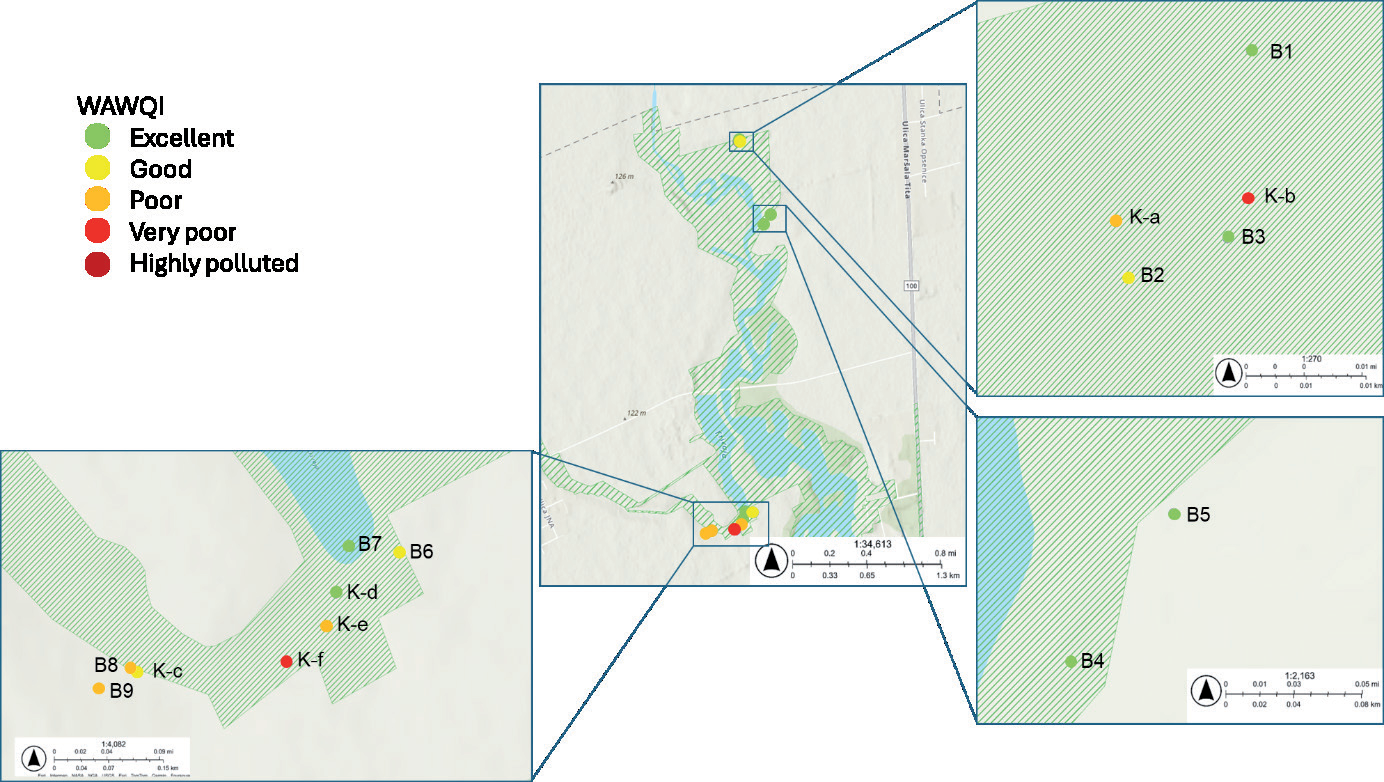
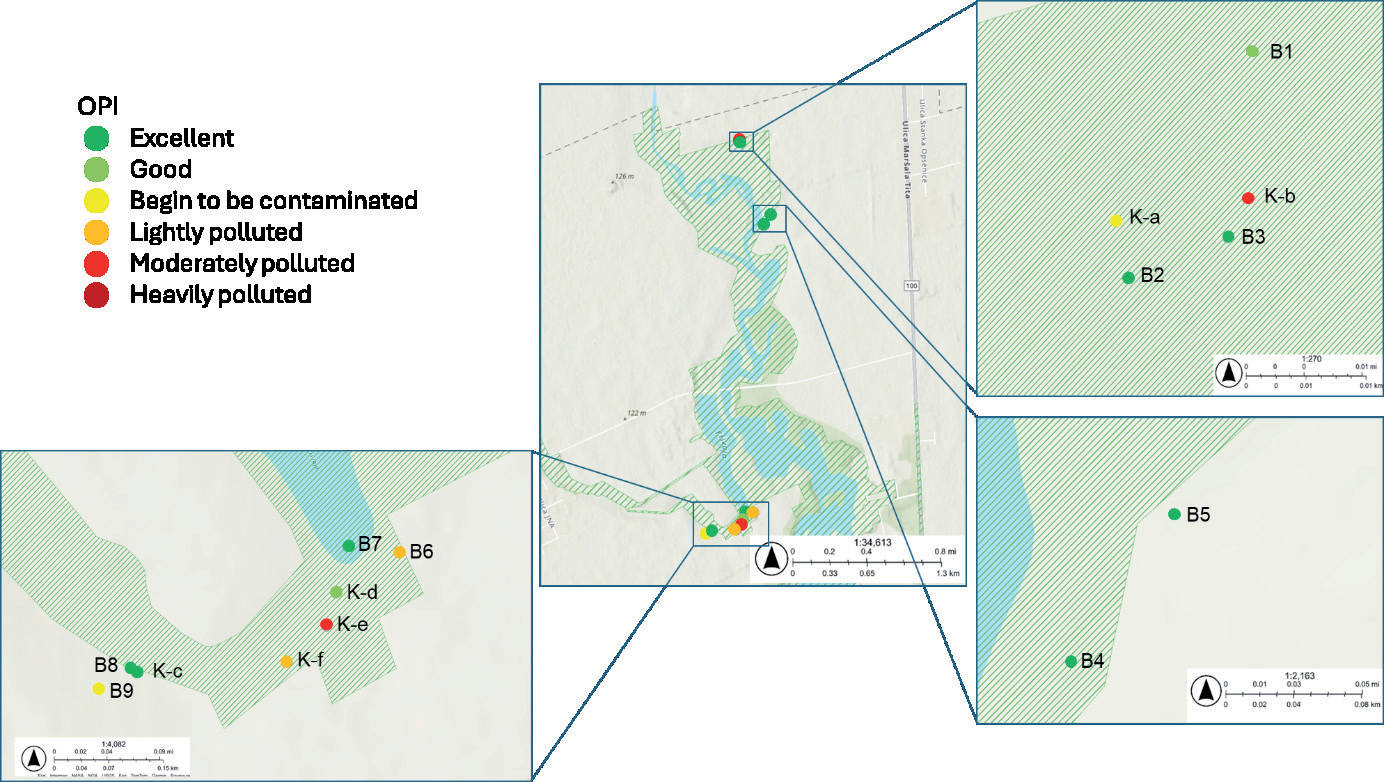
WPI indicates that groundwater quality is generally excellent or good, except for one sampling point (B6) near the Krivaja River, which was moderately polluted due to its proximity to agricultural areas without vegetation buffer strips protection. WAWQI confirms good to excellent water quality in the upper and middle parts of the observed locations in the protected area but reveals poorer quality in the lower part, particularly for locations B8 and B9. OPI also supports these findings, indicating that groundwater in B9 is beginning to be contaminated.
WPI shows that runoff water quality ranges from excellent to good, aligning with the requirements for wetland-protected areas. However, WAWQI reveals a more varied quality, with some locations, especially those influenced by anthropogenic activities (K-a, K-b, K-e, and K-f), showing poor to very poor water quality. The OPI results highlight that runoff water quality is more significantly impacted, with some samples (K-c) maintaining excellent quality, while others (K-a, K-e, and K-f) show varying pollution levels, from “begin to be contaminated” to “moderately polluted”.
Even though WPI and WQI include a greater number of parameters in calculations, a single bad parameter could result in the eclipsing or overemphasizing of these indices [41, 42].
OPI is indicated as the most comprehensive index since it is based on nutrients (nitrogen and phosphorus parameters) whose concentrations were elevated due to the widespread use of nitrogen-based and phosphorus-based fertilizers and the high organic matter load (COD), which is associated with biochemical processes that lead to increased nutrient levels and decreased dissolved oxygen concentrations, resulting in rapid deterioration of the aquatic ecosystem’s quality.
OPI includes only specific parameters corresponding to organic load (DO, nitrate, nitrite, ammonium ion, orthophosphates, and COD) and presents the most relevant information about water quality. WPI and WAWQI include a wide range of parameters that are not all specific and relevant to the pollution of wetlands, which are under high pressure from agricultural activities; therefore, the results are underestimated and irrelevant to the investigated protected area. These findings are also significant from the economic aspect of the feasibility of future monitoring programs.
Since the groundwater was not under pressure from contaminant pollution, the screening analyses were performed only on runoff samples to investigate pollution sources and relations between organic pollutants and assess ecological risk for selected protected areas.
Spatial Distribution of Organic Micropollutants
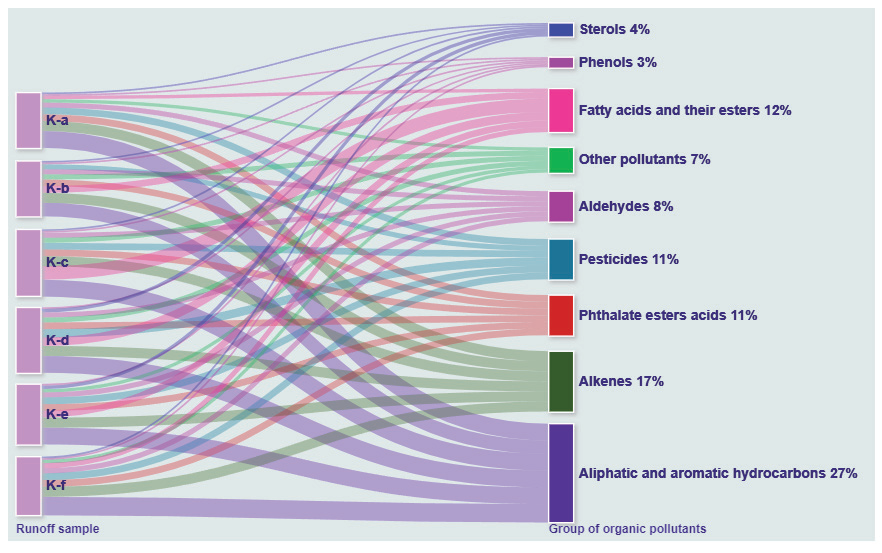
Tables S2 and S3 summarize the organic microcontaminants detected in the runoff samples collected from the Lake Zobnatica area. As indicated in Table S3 and Fig. 5, a wide range of organic pollutants were detected, including pesticide residues, phthalate esters, fatty acids and their esters, aliphatic and aromatic hydrocarbons, sterols, phenols, and aldehydes. These organic micropollutants of interest were not detected in the blank samples.
The micropollutants detected originate from various sources, such as synthetic fertilizers, soil quality supplements, pesticide adjuvants, and irrigation water. The spatial distribution of specific groups of micropollutants within runoff samples is presented in Fig. 2. The most abundant were aliphatic and aromatic hydrocarbons such as docosane, 3-methyl, docosane, eicosane, 2-methyl-, eicosane, octacosane, tricosane, heneicosane, pentacosane, n-nonacosane, and n-tetracosane (27%), especially at sampling locations in the lower part of the protected area near the Krivaja River.
Alkenes (2-dodecene, 1-tridecene, 5-tetradecene, 1-heptadecene, 1-octadecene, 1-hexadecene) were the second most abundant group of compounds (17%). Their spatial distribution within the selected protected area was uniform at all sampling locations. Aldehydes (decanal, dodecanal, tetradecanal) and phenol (phenol, 2,4-bis(1,1-dimethylethyl)-) also exhibited homogeneous distribution. These compounds likely originate from bioactive substances in various organic agricultural crops [43]. Plants, particularly wetland vegetation, can release alkenes through transpiration. Also, pesticides and fertilizers used in agricultural practices can introduce alkenes into wetland waters. Herbicides and insecticides were also the primary sources of phenol introduced to water bodies [44].
The fatty acid components that were identified in runoff samples appear as a constituent (organic carbon compounds) of natural organic matter (NOM) of soil [45] and are the third group with the largest number of compounds in this study (12%). The major constituents of NOM were fatty acids and myristic acid (n-tetradecanoic acid) detected in four runoff sample collector points in the lower part of the protected area (samples K-c, K-d, K-e, and K-f), while octadec-9-enoic acid was in samples K-b, K-c, K-f, and palmitoleic acid (cis-9-hexadecenoic acid) was in samples K-b, K-c, and K-d. The fatty acid ester, octadecanoic acid, and 2,3-dihydroxypropyl ester were detected in all samples. Dichloroacetic acid, undecyl ester, was identified in samples K-c, K-d, and K-e, while hexanedioic acid, bis(2-ethylhexyl) ester, was found in samples K-a and K-c. Butanoic acid, 2-ethylhexyl ester, was found in samples K-c and K-e. Dichloroacetic acid, undecyl ester, hexadecanoic acid, and octadecyl ester were present in samples K-c and K-d.
Both natural and synthetic progestins are widely used in agriculture and have endocrine-disrupting effects even at trace levels. The 17-hydroxyprogesterone derivate, medroxyprogesterone acetate (MPA), was detected in the runoff samples. Through agricultural use, these progestins enter the environment and interact with various environmental compartments, being transported through runoff to surface waters such as rivers, lakes, and other aquatic systems [46, 47].
Cholesterol, a fecal sterol, was present in all analyzed samples, while epicoprostanol was detected only in sample K-e. The presence of these sterols in agricultural runoff may be attributed to the use of animal waste-based fertilizers [48]. 2,6-Diisopropylnaphthalene (DIPN), a plant growth regulator, was identified only in sample K-d.
Phthalate ester acids are widely used plasticizers for producing various packaging for agricultural products. The presence of phthalate esters in agricultural activities is reflected in the fact that they are an integral part of agricultural chemicals (pesticides and fertilizers) or in terms of the use of plastic films and wastewater for irrigation purposes [49]. Although they are part of agrochemical packaging, some phthalate compounds are also used in pesticide and fertilizer solutions [50]. Intensive usage of these organic micropollutants causes their heterogeneous distribution among agricultural soil-water systems. These sources cause the migration of phthalate pollutants through agricultural soil, as well as via runoff or leaching during rainy periods into aquatic mediums (surface and groundwater). The dominant representatives of phthalate acid esters, such as diisobutyl phthalate (DIBP), dibutyl phthalate (DBP), bis(2-ethylhexyl) terephthalate (DEHT), and bis(2-ethylhexyl) phthalate (DEHP), were detected in all analyzed samples. Since phthalates are defined as endocrine disruptors, their migration to surrounding water areas such as lakes and groundwater media can lead to serious environmental risks and consequences for the quality of aquatic media.
During the summer sampling campaign, carbamide urea was identified in the runoff samples, while urea was not found in the autumn campaign. Due to agricultural activities and extensive application of urea as nitrogen fertilizer to improve agricultural soil quality, its detection in the analyzed samples was expected. Urea is defined as a dissolved nitrogen form that can be formed during natural and anthropogenic processes [51]. After applying urea and its microbiological decomposition, it remains in the soil media due to different environmental and agricultural soil conditions. However, during the rainy or irrigation periods, urea, as a significant nitrogen contributor, is rinsed away and transported to various aquatic media [52].
Caffeine, a stimulant and lifestyle compound, was detected only in sample K-d, signifying human activity at this sampling location during autumn. According to previously reported studies, caffeine’s distribution was confirmed in lakes and soil where agricultural activities are present [53]. Caffeine is defined as a suitable marker of anthropogenic pressure on various aquatic ecosystems due to its unique physicochemical characteristics, nevertheless, for groundwater contamination [54].
Given that the sampling locations are in areas where agricultural activities are carried out, certain classes of pesticides were expected to be detected in runoff samples. One of the dominant routes for agrochemical compounds and other organic pollutants to enter the environment is runoff across the soil surface. The behavior and distribution of pesticides depend on their type, main purpose, and basic physicochemical parameters, such as adsorption, absorption, and solubility of the n-octanol-water partition coefficient, as well as soil characteristics [55].
The detection of pesticide residues was more pronounced in the summer than in the autumn campaign, indicating that agricultural activities were carried out more extensively during the summer than in the autumn. Identified pesticides are presented in Table S2. One of the pesticides detected during the June sampling was the degradation product of the widely used herbicide glyphosate, aminomethylphosphonic acid (AMPA).
The identified AMPA indicates the widely used pesticide glyphosate was used in the selected sampling sites. After applying the herbicide glyphosate as a parent compound for crops and weed treatment, it degrades to AMPA, which is later transported to the soil media [56]. According to a previously published review study [57] and with the wide applicability of glyphosate in mind, AMPA is defined as a persistent substance in water and agricultural soil. AMPA tends to adsorb to soil particles and migrate to other environmental media. A research study by Coupe et al. [58] showed that a high concentration of AMPA, which migrates to the surface water, is related to runoff after using glyphosate.
The only pesticide detected in all sampling campaigns was a member of the chloro-s-triazine group, terbuthylazine.
Epoxiconazole was detected only in samples K-c and K-d during the autumn sampling campaign, e. Epoxiconazole is a fungicide belonging to the triazole group, and it is widely used due to its bactericidal and preventive effects [59]. According to a study by Passeport et al. [60], intensive usage of epoxiconazole causes its persistence in soil with a half-life of 354 days. Likewise, it can reach groundwater and surface water via surface runoff. Alpha-Cypermethrin and diphenyl sulfide were detected only during the summer campaign.
The spatial distribution was uniform for most of the detected groups of compounds, except for fatty acid components, which were the most dominant in sample K-c, aliphatic and aromatic hydrocarbons in sample K-f, and the highest number of pesticide compounds were detected in sample K-d. This corresponds to the fact that the smallest width of the vegetation buffer strips is in the lower part of the protected area, indicating the lowest efficiency of pollutant retention. Results also correspond to the indices WAWQI and OPI, which showed poorer water quality status in the lower part of the protected area.
Environmental Risk Characterization
Environmental risk characterization was conducted for relevant detected organic pollutants, and Table 2 presents selected compounds with the highest RQ (all higher than 1).
The highest RQ was for dibutyl and diisobutyl phthalate. This result for dibutyl phthalate as an environmental hazard for aquatic organisms complies with United States Environmental Protection Agency (US EPA) findings [61]. Dibutyl phthalate has been listed as a priority pollutant by the US EPA and China State EPA [62]. Diisobutyl phthalate is considered to be banned by the Consumer Product Safety Commission’s advisory panel [62]. The metabolite of the fungicide Edifenphos, diphenyl sulfide, had an RQ of 2863.59. The five compounds presented in Table 2 with high RQ should be considered for inclusion in monitoring programs of protected area aquatic systems near agricultural and human activities.
Table 2.
List of compounds of concern and their risk quotients (RQ).
Compounds with RQ>1 could pose a significant ecological risk to the aquatic biota. Therefore, control measures are needed for these organic compounds in the future. They need to be included in the prioritization list for future monitoring programs. The results of this study could be used to improve the protection of the aquatic ecosystem and reduce their exposure to toxic organic compounds in wetland areas. RQ obtained in this study is of great importance for creating an optimized prioritization list for runoff water monitoring influenced by agricultural activities, which results in cost reduction for future analyses and thus has economic benefit.
Establishing and maintaining wider vegetation buffer strips along the banks of surface waters in protected areas near agricultural activities will not only enable pollutant retention and reduce eutrophication but also improve landscape resilience through habitat revitalization. In addition to modifying local climatic conditions, wider vegetation buffer strips would also contribute to mitigating climate change impacts by storing carbon and reducing its presence in the atmosphere.
Therefore, it is of great interest to define guidelines for the cost-effective establishment and management of bankside multifunctional vegetation buffer strips. Adequate vegetation buffer strips also reduce soil erosion and sedimentation in water bodies.
The development of an open-access database for storing monitoring data of water quality in protected areas will enable easy access to a wider audience as well as local communities, thus raising awareness for pollution prevention. Educating local communities regarding the importance of wetlands and the impacts of water pollution on biodiversity conservation is not only of local importance but also of global significance.
Water quality and environmental risk assessment concerning organic contamination in protected wetland areas is a key step in aligning with the SDGs, particularly those related to water quality (SDG 6), biodiversity (SDG 15), climate action (SDG 13), and sustainable food production (SDG 2). Protecting and restoring wetlands through comprehensive risk assessments and implementing appropriate mitigation strategies ensures the health of wetlands, improves water quality, protects biodiversity, and promotes sustainable practices that benefit both people and the environment.
Conclusions
The characterization of water from collectors and groundwater in the protected area of Lake Zobnatica in the Vojvodina region using water indices has provided crucial data on contamination levels within this sensitive wetland locality. The study aimed to identify inorganic and organic pollutants, compare the reliability of different indices in water quality assessment, investigate the spatial distribution of specific organic pollutants, and assess the environmental risk to the ecosystem.
Specific pesticides, including terbuthylazine, alpha-cypermethrin, and aminomethylphosphonic acid (AMPA), together with other organic pollutants such as phthalate esters, fatty acids, phenols, and aldehydes, were detected. The occurrence of these pollutants varied seasonally, with higher concentrations observed during the summer. Phthalates are defined as endocrine disruptors, and their migration to surrounding water can lead to serious environmental risks for the quality of aquatic media. The environmental risk characterization suggests that the highest risk quotients are diisobutyl and dibutyl phthalate, eicosane, phenol, 2,4-bis(1,1- dimethylethyl)-, and diphenyl sulfide.
The comparison of water quality indices (WPI, WAWQI, and OPI) revealed that OPI is the most comprehensive index for assessing organic pollution in this wetland. OPI’s focus on specific parameters, including dissolved oxygen, nitrates, nitrites, ammonium ions, orthophosphates, and COD, provided a clearer picture of pollution levels compared to WPI and WAWQI, which encompass broader parameters and may underestimate pollution from agricultural activities. Spatial distribution analysis highlighted that groundwater quality is generally good to excellent, except for areas near agricultural activities without vegetation buffer strips (e.g., sampling point B6). Runoff water quality showed more variation, with poor water quality in the ‘begin to be contaminated’ to ‘moderately polluted’ water in areas influenced by anthropogenic activities (e.g., locations K-a, K-b, K-e, and K-f). Vegetation buffer strips were found to play a critical role in mitigating pollution, with narrower strips in the lower parts of the observed area leading to reduced nutrient and pollutant retention.
The environmental risk assessment highlights the need to modify existing monitoring programs to include newly identified pollutants. In the context of wetland biodiversity and surface and groundwater protection, developing regular environmental management plans and guidelines for future monitoring programs in agricultural areas is of particular importance. The current lack of active protection measures, insufficient control, and monitoring in protected areas underscores the need for a comprehensive plan to enhance water quality monitoring, particularly for nature conservation in wetland areas.
To comply with the Water Framework Directive (WFD) requirements, developing monitoring programs that incorporate newly identified pollutants and applying a risk assessment approach for optimizing future monitoring is recommended. Implementing an advanced monitoring system will not only provide valuable data for better environmental and biodiversity management but also help to minimize risks and costs while maximizing benefits and public acceptance. These results could serve as a case study for the wise use of wetlands in agricultural regions and lowland areas, offering insights for developing more complex monitoring systems in the future. Beyond determining pollution levels and associated risks, the study lays the groundwork for ongoing and future efforts to improve wetland management. This includes long-term monitoring to evaluate the effectiveness of mitigation measures, further research into pollution sources, and the refinement of environmental management plans to adapt to emerging challenges. By implementing these recommendations, the work can contribute to broader biodiversity conservation goals and sustainable agricultural practices in sensitive wetland ecosystems.

