

Introduction
Phosphorus (P), among other macronutrients, is a primary nutrient for plant growth apart from nitrogen and potassium and is essential for various physiological activities, including energy metabolism, photosynthesis, and metabolism [1]. When growing wheat (Triticum aestivum L.), one of the most widely grown cereals in the world, it is likely to achieve optimal yield levels where adequate phosphorus is available [2]. However, the issue of phosphorus insufficiency, which is attributed to several factors, arises as one of the most critical nutritional deficiencies in the diets of most agricultural crops across the globe, specifically in regions with low levels of phosphorus availability in the soil or those that have a poor capacity to move phosphorus throughout the various soils’ profiles [3, 4]. Several mechanisms in soil systems govern the availability of phosphorus to crops; for example, soil water availability, biota present in the soils, and other abiotic factors through which phosphorus moves through soil profiles or may even get wholly fixed [5, 6]. It is important to formulate suitable strategies for phosphorus management in wheat production under varying soil moisture and seeding time conditions [7, 8]. Phosphorus is present in soil in organic and inorganic forms, with the inorganic form being more readily absorbed by plants [9]. However, phosphorus availability is often limited by chemical processes in the soil that form insoluble phosphorus, mainly calcium, iron, and aluminum-bound phosphorus complexes [10]. Soil pH, organic matter content, and moisture levels, among other factors, impact the bioavailability of phosphorus, leading to the variability of its uptake by plants [11]. The timing of phosphorus application and seeding dates are key factors in improving Phosphorus Use Efficiency (PUE) in cropping systems [12]. Sufficient water content in the soil assists in the diffusion of phosphorus towards the roots of plants, hence improving phosphorus uptake [3]. On the other hand, phosphorus availability is adversely impacted at both extremes of moisture with very high wetness or drought conditions due to their impact on soil physical and chemical properties such as porosity, redox potential, and even microbial activity [13].
Soil moisture content is crucial for the phosphorus cycle as it affects both the phosphorus transport and the development of plant root systems [14]. When soil moisture is adequate, phosphorus can be isolated from soil particles and will diffuse from them onto the root’s surface, where the uptake is facilitated by plants [15]. At the same time, both waterlogging and dry conditions create an unfavorable environment for the movement of phosphorus, and therefore, its use by crops will be limited [16]. Fluctuating moisture levels also interfere with phosphorus sorption and desorption kinetics and do not make the situation easier in terms of phosphorus bioavailability in wheat [17]. P availability within the soil concerning the plants relies not only on the moisture content but also on the architecture of the root system. Where soil moisture is not limited, wheat crops are able to develop a more extensive root system, which would provide more surface area for the absorption of phosphorus [18]. Drought, on the other hand, limits root growth, which, in this case, means the plant’s ability to take phosphorus from the soil increases. Such intricate relationships demonstrate how appropriate soil moisture management in wheat is critical in attaining effective nutrient uptake in wheat crops. Seeding time yields large differences in phosphorus uptake efficiency in wheat crops [19]. Early sowing in optimal conditions allows quick crop establishment, increasing the growth of roots and their ability to take up nutrients [20]. On the other hand, late sowing exposes wheat to suboptimal conditions, such as low temperature and low moisture content, which restrict root expansion and hamper phosphorus uptake [21]. Therefore, there is a need to identify and optimize other factors like peak sowing time to improve PUE and crop yield. PUE, which is the ratio of crop yield to the applied or absorbed amount of phosphorus, describes the ratio that determines how effective the plant is in utilizing phosphorus resources [22]. Enhancement of PUE is even more pertinent because of the diminishing resource capacity of quality phosphorus fertilizers and ecological concerns arising from phosphorus runoff and eutrophication [23].
Generally, phosphorus fertilizers such as diammonium phosphate (DAP) or triple superphosphate (TSP) are applied during seeding as a standard practice [24]. It’s worth noting that placing phosphorus fertilizers closer to the seed has proven effective in enhancing phosphorus acquisition, particularly in phosphorus-deficient soils [25]. As a result of increased site-specific agricultural management, better solutions for phosphorus incorporation have emerged. Variable Rate Application (VRA) of phosphorus integrated with soil-specific nutrient maps and requirements of the crop minimizes wastage by targeting fertilizer where it is most needed [26]. Furthermore, the application of slow-release phosphorus fertilizers and phosphorus-containing microbial inoculants is being considered to enhance the efficacy of phosphorus fertilizers and improve PUE [27]. However, some advances have been made, as much is still not completely known regarding phosphorus in the wheat production system, i.e., phosphorus availability, with seeding time and moisture availability in the soil, which should be examined under controlled conditions [28]. Wheat breeding strategies targeting increased phosphorus acquisition efficiency, especially in low-input/phosphorus-deficient areas, are also necessary [29]. More systematic approaches should be studied in the future regarding phosphorus management in combination with its integration with other nutrients, such as nitrogen or potassium, to increase nutrient use efficiency as a whole and crop productivity in general [30]. Modern technologies such as remote sensing and artificial intelligence are observed to significantly impact how phosphorus is managed. These technologies facilitate accurate and sustainable nutrient management by providing real-time information on the phosphorus status of soils and crops [31]. Phosphorus is a key nutrient for wheat; however, its high immobility within the soil is attributed to several factors, including moisture levels in the soil and pH and chemical changes. Phosphorus dynamics can effectively be managed through an integrated approach of optimal fertilization, appropriate water management, and appropriate timing of sowing [32]. Precision agriculture tools, increasingly adopted in agronomic systems, offer significant potential for improving phosphorus efficiency. However, further studies are necessary to be able to come up with sustainable methods that enhance crop productivity while at the same time protecting the environment [33]. It is hypothesized to evaluate the impact of climate change on phosphorus dynamics in soil and wheat plants, along with identifying superior wheat genotypes with improved phosphorus use efficiency and drought tolerance.
Materials and Methods
Experiment Condition
A pot study was conducted at the Department of Agronomy, Faculty of Agricultural Sciences and Technology, Bahauddin Zakariya University, Multan, Pakistan, to study the performance of six (6) wheat genotypes. The genotypes included Faisalabad-2008 (V1), Galaxy-2013 (V2), Johar-2016 (V3), Gold-2016 (V4), Ujala-2016 (V5), and Borlaug (V6), obtained from the Pakistan Central Cotton Research Institute, Multan, Pakistan. The experiment followed a Completely Randomized Design (CRD) with a split-plot arrangement, replicated three times, to study the effect of two factors, including varieties and different phosphorus levels. Six varieties of wheat (Faisalabad-2008, Galaxy-2013, Johar-2016, Gold-2016, Ujala-2016, and Borlagh-2016) were examined at 0, 60, 70, 80, 90, and 100 kg ha-1 phosphorus. A 20×35 cm soil-filled clay pot experiment was conducted in a net house under natural conditions. Nitrogen and potash were applied, and crops were harvested after maturity for analysis.
Soil Preparation and Pre-analysis of Soil
The soil was sieved with a 2 mm mesh and stored for physico-chemical assessment before filling the pots. These parameters were examined using conventional methods. Hydrometers determine soil texture, and the international texture triangle classifies it [34]. Air-dried soil (50 g) was mixed with 40 mL of 1% sodium hexametaphosphate (NaPO3)6 solution and 250 mL filtered water. The US Salinity Laboratory Staff (1954) method created a Soil Saturated Paste (SSP) and measured soil pH with a Kent EIL 7015 pH meter. SSP extract was vacuum-pumped, and Electrical Conductivity (EC) was measured with a digital Jenway EC meter (model 4070). Total soil nitrogen was measured by sulfuric acid digestion (Wolf, 1982) and distillation using the macro Kjeldahl method [35]. To measure phosphorus, 5 g of soil was extracted with 0.5 M NaHCO₃ (pH 8.5) and reacted with ascorbic acid. A Cary 60 UV spectrophotometer measured extracted phosphorus (Watanabe and Olsen, 1965). The soil was extracted with 1 N ammonium acetate (pH 7.0) and analyzed with a Jenway PFP-7 flame photometer to determine extractable potassium (Richards, 1954). The experimental soil’s basic physico-chemical parameters are depicted in Table 1.
Growth Analysis
At maturity, various wheat parameters were measured. Plant height was measured in centimeters (cm) from 10 random primary tillers per plot. Fertile tillers were counted per square meter (m2) in three random subplots per plot. Average normal and sterile spikes were calculated per square meter (m2) from three random samples per plot per replication. Spike length was measured in centimeters (cm) from the base of the rachis to the tip, excluding awns. Spikelets were counted per spike, and grains were recorded per spike by manually threshing ten main tillers per plot. Additionally, dry matter production was assessed by harvesting wheat plants from a predetermined area within each plot, sun-drying, oven-drying, and weighing to determine total dry matter (g m-2).
Leaf Area Index (LAI)
Plant samples were collected from each plot’s selected random unit area at a couple of weeks’ intervals from 45 to 105 days following seeding. Leaf weights were recorded on an electrical balance after the secession from columns. Each leaf lot was subsampled at 5 g. The leaf area meter (JVC TK-5310) measured the leaf area through the formulas given by Hunt (1978):
LAI = (Leaf area)/ (Ground area) Leaf area duration (LAD) days:
The Hunt (1978) method was used to compute leaf area duration (LAD):
LAD = (LAI1 + LAI2) ⁄ 2×(t2-t1)
Where LAI1 = Leaf area index at first time, LAI2 = Leaf area index at 2nd time, t1 = Time of first LAI, t2 = Time of 2nd LAI.
Crop Growth Rate (g m-2 day-1)
45 days after seeding, plant samples were collected from each plot’s randomly selected unit area every two weeks until 105 days. After drying, samples were heated at 70ºC for 3 days to maintain weight. We determined crop growth rate using Hunt (1978):
CGR = (W2-W1) ⁄ (t2-t1) where W1 = Plant dry weight at t1, W2 = Plant dry weight at t2, t1 = Time of 1st harvest, t2 = Time of 2nd harvest.
Net assimilation rate (g m-2 day-1):
Net assimilation rate (NAR) was calculated using the formula of Hunt (1978):
NAR = TDM/LAD where TDM = Total dry matter, LAD = Leaf area duration.
Yield Attributes
The yield parameters were determined as follows: 1000-grain weight was measured in grams (g). After sun-drying and weighing the total wheat biomass per plot, the biological yield was determined in tons per hectare (t ha-1). After threshing and processing, grain and straw yields were measured in tons per hectare (t ha-1). The final harvest index was grain yield/total biological yield.
Harvest Index (HI) = (Grain Yield)/
(Biological Yield) × 100
Nutritional Quality Attributes
Grain Protein Content (%)
For each treatment, grain protein samples were measured with near-infrared (NIR) technology (Omega Analyzer G™ Bruins Instruments, Germany). The NIR Omega G Analyzer precisely measures whole-grain cereal parameters (wheat, rice, corn, soybeans, and oats). Moroi et al. (2011) describe this as a fast and effective sample analysis method that requires no sample prep or chemistry. Protein was measured from 500 g wheat grain samples from each replication plot. An infrared (NIR) was used to measure the reflectance of the weighted samples.
Grain Carbohydrate Content (%)
NIR was used to analyze starch. 500 g of wheat grain was harvested from each replication plot. Weighted samples were placed into an NIR, and reflectance values were recorded.
Grain Moisture Content (%)
The Omega Analyzer G™ Bruins Instruments, Germany, uses near-infrared (NIR) technology to also measure grain moisture levels. 500 g of wheat grain samples were taken from each replication plot. An infrared (NIR) spectrometer was used to measure the reflectance of the weighted samples.
Statistical Analysis
The data were examined using Fisher’s analysis of variance, whereas the Least Significant Test (LSD) at 5% probability was evaluated for the treatment means [36]. The data graphs were drawn using Microsoft Excel 2021.
Results and Discussion
Growth Attributes
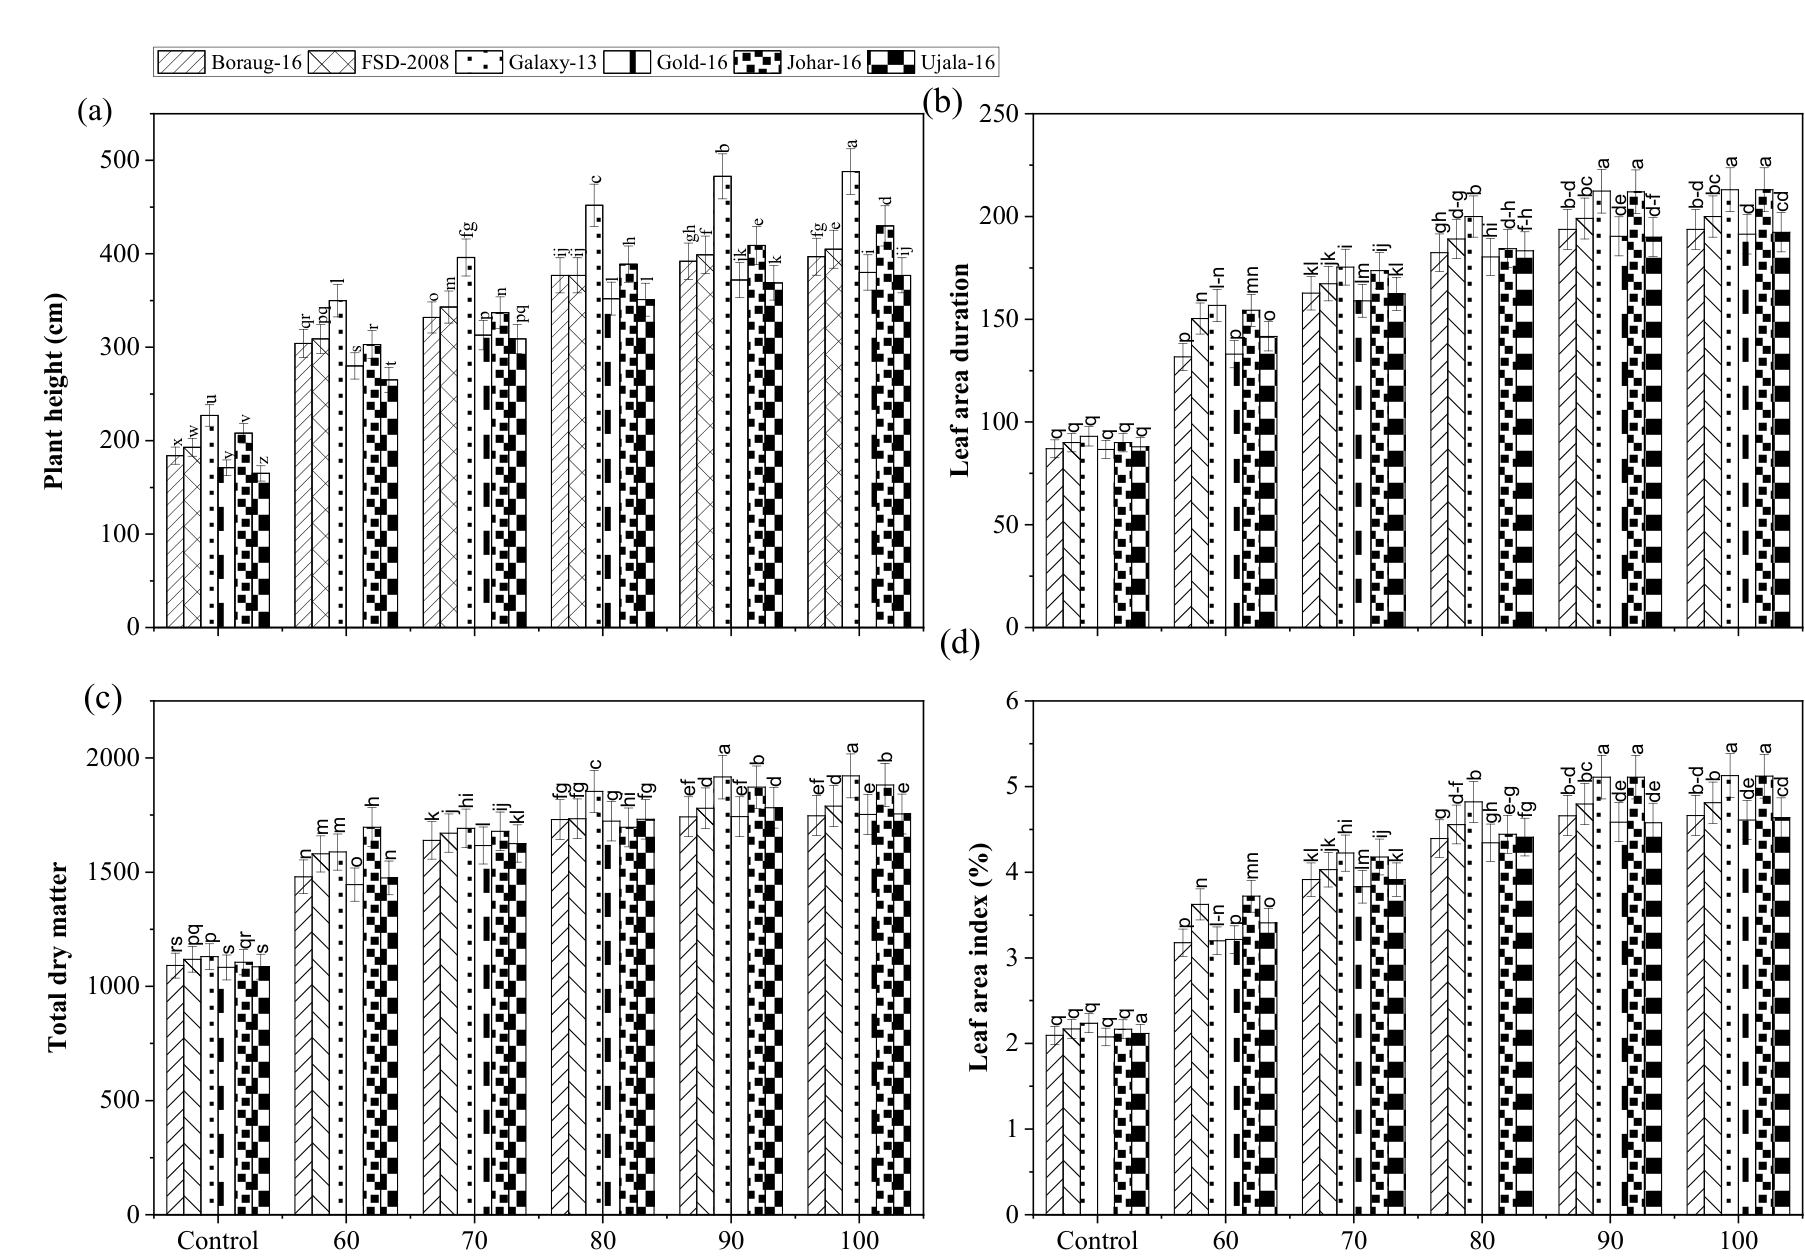
The Leaf Area Index (LAI) data of six wheat varieties reveal significant effects of phosphorus application (Fig. 1). The LAI values for the untreated control (V1P0) averaged 2.17 and 2.19, which were significantly lower than in the treated varieties. The highest LAI was observed with 90-100 kg P ha-1 (V1P5), reaching values of 4.81 and 4.82, demonstrating an impressive increase of 121.4% from the control. The application of 80 kg P ha-1 (V1P5) also showed a substantial increase, achieving 4.78 to 4.80 (approximately 120.6% increase). In contrast, the lowest LAI of 2.15 was recorded for V3P0, which was similar to that of untreated controls. Galaxy-13 and FSD-2008 exhibited the highest LAI values among varieties, with Galaxy-13 showing an increase of 119.9% with optimal phosphorus application. The Leaf Area Duration (LAD) analysis indicated a clear trend in response to phosphorus levels (Fig. 1). The control (V1P0) had 92-95 days of LAD. The 90-100 kg P ha-1 (V1P5) treatment led to a 116.8% increase in LAD to 203 days. LAD achieved 198 days (a 113.0% increase) with 80 kg P ha-1 (V1P4). The interaction effect revealed that Galaxy-13 and FSD-2008 had the highest LAD values when treated with 90-100 kg P ha-1. Borlaug-16 showed the least LAD, emphasizing the importance of phosphorus for sustaining leaf area duration. Data related to Crop Growth Rate (CGR) exhibited significant variability with phosphorus application. Control treatments showed CGR values between 7.81 and 7.85 g m-1 day-1. Maximum CGR was observed with 90-100 kg P ha-1 (V1P5), achieving values of 17.35 to 17.37 g m-2 day-1, a striking increase of 121.2% from the control. The application of 80 kg P ha-1 (V1P4) also enhanced CGR to 17.30 g m-2 day-1, representing a 119.7% increase. Galaxy-13 and FSD-2008 outperformed other varieties, showcasing the effectiveness of phosphorus in enhancing growth rates. The Net Assimilation Rate (NAR) data indicated that phosphorus application significantly influenced assimilation capacity. The control (V1P0) had NAR values ranging from 4.13 to 4.14 g m-2 day-1. In contrast, with optimal phosphorus application (V1P5), NAR increased to 9.19 and 9.20 g m-2 day-1, indicating a 122.5% increase. Similarly, 80 kg P ha-1 (V1P5) resulted in NAR values of 9.16 g m-2 day-1, reflecting a 121.0% increase. Notably, Galaxy-13 and FSD-2008 maintained the highest NAR values, confirming the positive correlation between phosphorus levels and assimilation rates. Total Dry Matter (TDM) measurements further corroborated the beneficial effects of phosphorus on wheat growth. Control treatments (V1P0) yielded TDM values of 1124 to 1129 g m-2. However, with 90-100 kg P ha-1 (V1P5), TDM significantly increased to 1791 and 1800 g m-2, marking an impressive increase of 58.8% from the control. The application of 80 kg P ha-1 (V1P4) resulted in TDM values of 1770 to 1778 g m-2, representing a 57.6% increase. Again, Galaxy-13 and FSD-2008 emerged as the top performers, demonstrating superior growth under optimal phosphorus conditions.
Yield Attributes
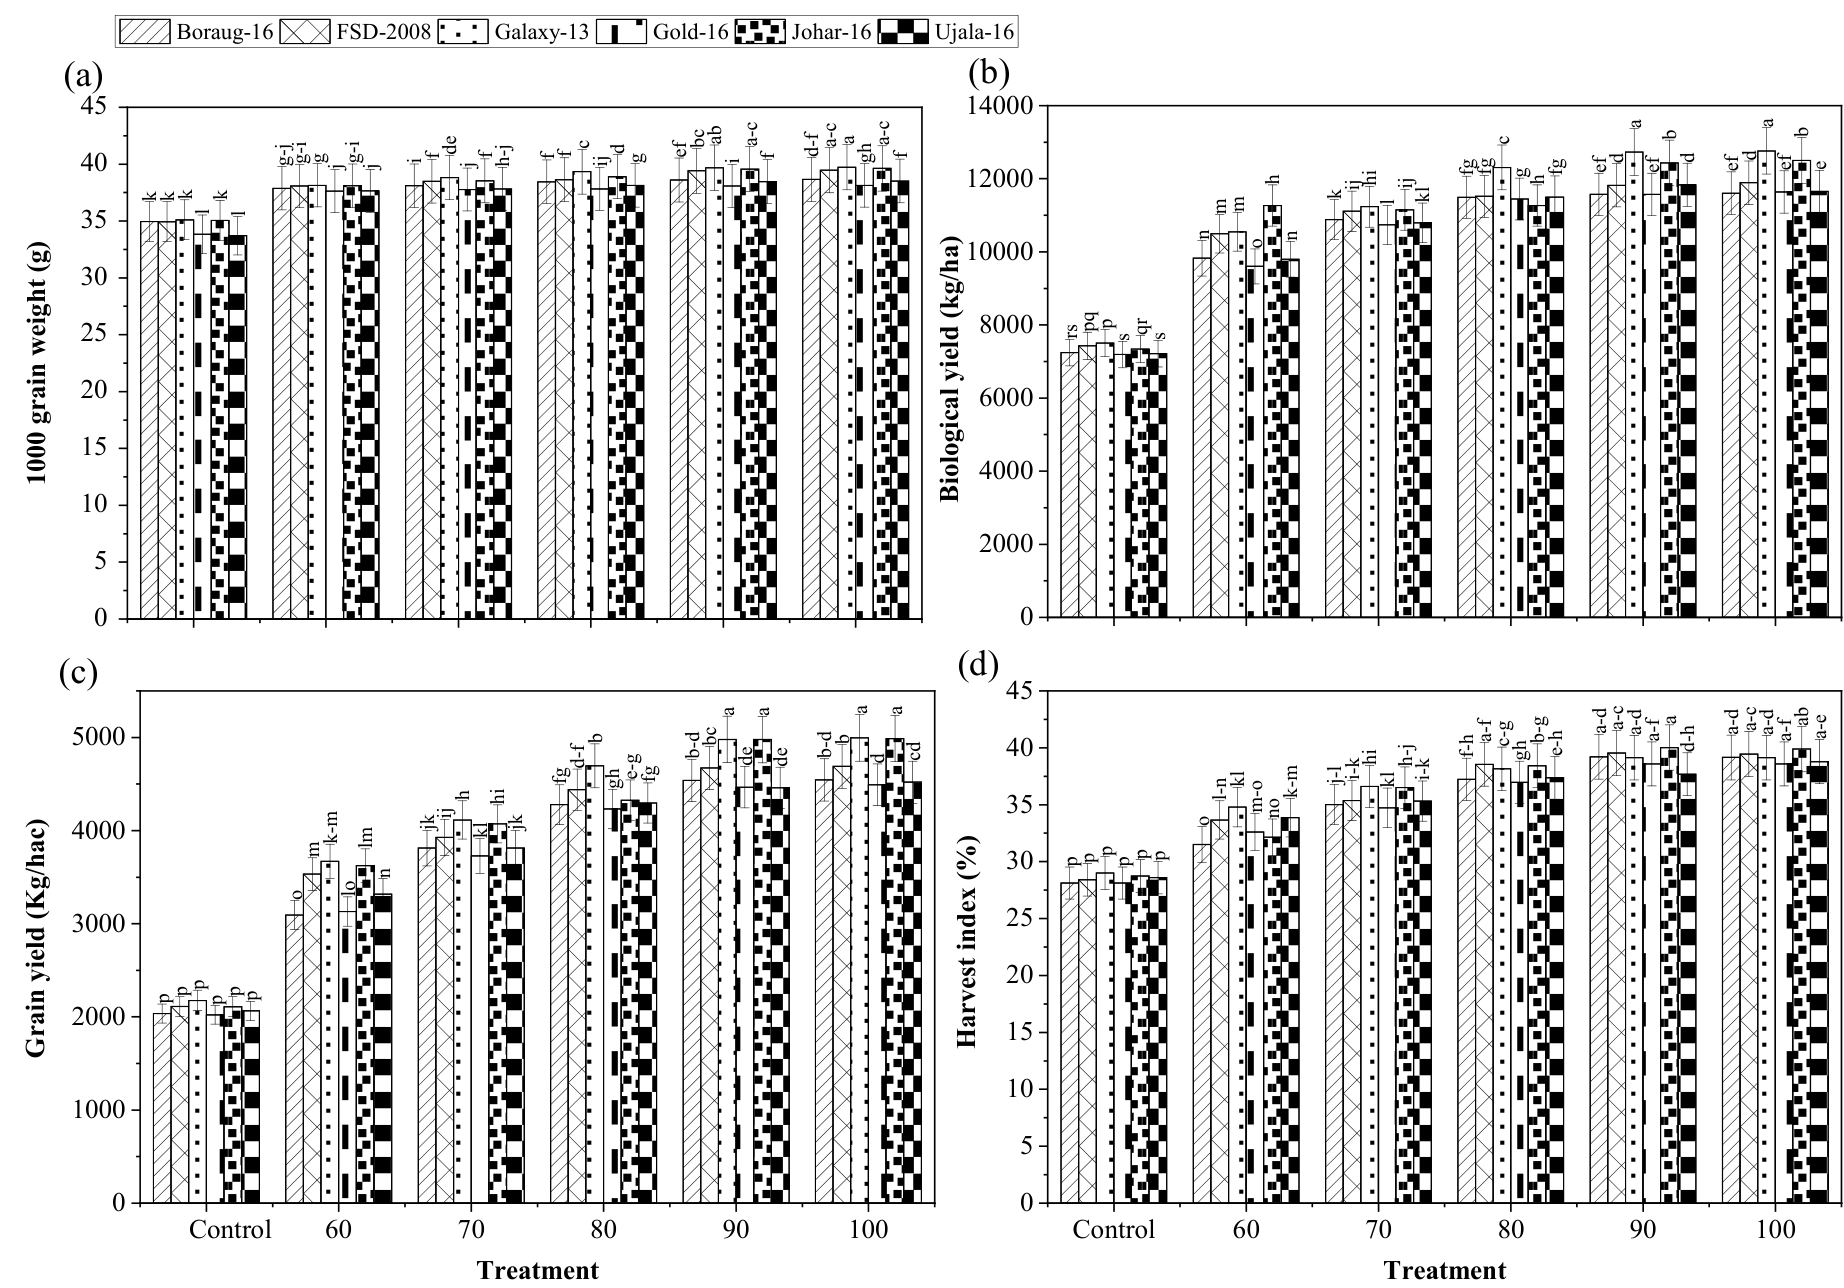
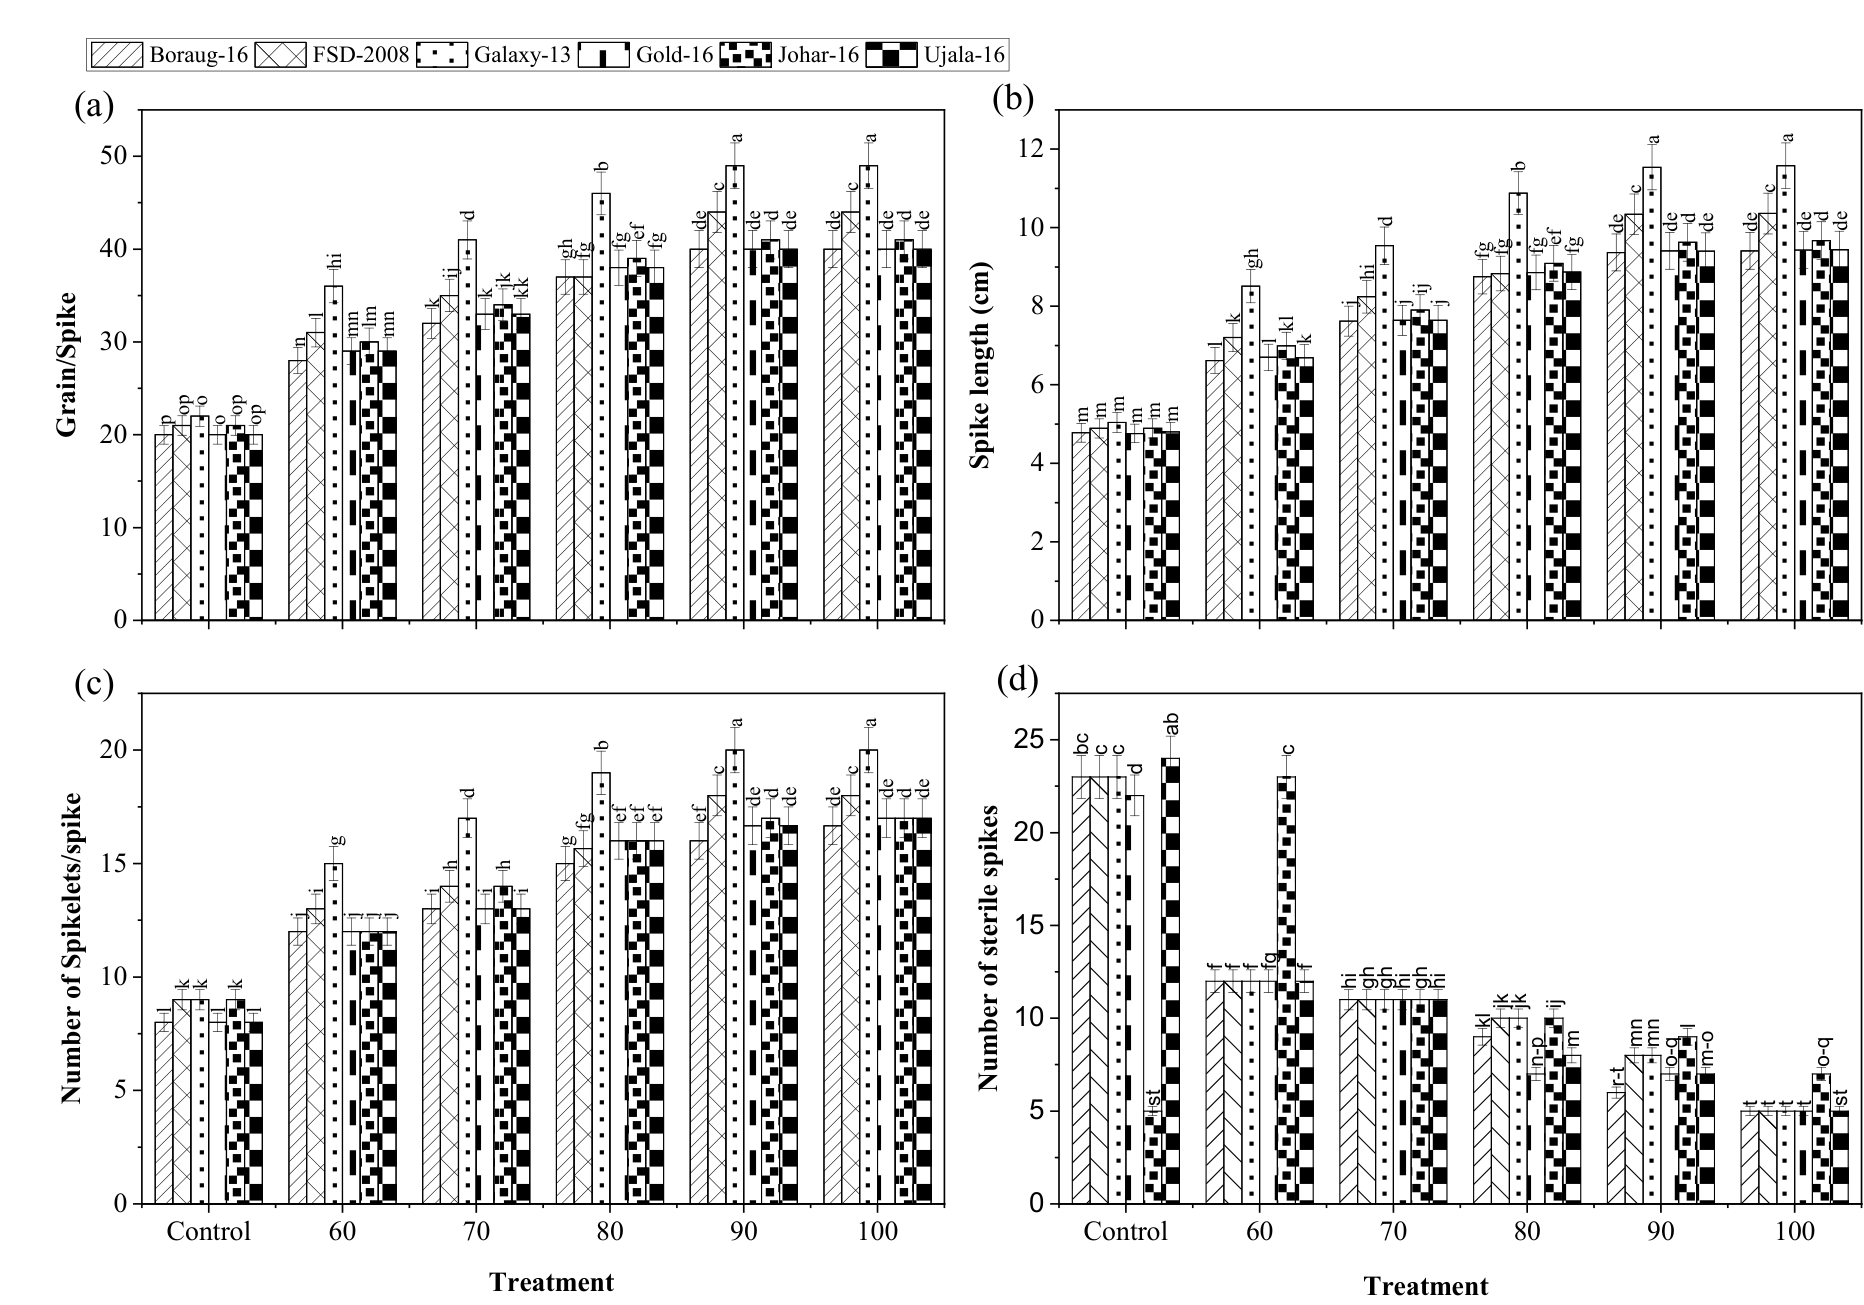
The effect of phosphorus application on wheat varieties’ plant height at maturity (cm), number of fertile tillers (m-2), spike length (cm), number of spikelets per spike, and number of grains per spike varied significantly. Significant was 1000 grains weight (g), Grain yield (kg ha-1), Straw Yield, Biological Yield, and Harvest Index (%) (Fig. 2). The study found that the provision of 100 kg P ha-1 of phosphorus fertilizer significantly improved wheat growth and yield compared to the control treatment (no phosphorus). Among the cultivars assessed, Galaxy-13 exhibited the tallest plants, reaching a remarkable height increase of 87.5 cm when fertilized with 100 kg P ha-1. This height represents a significant 37.5% increase compared to the control group, which had a plant height of 63.5 cm. This growth response highlights Galaxy-13’s superior ability to utilize phosphorus effectively, which is likely contributing to its overall performance. In contrast, Borlaug-16 displayed the shortest height at 70.0 cm in the control treatment, indicating its lower growth potential without phosphorus. The number of spikelets per spike is an important determinant of wheat yield potential. Galaxy-13 not only reached the highest spikelet count of 23.0 at the maximum phosphorus level but also exhibited a notable 42.86% increase from the control, which had only 16.1 spikelets. This increase reveals that Galaxy-13 may be able to build its reproductive structures whenever it is well supplied with phosphorus, which likely enables it to harvest more grains. In contrast, Ujala-16 produced the lowest number of spikelets, 18.0, when supplied with the lowest phosphorus level of 60 kg P ha-1, and it can be assumed that Ujala-16 may not be able to respond as well as the other cultivars of maize due to phosphorus fertilization. In addition, it was Galaxy-13 that maximized the length of the spikes one more time as it measured 12.6 cm, which is 57.14% better than the control in the measurement of spike length. The ability to produce longer spikes means more grains can be accommodated, increasing yield potential. On the other hand, Borlaug-16 showed the shortest spike length of 8.0 cm, suggesting its limitation in grain formation under P-deficient conditions. Similarly, regarding grain production, Galaxy-13 spikes were also stressed, with the highest number of grains at the top phosphorus level, with 48.0 grains per spike, showing a remarkable increase of 66.67% over the control’s 30.0 grains. This remarkable increase points to the fact that resources are converted into yield with the greatest efficiency by Galaxy-13. On the other hand, the control treatment of Ujala-16 produced the lowest grain number at 28.0. This indicates a possible restraint in its reproductive capacity without phosphorus. The capability of producing tillers is a key factor for wheat cultivars, as it increases the density and yield of the plants in general. Here, too, Galaxy-13 was at the top, reporting 12.5 tillers m-2 at 100 kg P ha-1, which is an increase of 80% over the control of 7.0 m². This improved tillage capacity suggests a good substantive response to phosphorus, suggesting that this possibly improves all biomass and yield. On the contrary, Ujala-16, which is lower in competitiveness, had the least tillers with 9.0 per m2 grown under lower phosphorus (60 kg P ha-1). A very important parameter that has been established to often relate to yield is the 1000-grain weight. Under maximum phosphorus application, Galaxy-13 reached a maximum weight of 45.0 g, which is 42.86% greater than the control’s weight of 31.5 g. This further improvement not only increases the total yield but also assists in improving grain quality. At the opposite end, Ujala-16 had its 1000-grain weight devalued by 30.0 g where control was concerned, establishing fragility in its nutrient uptake and grain-filling capacity. The most important aspect of concern is the grain yield for wheat production. With 100 kg P ha-1, Galaxy-13 gave an astounding yield of 4000 kg ha-1, which is 75% more than the control (2286 kg ha-1). Galaxy-13 performed well at optimal phosphorus conditions, which is expected. On the other hand, Borlaug-16 had its lowest yield of grains (2000 kg ha-1) and 60 kg P ha-1, indicating insufficient natural resource conversion. Based on the study, the Grain Harvest Index was highest in Galaxy-13 at 44.0%, with 100 kg P ha-1 as an input. The improvement was 66.67% from the control (26.4%). This suggests that Galaxy-13 biomass is converted into grains efficiently. On the contrary, Borlaug-16 in the control unit had a low harvest index (30.0%), implying resource waste as far as yield is concerned. The total biomass produced by plants and yield is vital to understanding productivity. Galaxy-13 produced 7200 kg ha-1 per ha with a 100 kg ha-1 input, a 60% increase from the control (4500 kg ha-1). This result emphasizes its overall growth potential and the importance of phosphorus for enhancing biomass. On the other hand, Ujala-16 showed the lowest biological yield of 4200 kg ha-1 in the control treatment, further proving its shortcomings in a low-nutrient environment.
Nutritional Quality
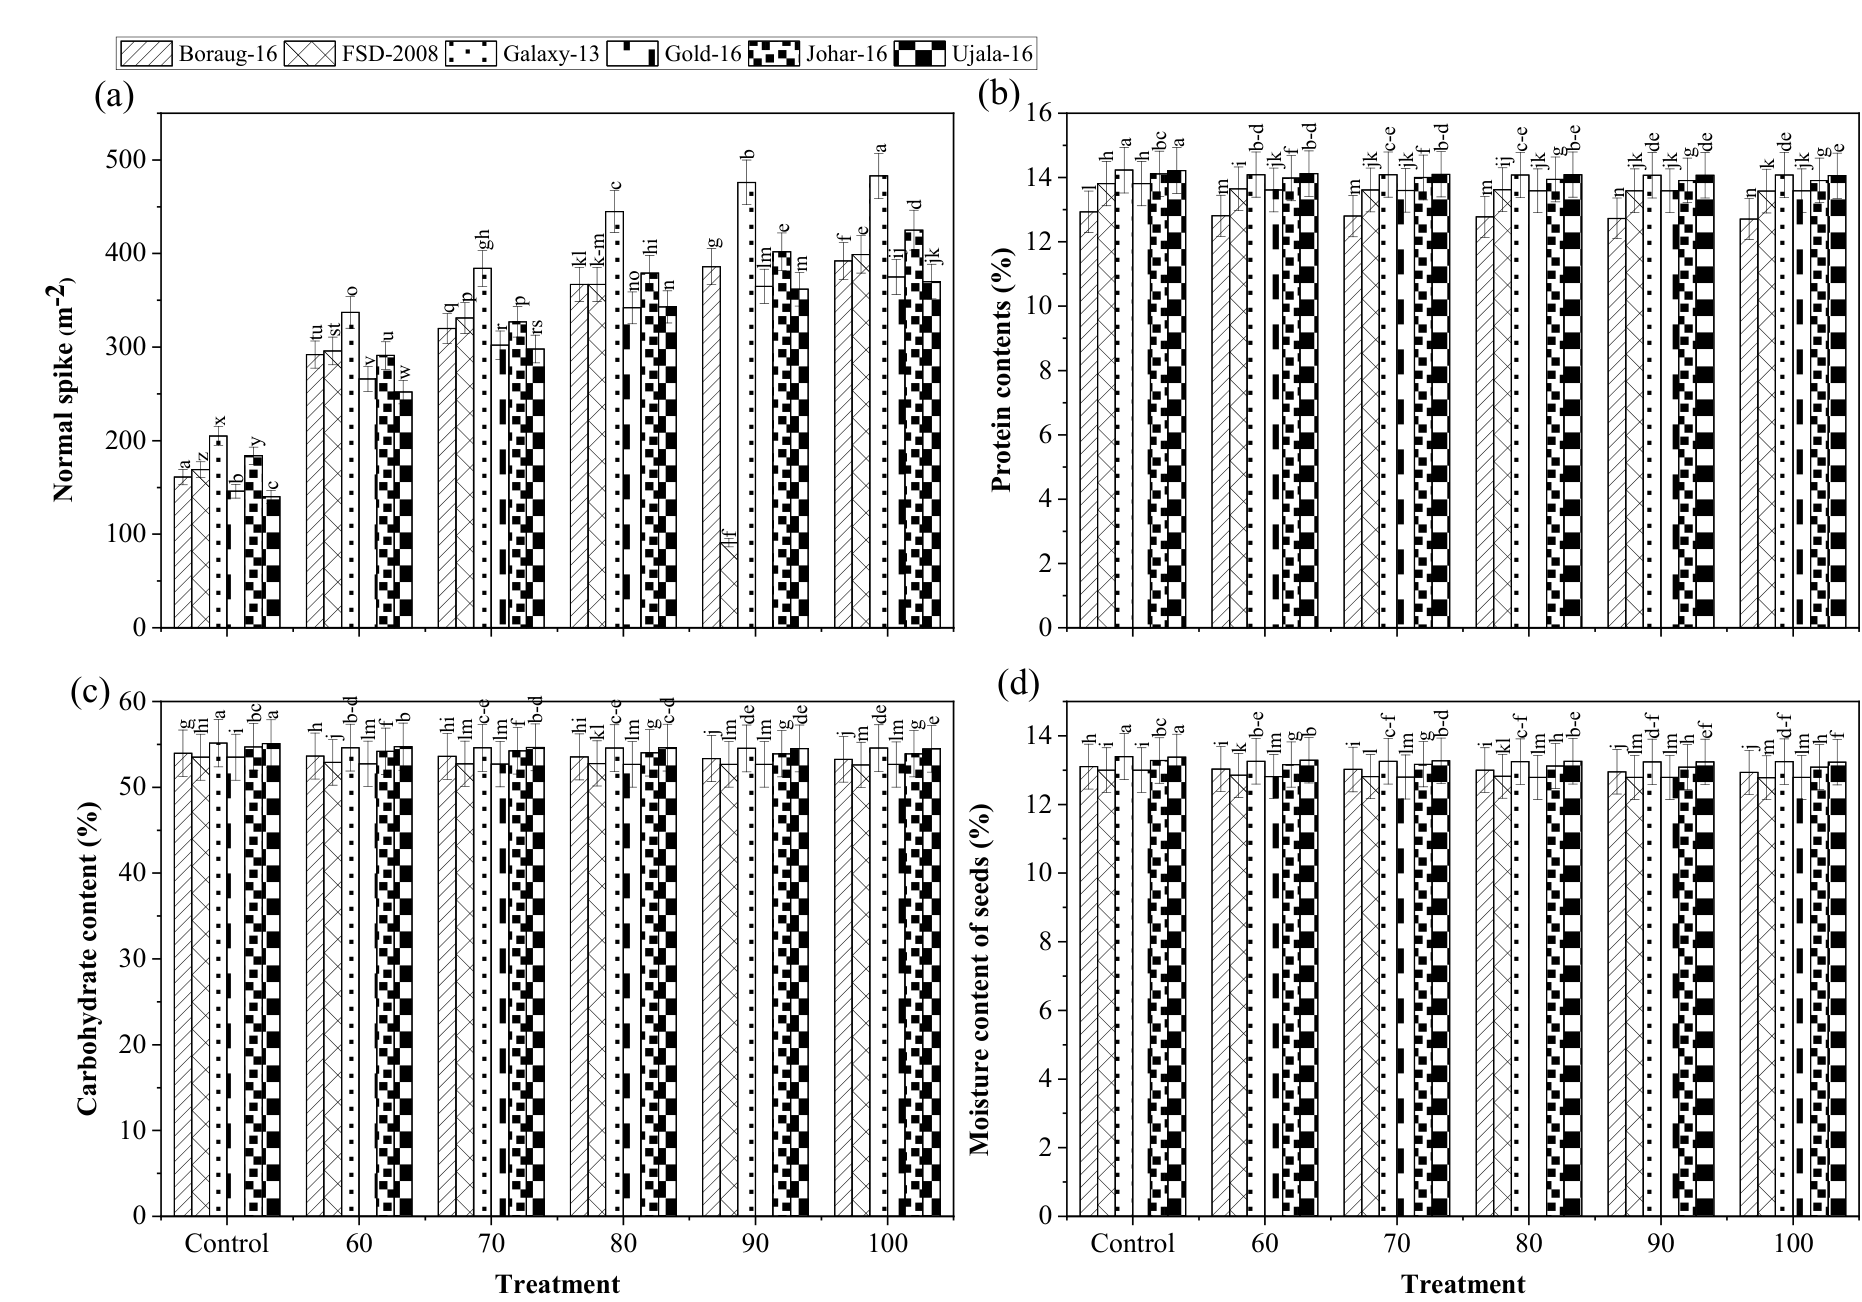
The normal spike density analysis revealed significant variability among the wheat cultivars across different phosphorus levels (Fig. 3). At the control level (no phosphorus), FSD-2008 exhibited the highest spike density of 205 spikes m-2, while Gold-16 had the lowest at 146 spikes m-2. With increasing phosphorus levels, all cultivars showed marked increases in spike density. Notably, at 100 kg P ha-1, Galaxy-13 achieved the highest spike density of 483 spikes m², representing a substantial increase from the control. However, when considering the relative performance of Borlaug-16, it had 392 spikes m-2. It had the highest phosphorus level but still had the lowest density of spikes compared to the other cultivars. Observations on sterile spikes suggest the reproductive capacity of the respective variety. At the control level of phosphorus, Ujala-16 was found to produce the highest number of 24 sterile spikes m-2, while Gold-16 had the lowest at 22 spikes m-2. With increased phosphorus concentration in the soil, however, all cultivars witnessed a decline in the number of sterile spikes, suggesting an increase in fertility. With a phosphorus supply of 100 kg P ha-1, the least sterile spikes were observed on Borlaug-16, FSD-2008, Galaxy-13, and Gold-16, all having 5 spikes m-2, suggesting the effect of adequate phosphorus supply on their reproductive success. Of many indicators of grain quality, protein content sets the grain quality apart as it varies across cultivars and phosphorus levels (Fig. 4). Among the control treatments, FSD-2008 performed the best in protein content at 14.23%, while the in-trial Borlaug-16 contained the lowest figure at 12.93%. On the whole, protein content did not change much with increasing phosphorus levels in the soil. Galaxy-13 retained a high protein percentage, and a protein percentage of 14.08 was recorded at a P level of 100 kg ha-1. On the contrary, the protein content of Borlaug-16 went down slightly at the bottom when phosphorus supplies increased, suggesting that the protein synthesis rate slowed. The carbohydrate percentage was significantly highest in Galaxy-13, which exhibited 55.14% of carbohydrates in the control treatment. As phosphorus levels increased, however, most cultivars experienced slight fluctuations in their carbohydrate content, remaining fairly stable. At the highest phosphorus level, both FSD-2008 and Galaxy-13 showed similar carbohydrate percentages of 54.56% and 54.57%, respectively, indicating efficient phosphorus utilization for carbohydrate synthesis. However, Borlaug-16 consistently showed lower carbohydrate levels, indicating its reduced capacity for carbohydrate production. Moisture content is essential for understanding seed quality and storage potential. In the control treatment, FSD-2008 and Johar-16 displayed the lowest moisture content at 13.39% and 13.0%, respectively, while Ujala-16 had higher moisture levels at 13.38%. As phosphorus levels increased, moisture content decreased across all cultivars, suggesting that phosphorus may enhance seed maturity. At the highest phosphorus level (100 kg P ha-1), moisture content varied minimally, with Borlaug-16 showing 12.93% and FSD-2008 recording 12.78%, indicating that all cultivars benefited from phosphorus in terms of reducing seed moisture levels. Galaxy-13 consistently outperformed other cultivars across multiple parameters, particularly in spike density and protein content at higher phosphorus levels. In contrast, Borlaug-16 and Ujala-16 exhibited lower performance metrics, especially in terms of carbohydrate accumulation and spike density.
Discussion
The findings of this research showed that the wheat crop sown in 2019 produced a maximum number of tillers, longer spikes, a greater number of spikelets per spike, a higher 1000-grain weight, a smaller number of sterile spikes, a higher biological yield, and a final grain yield with a better harvest index as compared to wheat planted on 10th December 2019. However, the grains’ protein and carbohydrate content was higher in late-sown wheat than in early-sown wheat. The increase in yield and yield-related parameters in wheat might be because early sown wheat used resources such as pre-winter light, moisture, and nutrients to develop strong seedlings, subsequently promoting yield formation [37]. Sowing at the appropriate time seems to increase the effective temperature accumulation for better wheat growth during winter and increase the accumulation of nutrients [38]. The delay in sowing tended to decrease the oncoming heading and flowering stage and shorten the duration of the grain filling stage, which caused less dry matter mobilization efficiency and reduced biomass and grain yield [39]. Our results showed that grain protein and carbohydrates were low in early and medium-sown wheat, while late-sown wheat had a higher percentage of grain protein and carbohydrates. The lower percentage of protein and carbohydrates in early sown wheat might be due to dilution factors or gentleness [40]. Previous studies showed that early sowing significantly decreased nutrient accumulation and translocation before anthesis [41]. The contribution rate of nutrients to the grain after anthesis was decreased at early and medium sowing, whereas the contribution rate of nutrient accumulation for grain was significantly improved by late sowing at post-anthesis. This may be because late sowing increases the proportion of nutrient translocation from the glume + spike to grain and improves the ability of the plant to use already absorbed N for grain production [42]. The sowing date also has a significant effect on the yield response of wheat [43]. Sowing time influences the accumulating temperature before winter, affects the nutrient uptake and transportation of plants, and ultimately affects the yield [44]. Sowing date strongly influences the use of environmental resources, and optimal sowing can make full use of resources such as pre-winter light, heat, nutrients, and water to develop strong seedlings and promote yield formation [45]. Under irrigation, the sowing time can be adjusted, whereas, in rain-fed dryland farming, the sowing time might be delayed due to the scarcity of residual soil moisture under erratic rain conditions [46]. Suitable sowing is the main measure to match the growth and development of wheat and the local climate, which is conducive to achieving a stable yield [47]. This experiment showed that delaying the sowing time for 10 days reduces the accumulated growing degree days before winter by about 180°C [48]. Other studies have shown that with the delay of the sowing date, the accumulated temperature in winter was reduced, which significantly affected wheat growth before winter and decreased the number of tillers. The potential of a cultivar is mainly associated with appropriate sowing time, nutrient management, protection measures, and plant density that directly affect soil moisture extraction, light interception, humidity, and wind movement [49]. The optimum sowing date gives enough time for the crop to complete its vegetative and reproductive cycles in a timely and efficient way. Appropriate sowing time allows the farmers to harvest the crop quickly and sow subsequent crops at the right time, saving them from the risk of insect pests [50]. The main purpose of optimum sowing time is to overcome the cold shock and to decrease heat stress incidence to ensure that fruits or bolls have enough time to mature with good quality and optimum seed cotton yield [51]. Hence, early sown crop intercepts more photosynthetically active radiation and soil nutrients and develops an appropriate canopy with improved leaf area [52]. Due to more interception of photosynthetically active radiation, the plant develops total dry matter production. Plant phenological events directly or indirectly affect plant yield and yield components. Thus, optimum sowing time is essential to boost cotton productivity in the face of changing climate conditions. Optimum sowing dates ensure a more economic yield and harvest index [53]. Several researchers agree that late planting usually results in reduced yields due to a shortened growing period and delayed maturity relative to normal planting. Delayed planting results in poor and erratic seedling emergence and crown root initiation due to low temperatures prevailing [54]. This late-sown crop matures a bit later during the season, and the prevailing high temperature at the reproductive stage decreases the number of grains in spikes and causes poor grain filling, resulting in shriveled grains, diminished mean grain mass, 1000-grain weight, and finally, grain yield [55]. As a result of high temperatures, grains become small and lightweight [56]. These lightweight and small grains have less vigor and viability than bold grains, and yield penalties occur when small grains are sown because they contain fewer food reserves and less energy for emergence [57].
Phosphorus plays an important role in various cellular processes, including maintenance of membrane structures, synthesis of biomolecules, and formation of high-energy molecules. It also helps cell division, enzyme activation/inactivation, and carbohydrate metabolism [58]. Our results showed that phosphorus application increased wheat yield and yield-related parameters compared to the control treatment. However, 100 kg P ha-1 showed greater improvement in wheat yield. The improvement in yield and yield-related parameters might be due to the optimum dose of phosphorus, which increased the vigor and growth of wheat, resulting in a greater number of tillers, longer spikes, a greater number of spikelets, and 1000-grain weight that ended in higher grain yield. At the whole plant level, it stimulates seed germination, the development of roots, stalk, and stem strength, flower and seed formation, crop yield, and quality. In addition, the availability of P increases the N-fixing capacity of leguminous plants. Hence, P is essential at all developmental stages, from germination to maturity [59]. P increases the photosynthesis rate and helps plants with energy storage and cell division [60]. P is also essential for cellular respiration and the metabolism of starch and fats [61]. P increases seed formation and improves the quality of grains by improving uniform heading and faster maturity. Without enough available P in the soil, plants will show P deficiencies. In wheat, P-deficient plants show stunted growth and lower yield. Wheat plants’ stems and leaves in P-deficient soils turn purple, showing a reduced root system and poor tillering [62]. When a deficiency is present, winter wheat is more susceptible to winterkill and vulnerable to disease pressure, among other plant health issues. To avoid these problems in fields, P fertilizer needs to be applied before or during planting [63]. The amount of P needed in a field is determined through soil testing, and the rate may be adjusted depending on the application method, planting dates, and crop rotation [64]. P fertilizer application is very important for wheat production. Soils of Pakistan are alkaline (pH>7.0) and mostly calcareous (CaCO3>3.01%) in nature [65]. When phosphatic fertilizers are added, part of it goes into the soil solution and is taken up by plants, while the rest goes to exchange sites and is either adsorbed or precipitated. Soil solution P is an immediate source for plant P uptake [66]. Plants deprived of P undergo various morphological, physiological, and biochemical adaptations, such as the formation of cluster roots, shoot development, organic acid exudation, and alternative glycolytic and respiratory pathways [67].
Conclusions
The results of this study underscore the crucial role of phosphorus application in enhancing wheat growth, yield, and quality, especially in semi-arid environments. Among the evaluated cultivars, Galaxy-13 consistently outperformed the others, attaining the highest plant height measurements, tiller count, spike length, grain yield, and harvest index, particularly at phosphorus levels of 90-100 kg ha-1. Johar-16 and FSD-2008 also displayed promising growth and yield characteristics, making them suitable for semi-arid regions. Generally, higher phosphorus levels improved yield-related attributes across the cultivars, although this was associated with a decline in grain protein content, likely due to dilution effects. Moreover, Ujala-16 and Galaxy-13 showed greater grain carbohydrate and moisture content, while FSD-2008 had relatively lower values for these traits. Borlaug-16 recorded the lowest leaf area index, suggesting limited growth potential under the same phosphorus and moisture regimes. Overall, this study highlights the significance of optimized phosphorus management for sustainable wheat production in semi-arid areas, with Galaxy-13 standing out as a particularly adaptable and high-yielding cultivar. Future research should focus on refining phosphorus and moisture management strategies to further enhance wheat performance in various environmental conditions.

