

Introduction
As an important component of the carbon pool of terrestrial ecosystems, soil carbon stock is about 1400-1500 Pg, accounting for 65% of the total global terrestrial carbon pool [1-3]. Soil organic carbon (SOC) is an important component of soil organic matter (SOM), and small changes in its accumulation and decomposition will affect the CO2 content in the atmosphere, and then will affect the global carbon cycle [4, 5]. SOC is mainly composed of organic matter, such as humus synthesized by microorganisms and various plant and animal residues in the soil [6, 7], and it displays different spatial and temporal characteristics in the decomposition and accumulation processes affected by environmental and anthropogenic factors. Therefore, the study on SOC changes can help in deeply understanding and predicting the regional carbon cycle [8].
Currently, most studies on SOC have focused on agricultural, forest and grassland ecosystems [9, 10]. The high elevation and high latitude regions store the vast majority of carbon of the global terrestrial ecosystem and have high soil carbon content, so studies on the dynamics of soil carbon pool in these regions have been receiving more attention [11-14]. The high-elevation mountain is a magnifier of climate change, and its changes of SOC are influenced by climate factors [15, 16]. Climate change in high mountainous regions will alter the carbon sequestration potential, which would affect the global carbon cycle. Ahmad and Somaiah [17] found that SOC stocks appeared in an increasing trend with increasing altitude in temperate forests of the Himalayas; furthermore, further increases in atmospheric temperatures will lead to a reduction in organic carbon stocks in high-elevation forests. In the context of global warming, Nie et al. [18] found that warming of the Tibetan Plateau increased the carbon sink potential of alpine scrub in the northeastern region of Tibet. In mountain ecosystems, topography and slope orientation are important factors which produce differences in ecosystem characteristics [19, 20], that topography can shape spatial patterns and slope orientation can change small-scale hydrothermal conditions [21, 22]. The different hydrothermal conditions of different slope orientations lead to different rates of decomposition and accumulation of SOC, thus affecting the local SOC content [23].
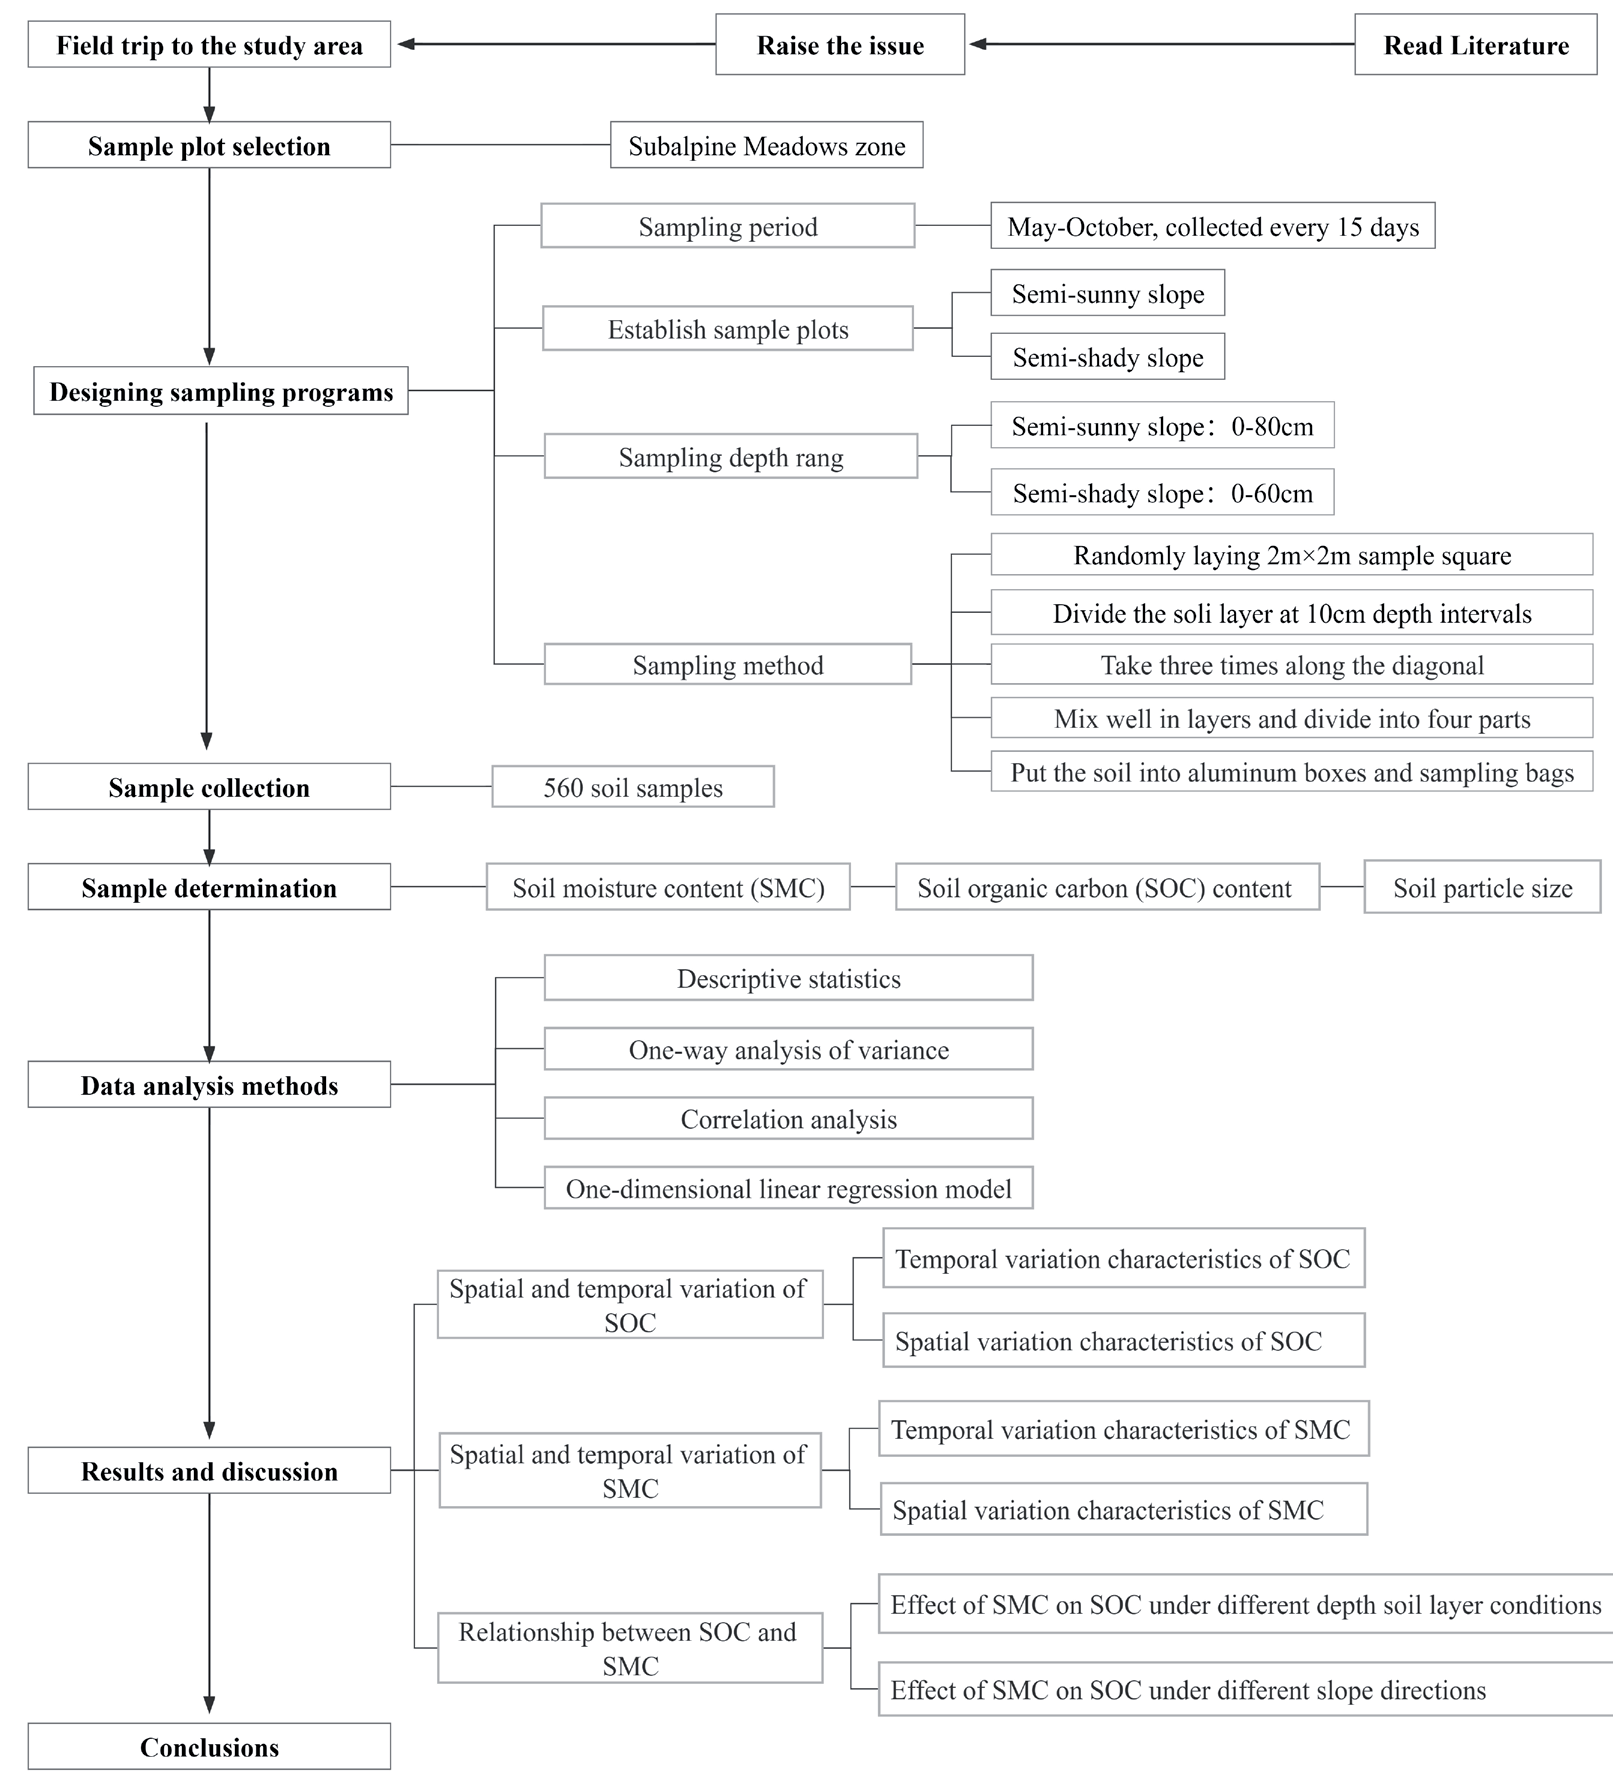
Located at the intersection of the Qinghai-Tibet Plateau, Inner Mongolia Plateau and Loess Plateau [24], the Qilian Mountains are an important ecological barrier in northwest China and play an important role in the ecological security and sustainable development of the Hexi Corridor oasis. As a typical alpine and semiarid mountainous region in northwest China [25], the Qilian Mountains have complex and diverse ecosystems. As one of the main components of the forest ecosystem in the Qilian Mountains, the subalpine scrub has an area of approximately 4.13 × 10⁵ hm2, accounting for 2/3 of the mountain woodland area. Some scholars have studied the SOC in the Qilian Mountains [20, 25, 26], but studies on the spatial and temporal changes and its influencing factors of SOC are relatively lacking. In this paper, we investigate the spatial and temporal changes and relationship between SOC and soil moisture on the semi-shady and semi-sunny slopes in subalpine meadows of the Qilian Mountains, aiming to clarify SOC content and the influence of soil moisture on SOC in this region, so as to provide a scientific basis for understanding the capacity of the carbon sink of subalpine meadow zone and its influencing factors in the context of global climate change. A framework diagram of the research process is shown in Fig. 1.
Material and Methods
Study Area
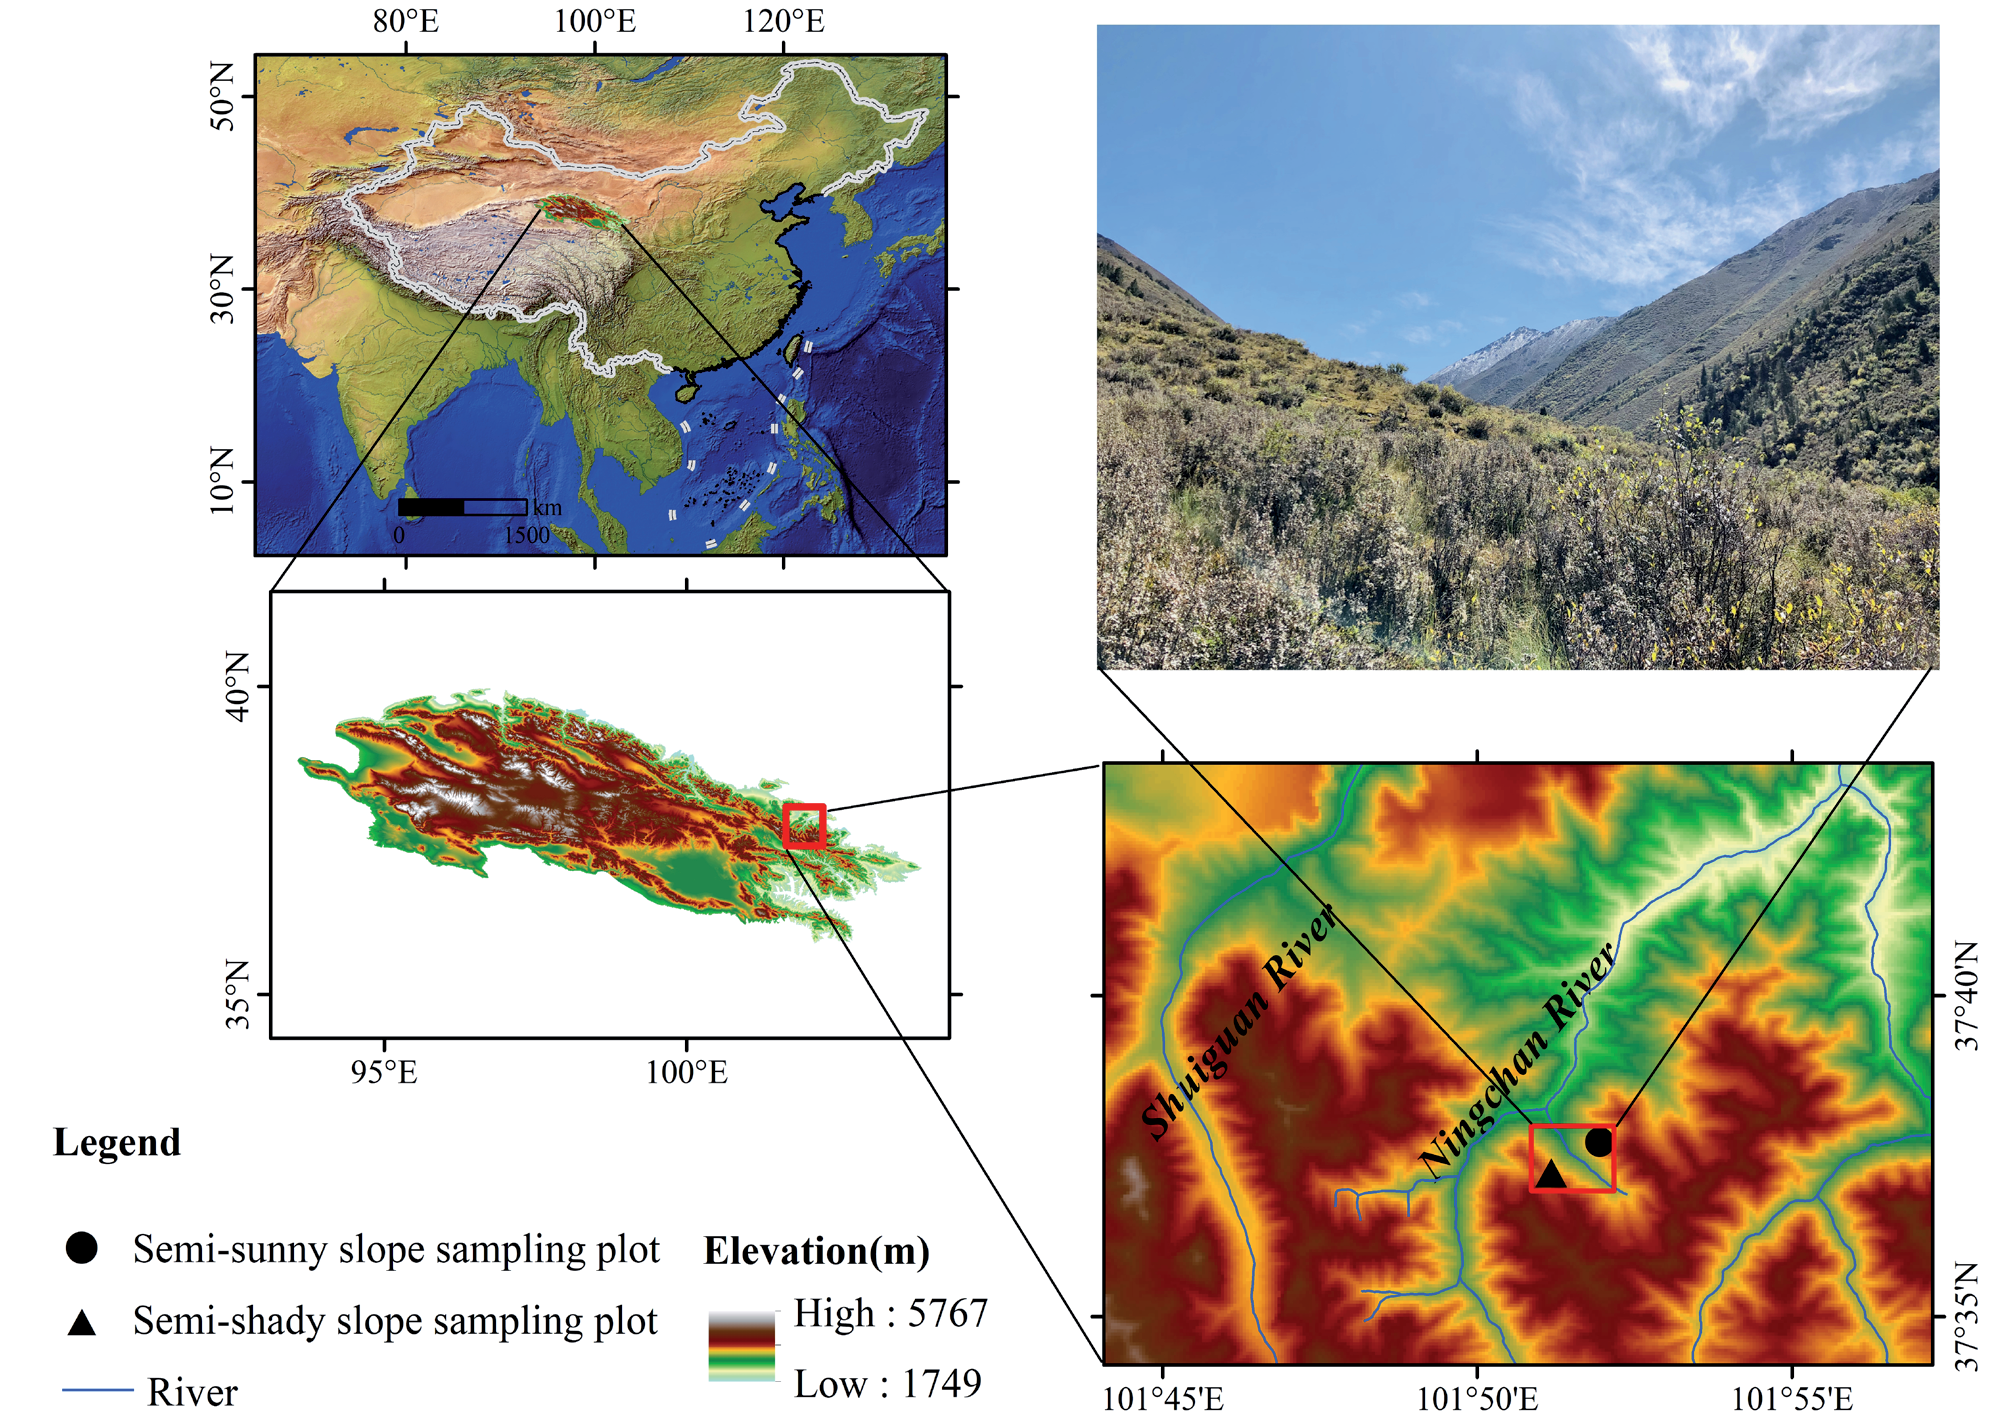
The Qilian Mountains (35°43′-39°36′N, 93°30′- 103°00′E) are located on the northeastern edge of the Qinghai-Tibet Plateau and in the inland arid region of Northwest China, with a length of about 1000 km and a width of about 300 km [27]. Belonging to the alpine and semi-arid climate zone, the Qilian Mountains have an average annual temperature below 6ºC and annual precipitation of about 400-600 mm [28], which mainly concentrates in June-September and increases with elevation [29]. Influenced by climate and topography, soil and vegetation types show clear vertical distribution in the Qilian Mountains. From low to high altitude, the soil types are mountain gray-calcium soil, mountain chestnut-calcium soil, mountain black-calcium soil, mountain gray-brown soil, subalpine scrub meadow soil, alpine meadow soil and skeletal soil, respectively [30], and the vegetation types are desert, mountain desert steppe, mountain steppe, mountain forest steppe, subalpine scrub meadow, alpine meadow and alpine talus vegetation, respectively[31, 32]. The study area is located in the subalpine zone, which is in the northern slope of Lenglongling in the eastern part of the Qilian Mountains and in the Shangchigou region of Ningchan River, which is a tributary of Shiyang River (37°38′10″N, 101°41′9″E, mean elevation 3080 m) (Fig. 2). The vegetation type is subalpine shrub meadow. The sampling site is in a seasonal-frozen soil zone, where organic matter residues are not easily decomposed under cold and wet climatic conditions. The soil type is subalpine meadow soil (Mat-Cryic Cambisol) with a thickness of about 40- 80 cm, which is defined as Cambisols according to the international WRB classification [33] and defined as Gelic Cambisols according to the secondary classification equivalent. The study area is affected by light grazing during seasonal pasture conversions.
Sampling Method
During the consecutive growing seasons from May to October 2019, two sample plots were established on the semi-sunny and semi-shady slopes in the study area (Fig. 2), where the distance of them did not exceed 1 km and the elevation of them did not exceed 10 m (elevation range 3077-3083 m). A sample square of 2 m × 2 m was laid randomly, and the diagonal sampling method was adopted at each sample plot. Each sample square was taken three times along the diagonal, and the soil was removed from plant roots and debris and mixed well in layers (evenly mixed soil was taken as a soil sample of that soil layer). Then the soil was divided into four parts, put into aluminum boxes (two parts) and sampling bags (two parts), sealed respectively, and brought back to the laboratory. Taking 10 cm as the sampling interval, the soil samples on the semi-sunny slope were collected from 0-10 cm, 10-20 cm, 20-30 cm, 30-40 cm, 40-50 cm, 50-60 cm, 60-70 cm and 70-80 cm, respectively, and those on the semi-shady slope were collected from 0-10 cm, 10-20 cm, 20-30 cm, 30-40 cm, 40-50 cm, 50-60 cm, respectively, so as to facilitate the comparative analysis between soil properties at different depths [20, 23]. To ensure the accuracy of the data, parallel samples were collected no more than 10 m from the sample plot according to the same method. A total of 560 soil samples were collected every 15 days throughout the growing season, of which 280 soil samples were used to determine the soil organic carbon content and 280 soil samples were used to determine the SOC.
Sample Determination
Soil samples were tested in the Soil Analysis Laboratory of the College of Geography and Environmental Science, Northwest Normal University. Soil moisture was determined by weighing the wet weight (Mw) of soil samples, then placing them in a constant temperature blast oven at 105ºC±2ºC for about 12 h until constant weight, and weighing the dry weight (Md) after drying and cooling. SOC content was determined by the potassium dichromate oxidation method. In addition, the soil particle size was determined using a laser particle size meter Mastersizer 3000 (Malvern, UK), which has a measurement range of 0.02-2000 μm, and the test results were output with an International Textural Classification (Clay (<0.002 mm), Silt (0.002-0.02 mm), Sand (0.02-2 mm)).
Research Methods
Soil moisture content (SMC) is calculated as:
Where Mw indicates the weight of the aluminum box with wet soil; Md indicates the weight of the aluminum box with dry soil; M0 indicates the weight of the aluminum box.
Soil organic carbon (SOC) is calculated as:
Where SOC indicates the soil organic carbon content (g/kg); V0 indicates the volume of ferrous sulfate consumed by the two blanks; V indicates the volume of ferrous sulfate consumed by each specimen; M indicates the mass of the specimen; C2 indicates the concentration of ferrous sulfate standard solution; V1 indicates the volume of ferrous sulfate consumed.
One-way analysis of variance (ANOVA) combined with post-hoc Tukey least significant difference (LSD) test was used to analyze significant differences in SOC and SMC at different soil layer depths and at different months. One-way ANOVA was used to analyze the results of one-way experiments and to check if there was a significant effect of the factor on the results. Post-hoc Tukey’s Least Significant Difference (LSD) test was used to compare the differences between different data.
In order to understand the covariation trend between SOC and SMC, correlation analysis was used to determine the association between them. Pearson correlation analysis was performed using SPSS 23.0 software, and the correlation coefficient r was calculated as:
where n is the number of samples, and xi and yi are the variable values respectively.
In order to assess the effect of SMC on SOC, a one-dimensional linear regression model was used to establish a mathematical relationship between SMC (independent variable) and SOC (dependent variable).
Correlation analysis can help to find out whether there is some kind of pattern or trend between the variables and the strength and direction of the pattern or trend. Regression analysis can help to find out whether there is some kind of causal relationship between the independent and dependent variables, as well as the form and parameters of the causal relationship. The higher the correlation coefficient is, the closer the actual value is to the predicted value of the linear equation.
Results and Discussion
Spatial and Temporal Variation of SOC
Temporal Variation Characteristics of SOC
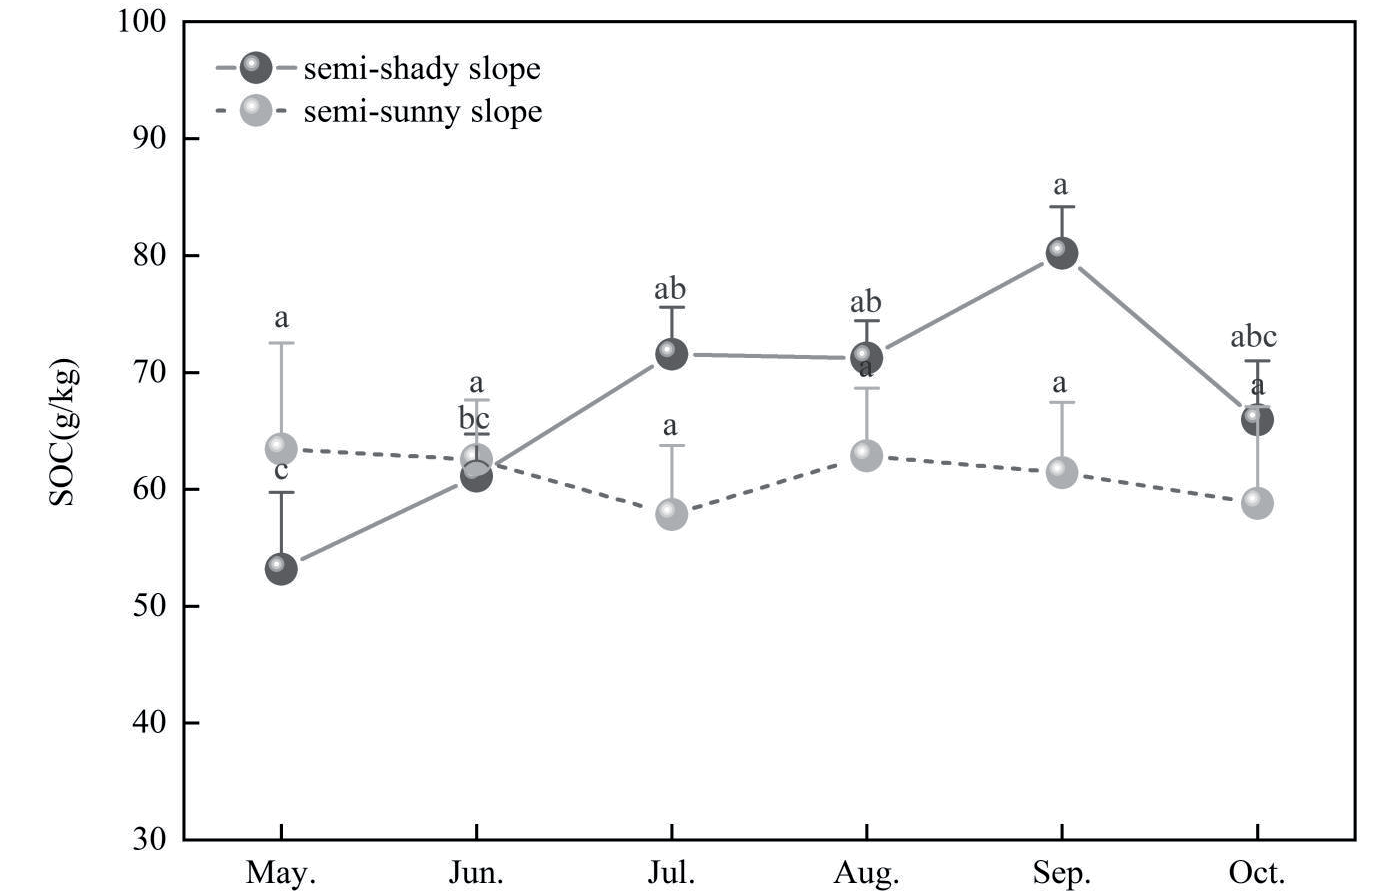
During the sampling period, the SOC content of the semi-shady slope ranged from 38.88 g/kg to 105.15 g/kg, and those of the semi-sunny slope ranged from 19.63 g/kg to 100.09 g/kg, of which the former was greater than the latter. The average SOC content was 68.73 g/kg on the semi-shady slope and 61.15 g/kg on the semi-sunny slope, which were both higher than the average (35.74 g/kg) measured by Zhou et al. [34] in Xiying River basin in the eastern part of the Qilian Mountains.
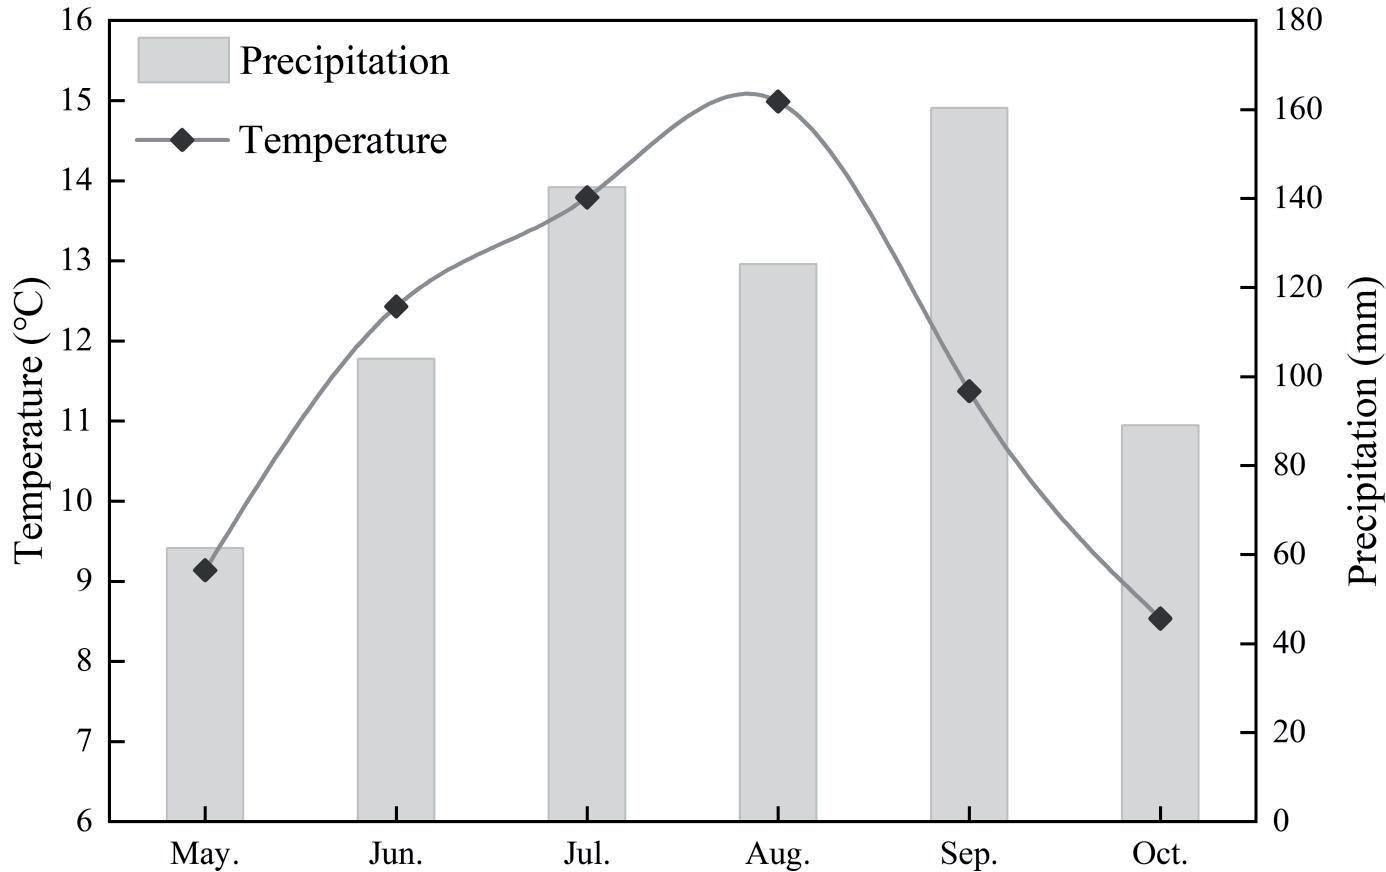
Fig. 3 shows the variation of monthly mean values of SOC, and Fig. 4 shows the monthly variation of temperature and precipitation in the study area. It can be seen from Fig. 3 that SOC content showed an “increasing (May-September) - decreasing (September-October)” trend on the semi-shady slope throughout the growing season, while that showed a “decreasing (May-July) - increasing (July-August) - decreasing (August-October)” trend on the semi-sunny slope. Among them, the SOC content of the semi-shady slope reached the maximum value of 80.20 g/kg in September and the minimum value of 53.17 g/kg in May, but that of the semi-sunny slope reached the maximum value of 63.43 g/kg in May and the minimum value of 57.84 g/kg in July. The SOC content of the semi-shady slope was significantly higher in September than in May-June (p<0.01) and significantly lower in May than in July-September (p<0.01), but that of the semi-sunny slope did not differ significantly among months.
On the temporal scale, some differences appeared on SOC content of different slope directions in the same month. Compared to the semi-sunny slope, the SOC content of the semi-shady slope was lower in May-June but was significantly higher in July-October. Climate is an important factor in determining vegetation type and organic carbon input, in which temperature and precipitation affect the decomposition rate of soil organic matter, SMC and soil aeration, which in turn affect soil respiration and determine organic carbon input [35, 36]. In May-June when the temperature picked up and the precipitation was low, the temperature of the semi-shady slope was lower than that of the semi-sunny slope, which resulted in a slow accumulation of soil organic matter and made the SOC content lower on the semi-shady slope than on the semi-sunny slope. In July-October when precipitation was more concentrated and soil respiration was enhanced, the temperature of the semi-sunny slope was higher than that of the semi-shady slope, which accelerated the decomposition of soil organic matter and made the SOC content lower on the semi-sunny slope than on the semi-shady slope.
Fig. 3.
Temporal change of SOC in different slope directions (Data represent mean and standard error, different letters under the same type indicate significant differences).
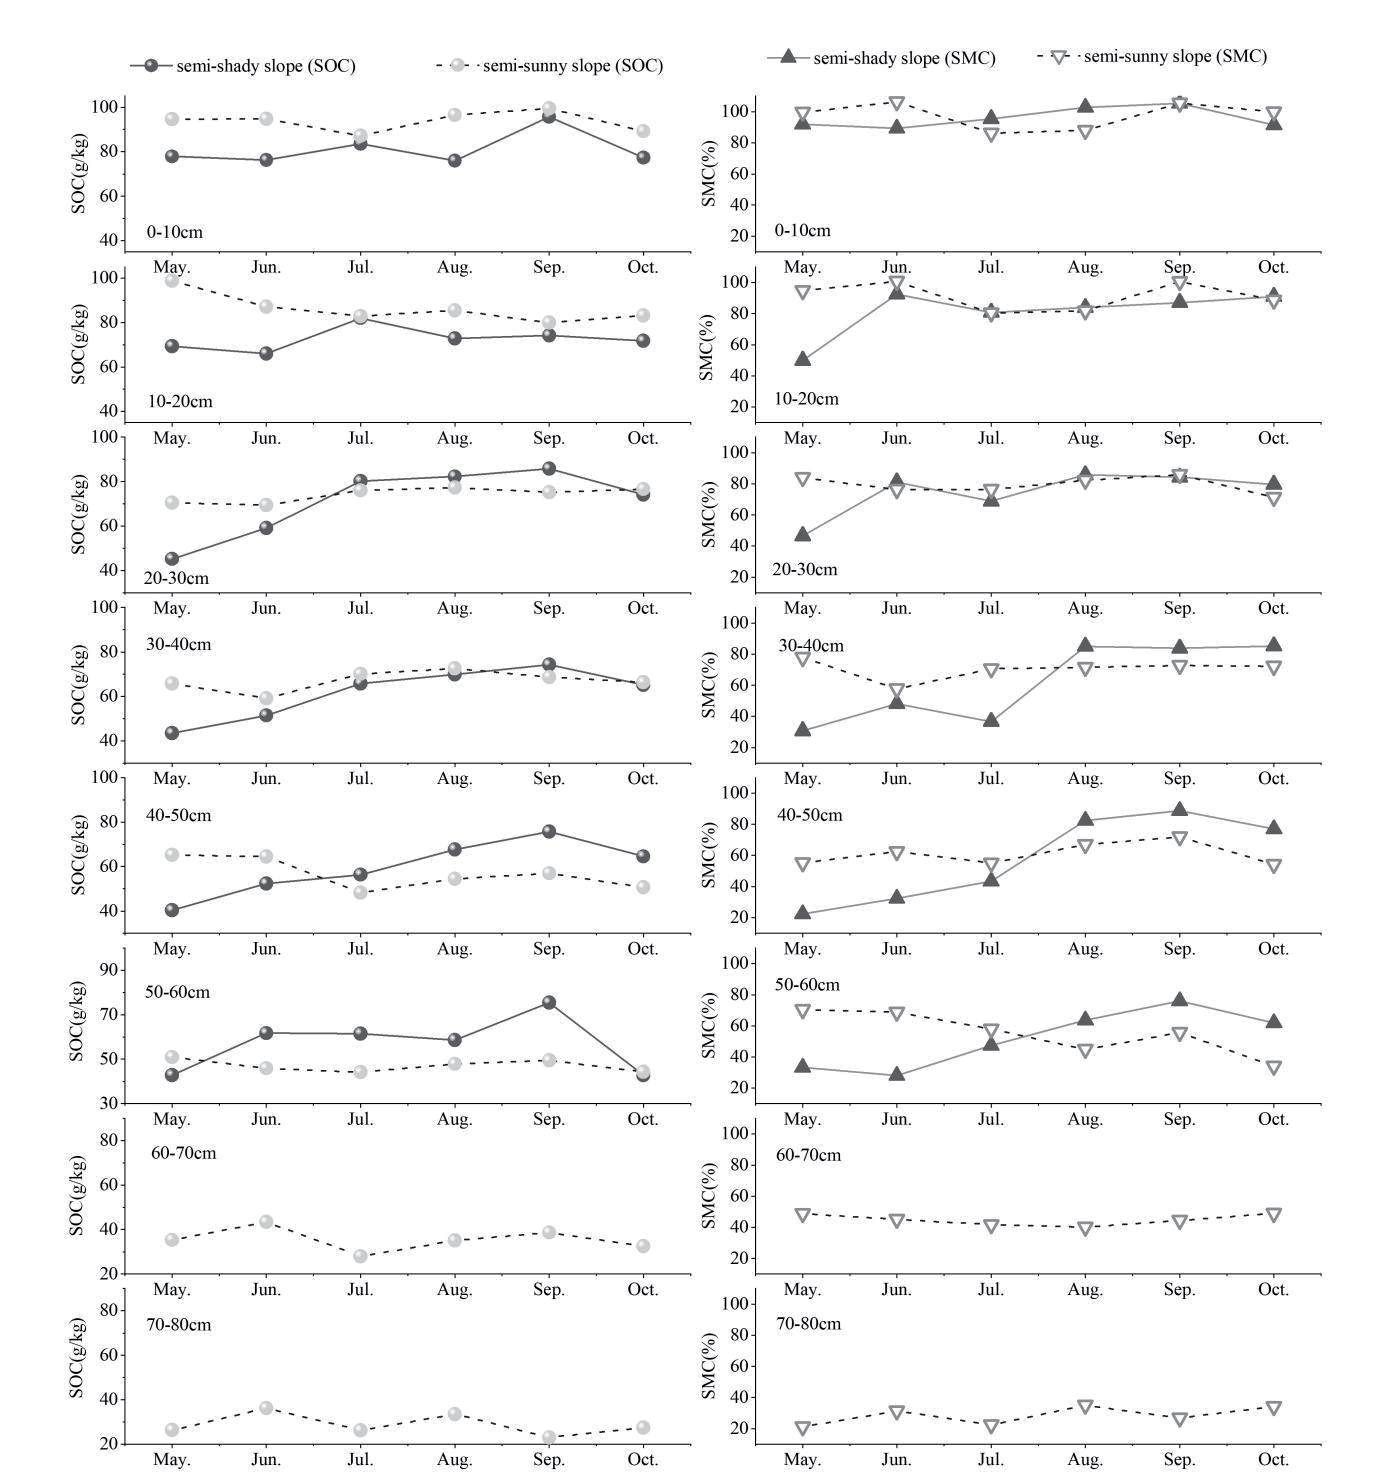
The temporal change trend of SOC showed some differences at different soil layer depths (Fig. 5). For the semi-shady slope, the changes of SOC in the soil layer of 0-10 cm showed the same trend as the monthly changes in precipitation. In May, the melting of the surface permafrost increased the soil moisture, which was favorable to the preservation of soil organic matter. In August, the temperature was the highest and the precipitation decreased, which caused the organic matter to decompose faster and the SOC showed a decreasing trend. In the soil layer of 10-20 cm, the change trend of SOC was consistent with that of the soil layer of 0-10 cm, but the increase was smaller in September. In the soil layer of 20-30 cm, 30-40 cm and 40-50 cm, the SOC showed an increasing trend from May to September and a decreasing trend from September to October. In the soil layer of 50-60 cm, the SOC exhibited an increase from May to June, remained stable from June to August, increased from August to September, and decreased from September to October. For the semi-sunny slope, the SOC values in the soil layer of 0-10 cm were higher in May-June, and they decreased in June-July, increased in July-September, and decreased in September-October. Except for July, the change trend of SOC in other months and the monthly trend of precipitation were consistent. In July, the vegetation was in the peak growth period, the transpiration of vegetation was significant, and the SMC decreased, which was not conducive to the preservation of organic matter and caused the SOC to show a decreasing trend. At depths of 10-20 cm, the SOC was higher in May than in other months. When the depth changes to 20-30 cm, the SOC did not differ much between months. At depths of 30-40 cm, the SOC was slightly lower in June than in the other months. At depths of 40-50 cm, the SOC was higher in May and June than in the other months. When the depth changes to 50-60 cm, the SOC also did not differ much between months. At depths of 60-70 cm, the SOC was higher in June than in the other months. At depths of 70-80 cm, the SOC was higher in June and August than in the other months. Comparisons revealed that in the 0-20 cm soil layer, SOC was higher in all months on semi-sunny slopes than on semi-shady slopes. The climatic conditions had a greater influence on the topsoil, and the climatic and light conditions were better on the semi- sunny slope than on the half-shady slope, so the biomass accumulated by vegetation was higher. In the soil layer of 20-40 cm, the SOC of the semi-sunny slope was higher than that of the semi-shady slope from May to June, and the difference was not significant from July to October. In the soil layer of 40-60 cm, the SOC of the semi-sunny slope was lower than that of the semi-shady slope in most months. As the depth of the soil layer deepens, due to the semi-shady slope located in the back shade area, the water is not easy to evaporate, the decomposition rate of organic matter is slower, and a large amount of organic matter is accumulated and preserved, which makes the SOC of semi-shady slope gradually higher than that of the semi-sunny slope.
Spatial Variation Characteristics of SOC
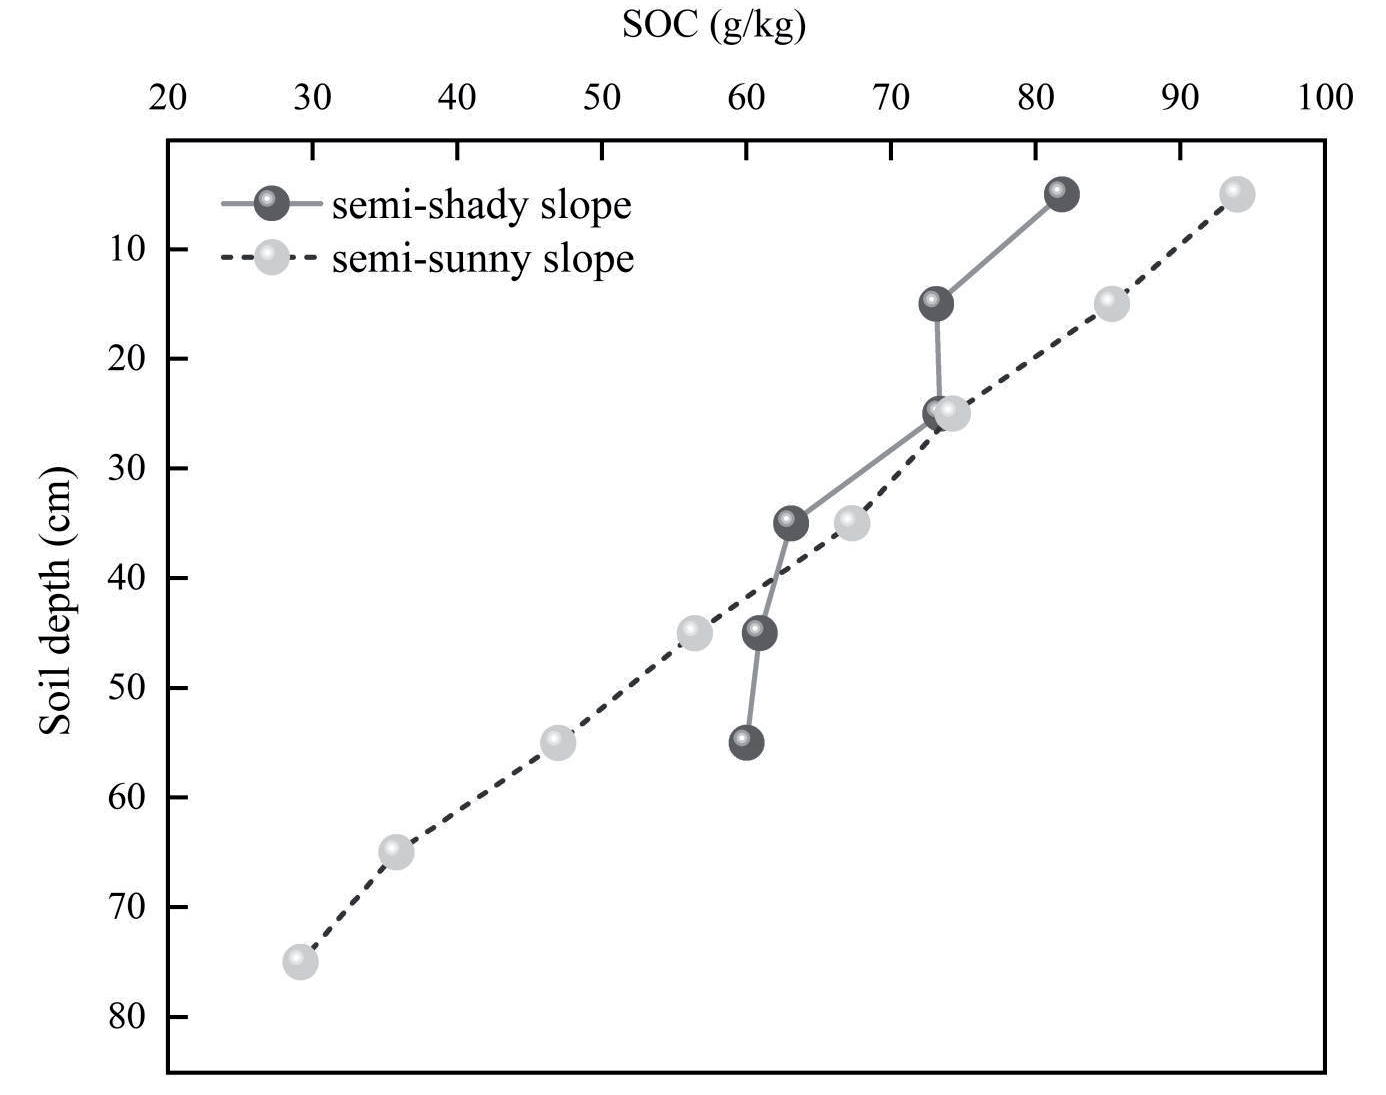
There were significant differences in SOC content in different slope directions and soil depths (Table 1). On the semi-shady slope, SOC content in the soil layers of 0-10 cm and 30-60 cm differed significantly (p<0.01), but that in the soil layer of 10-30 cm did not differ significantly from them. On the semi-sunny slope, SOC content was different significantly among soil layers (p<0.01), while that in the soil layer of 20- 40 cm and 60-80 cm did not differ significantly. In the soil profile, the SOC content gradually decreased with the depth of soil layer on the different slope directions. SOC content of the semi-shady slope was moderately variable throughout the soil profile (0-60 cm), while that of the semi-sunny slope was weakly variable (<10%) in the soil layer of 0-40 cm and moderately variable in the soil layer of 40-80 cm. In general, the spatial variability of the SOC content on the different slope directions was weak in the vertical profile, due to the relatively stable natural environment and the low influence of human activities in the study area.
From Fig. 6, it can be seen that the SOC content in the soil layer of 0-30 cm was higher on the different slope directions, and it tended to decrease gradually with the increase of the soil layer depth. This is because vegetation roots in the subalpine scrubland are mainly distributed in the surface soil of 0-30 cm [28], where the source of soil organic matter humus is concentrated. Compared to the semi-sunny slope, SOC content on the semi-shady slope was lower in the soil layer of 0-40 cm but was significantly higher in the soil layer of 40-60 cm. The level of SOC content is inextricably linked to soil physicochemical properties and the input and output of vegetation and other organisms [37]. In the study area, the light conditions are better on the semi-sunny slope than on the semi-shady slope, so the biomass accumulated by vegetation is higher and thus the SOC content in the soil layer of 0-40 cm is also higher on the former than on the latter. For the semi-shady slope located in the shade area, soil moisture is not easy to evaporate and the decomposition rate of organic matter is slower with the increase of soil layer depth, which reduces a large amount of organic matter is accumulated and the organic carbon content in the soil layer of 40-60 cm is higher on the semi-shady slope than on the semi-sunny slope.
Table 1.
Statistics of SOC in different slope directions and soil depths.
Spatial and Temporal Variation of Soil Moisture
Temporal Variation Characteristics of Soil Moisture
During the sampling period, the SMC ranged from 18.02% to 117.43% on the semi-shady slope and from 18.95% to 114.56% on the semi-sunny slope, indicating that the variation of SMC was basically consistence for different slope directions. On a monthly scale (Fig. 7), the SMC showed an “increasing (May-September) – decreasing (September-October)” trend on the semi-shady slope, while it showed a “decreasing (May-July) – increasing (July-September) – decreasing (September-October)” trend on the semi-sunny slope. This is consistent with the temporal variation of SOC content in different slope directions, since changes of SMC can affect plant root metabolism and thus affect SOC accumulation. The SMC of the semi-shady slope reached a maximum value of 87.50% in September and a minimum value of 45.78% in May, while that of the semi-sunny slope reached a maximum value of 70.40% in September and a minimum value of 61.33% in July. In May, the weather started to warm up and the permafrost started to thaw, but the temperature on the semi-shady slope was relatively lower, resulting in low SMC. In July, the vegetation was at its peak growth and its transpiration was significant in the study area [38], resulting in low SMC relatively. In September, the SMC was higher as the temperature and the evapotranspiration decreased.
There were some differences in SMC in different slope directions. SMC was significantly lower on the semi-shady slope in May than in August-October (p<0.01), but that in June-July did not differ significantly from them. On the semi-sunny slope, SMC did not differ significantly among months. The comparison revealed that the SMC was lower in May-June but was higher in July-October on the semi-shady slope than on the semi-sunny slope. In May-June, the temperature is higher on the semi-sunny slope than on the semi-shady slope, resulting in the soil moisture being replenished by the melting of the permafrost and the SMC is higher in the former than the latter. In the study area, precipitation is mostly concentrated in summer, and the evaporation is relatively strong on the semi-sunny slope than on the semi-shady slope located in the shade area, so the SMC is lower on the former than the latter from July to October.
Climate and vegetation have a more direct impact on topsoil. Combined with Fig. 4 and Fig. 5, the temporal changes of SMC in soil layers at different depths were analyzed. In May, the warming of the temperature and the melting of the permafrost increase the soil moisture, from June to September the increasing precipitation causes the soil moisture to increase, and in October the decreasing precipitation causes the soil moisture to decrease. For the semi-shady slope, the SMC in the soil layer of 0-10 cm did not change much from month to month, but the SMC was higher in May, and showed an increasing trend from June to September, and decreased in October. For the semi-sunny slope, the SMC in the soil layer of 0-20 cm was lower in July and August, when vegetation growth was vigorous and transpiration of vegetation was significant, and the temperature was highest and the evaporation was strongest in August. In the soil layer of 0-30 cm, the difference of SMC was smaller in both semi-shady and semi-sunny slopes from June to October, but the topsoil starts to melt to recharge soil water despite the temperature of the semi-shady slope being low in May. In the soil layer of 30-60 cm, the SMC of semi-sunny slope was higher in May-July and lower in August-October than that of semi-shady slope.
Fig. 7.
Temporal change of SMC in different slope directions (Data represent mean and standard error, different letters under the same type indicate significant differences).
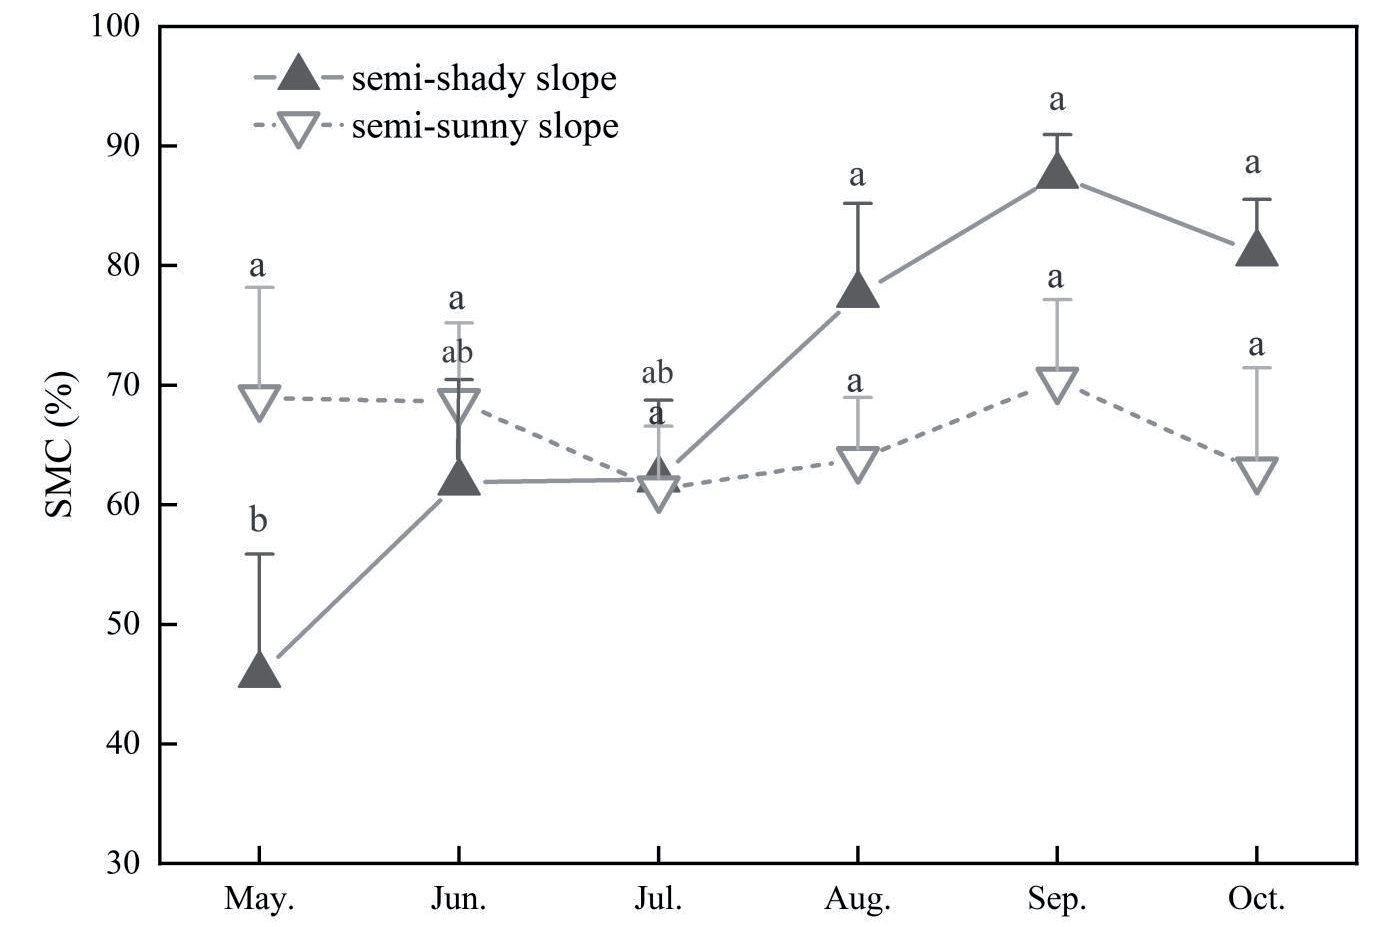
Table 2.
Statistics of SMC in different slope directions and soil depths.
Spatial Variation Characteristics of Soil Moisture
There were significant differences in the SMC for different slope directions and soil depths (Table 2). The SMC of the semi-shady slope was significantly higher in the soil layers of 0-10 cm than in the soil layers of 30-60 cm (p<0.01), and it was significantly lower in the soil layers of 50-60 cm than in the soil layers of 0-30 cm (p<0.01). The SMC of the semi-sunny slope was significantly higher in the soil layers of 0-20 cm than in other soil layers (p<0.01), and it was significantly lower in the soil layers of 60-80cm than in other soil layers (p<0.01). The changes of SMC are mainly influenced by a combination of atmospheric precipitation and vegetation root uptake [39]. In the subalpine scrubland, precipitation affects the surface soil to a higher extent than the deep soil, where the distribution of vegetation root is shallow, so the difference of water moisture content between them is obvious. The SMC on the different slope directions showed a tendency to decrease with increasing of soil depth, with moderate variability in all soil layers except in the soil layer of 20-30 cm on the semi-sunny slope with weak variability (<10%).
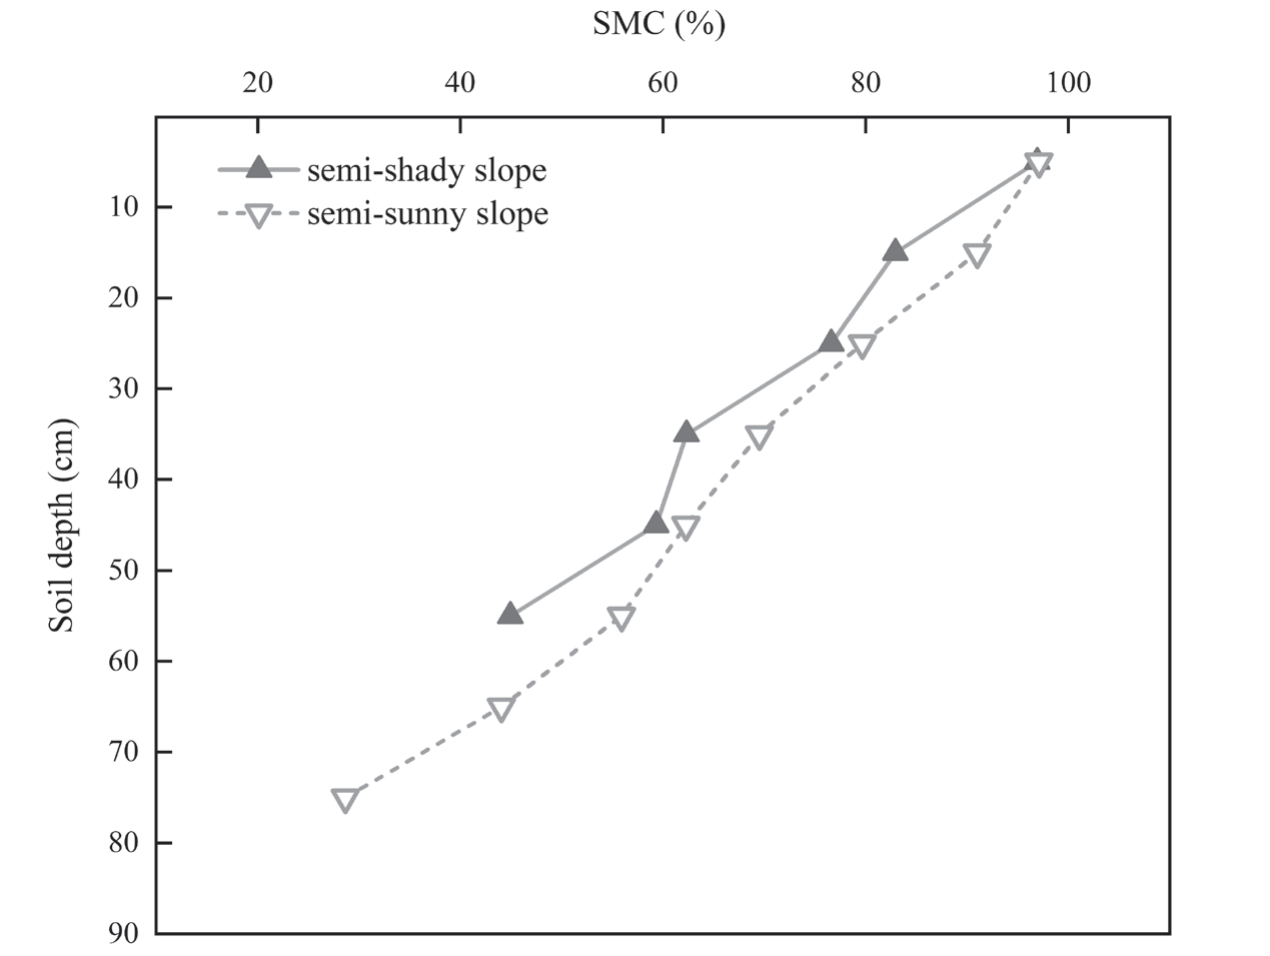
Table 3.
Mechanical composition of soil in different slope directions.
It can be seen from Fig. 8 that the SMC gradually decreased with the increase of the soil layer depth, which was consistent with the change of SOC in soil vertical profile. The comparison revealed that the variation of SMC was about 70% from soil layer of 0-10 cm (97.10%) to 50-60 cm (28.66%) on the semi-sunny slope and was about 50% from soil layer of 0-10 cm (96.92%) to 50-60 cm (44.92%) on the semi-shady slope. This showed that the variation of SMC in soil vertical profile is greater on the semi-sunny slope than on semi-shady slope. In the study area, the semi-shady slope is in the shade area, where soil moisture is not easily evaporated and the variation of SMC is relatively smaller from the surface layer to the deep layer.
At the same soil depth, the SMC was greater on the semi-sunny slope than on the semi-shady slope. Precipitation is a direct source of soil moisture, and the dynamics of SMC are derived from the soil infiltration capacity and the holding capacity of soil moisture [40, 41]. In the study area, the soil mechanical composition showed that the contents of clay and silt were 8.60% and 52.42% on the semi-shady slope and were 9.87% and 61.97% on the semi-sunny slope respectively (Table 3), indicating that they were smaller on the former than on the latter. It can be seen that the soil texture is rougher on the semi-shady slope than on the semi-sunny slope, which made the holding capacity of soil moisture less effective and the storage capacity of water moisture weaker on the former than on the latter. And as can be seen in Table 3, this feature is reflected at different depths of the soil layer.
The Relationship between SOC and Soil Moisture Content
SOC content is mainly influenced by natural and anthropogenic factors [42, 43]. The variation of SMC is influenced by various factors such as temperature, precipitation and topography. At the regional scale, SMC affects the growth of vegetation, and directly or indirectly influences the activity of soil microorganisms, which in turn affects the decomposition rate of SOC and soil organic matter content [44-47]. To understand the relationship between SOC and soil moisture in the subalpine scrublands of the eastern part of Qilian Mountains, they were divided into intervals by soil layer depth of 20 cm, and mathematical relationships between them were established for each interval.
From Fig. 9, it can be seen that SOC content and SMC were positively correlated in different soil layer depths on the different slope directions. Tao et al. [48] conducted the relationship between SOC and soil moisture in different grassland types and found that there was a significant positive correlation between them. In addition, SOC content was also significantly and positively correlated with SMC in lucerne grasslands in the semiarid Loess Plateau [49] in China, which is consistent with the results of this study. However, it has also been shown that lower soil moisture is beneficial to the accumulation of SOC. This is because lower soil moisture reduces root respiration on the one hand, and makes the root system develop deeper as well as increases the amount of soil inert carbon on the other hand [50, 51]. In addition, changes of SMC affect microbial activity by influencing soil permeability, which in turn acts on soil respiration. For example, Wang et al. [47] concluded that the decomposition rate of soil organic matter increases (until the optimum soil moisture is reached) and then decreases with the increasing of SMC. However, the effect of soil moisture on soil respiration is difficult to determine when changes of soil moisture have a small influence on the activity of soil microorganisms and plant roots. Therefore, the effect of SMC variation on SOC content is limited [48]. In this study, the positive correlation between SOC content and SMC passed the significance test in the soil layer of 20-40 cm on the semi-sunny slope and in the soil layers of 20-40 cm and 40-60 cm on the semi-shady slope.
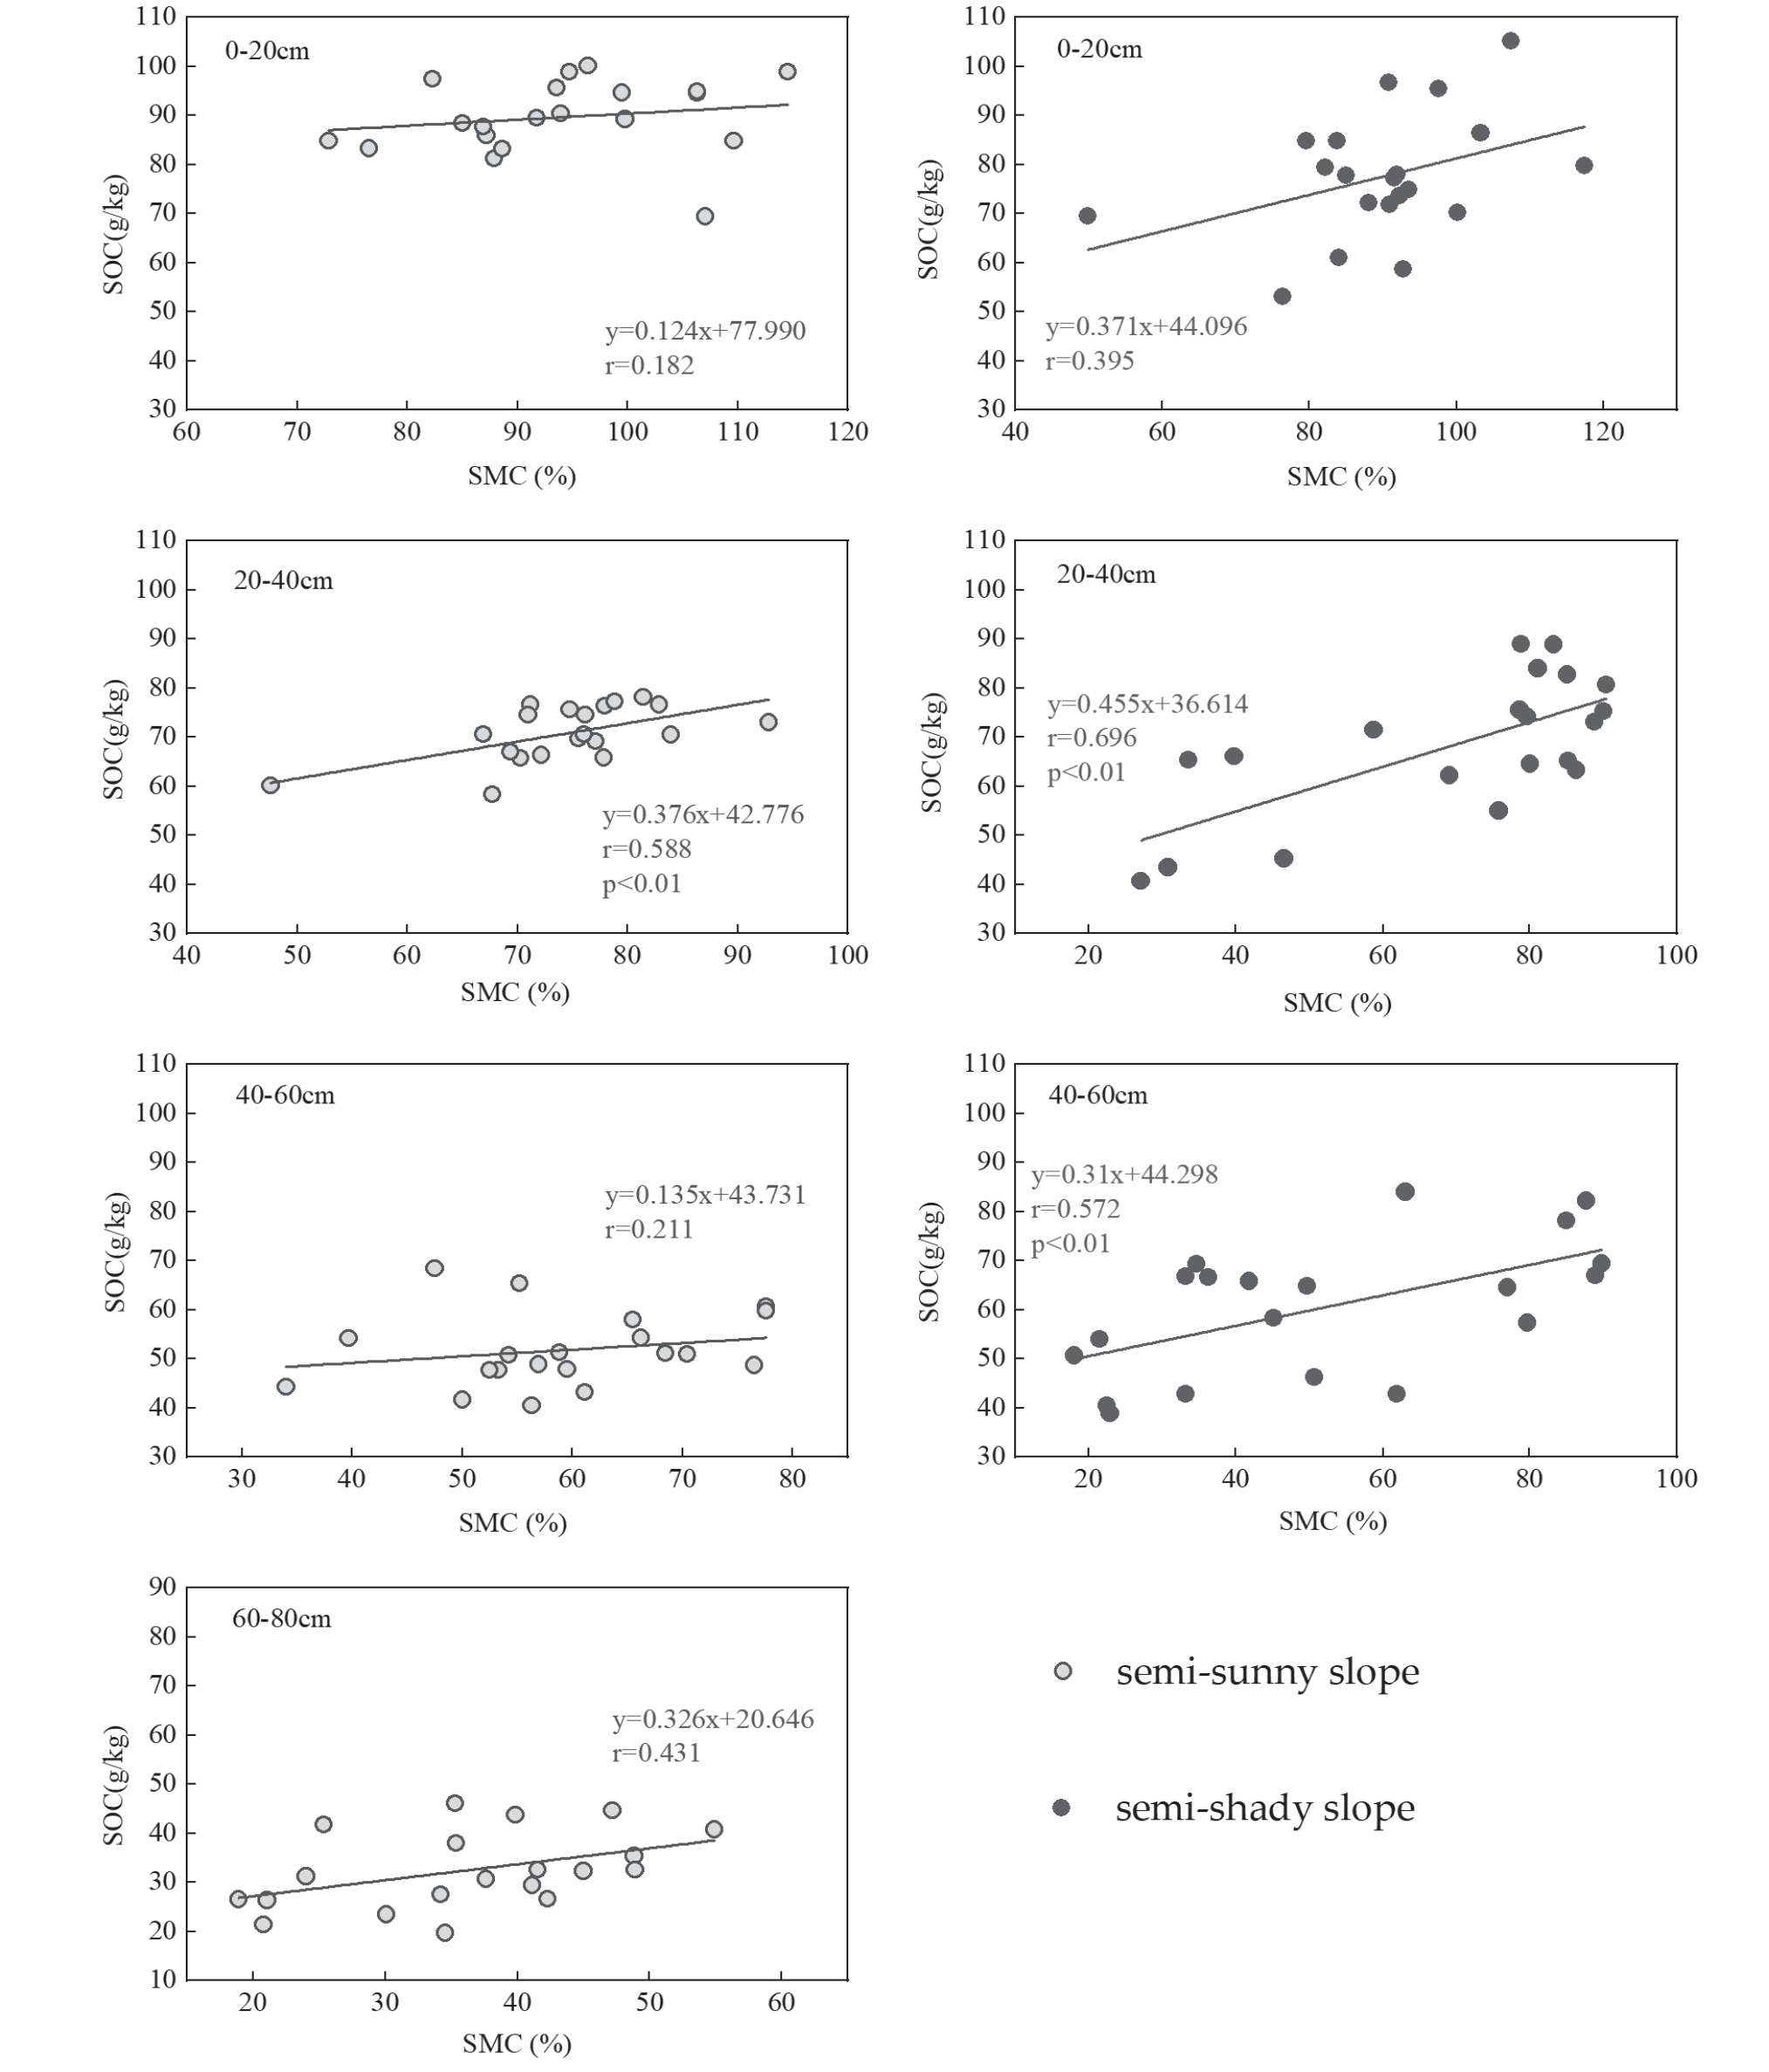
The comparison revealed that the relationship between SOC content and SMC was highest in the soil layer of 20-40 cm in different slope directions, indicating that soil moisture had the greatest effect on SOC at this soil depth. In semi-arid areas, soil moisture is an important influencing factor of limiting vegetation growth and organic matter return [52]. SMC affects the water absorption and utilization of aboveground plants and the dispersion of soil aggregates, which leads to the distribution changes of aboveground vegetation cover and belowground plant roots, and in turn affects the input and output of organic matter and ultimately affects the level of SOC content [53]. In the soil layer of 0-20 cm, SMC is more influenced by plant uptake and soil evaporation, and thus the correlation between SMC and SOC content was weaker. In the soil layer of 20-40 cm, soil moisture uptake of vegetation roots and soil evapotranspiration weaken [20], so more soil moisture prevents the decomposition of SOC relatively [4], which shows a strong positive correlation. In the soil layer of 40-60 cm, the correlation between SMC and SOC content decreased. In the soil layer of 60-80 cm (semi-sunny slope), the SMC was low, and the variation of SOC may be related to the soil-forming parent material and soil environment in the deeper layers [54], which resulted in less correlation between them.
Comparing the same soil layer depth, the correlations between SOC content and SMC were stronger on the semi-shady slope than on the semi-sunny slope, indicating that the influence of soil moisture on SOC was greater on the former than the latter. The semi-shady slope is in the shade area where soil evaporation and vegetation transpiration are small, so more soil moisture is preserved in the soil and is conducive to the accumulation of soil organic matter. The semi-sunny slope is in the sunny area where there are good light and heat conditions, so SOC is relatively more affected by microbial decomposition. Therefore, the SOC content is more positively correlated with SMC on the semi-shady slope than on the semi-sunny slope. In the study area, human activities are weak (with light grazing), and the variability of vegetation types between the different slopes is small, but SOC content and SMC are higher on the former than on the latter. It has been shown that high SMC inhibits the decomposition of soil organic matter, i.e., SMC is significantly and negatively correlated with soil respiration [55]. The semi-shady slope has relatively lower temperatures, less vigorous evaporation, and weaker soil respiration, which will facilitate the accumulation of soil organic matter and soil moisture conservation [20, 54], so SOC content is more positively correlated with SMC on the semi-shady slope.
Conclusions
The relationship between SOC and soil moisture in subalpine meadows in the eastern part of Qilian Mountains was investigated using measured data, and the main conclusions were as follows.
The SOC content decreased with increasing soil depth during the plant growing season, exhibiting significant surface aggregation. Since the semi-sunny slope has better light conditions than the semi-shady slope, vegetation accumulates more biomass, resulting in higher SOC content in the 0-20 cm soil layer in each month (May to October) on the former than on the latter. With the increase of soil depth, the soil moisture of the semi-shady slope is not easy to evaporate, which results in the decomposition of organic matter being slower, and a large amount of organic matter being accumulated and preserved. In the soil layer of 20-40 cm, the SOC content of semi-shady slope showed an increasing trend from June to September while that of semi-sunny slope was relatively stable in each month, so that the gap of the SOC content between them was very small. In the soil layer of 40-60 cm, the soil moisture of the semi-shady slope increased significantly from June to September, and its SOC content was higher than that of the semi-sunny slope in most of the months.
SOC content and SMC showed a positive correlation in different slope directions and soil depths. In the same soil layer depth, the correlation between SOC content and SMC was stronger on the semi-shady slope than on the semi-sunny slope, therefore the effect of soil moisture on SOC was greater on the former than on the latter. Among different soil layer depths, the correlation between SOC content and SMC was highest in the soil layer of 20-40 cm, indicating that the soil moisture most significantly affected SOC in this layer.
In alpine mountainous areas, soil moisture conditions are significantly affected by climate, and SMC is the main factor affecting SOC turnover and decomposition. Therefore, the results of this study showed that there was a positive correlation between SOC and SMC, and that soil moisture had different effects on SOC in different slope directions and different soil depths. These findings contribute to deepen our understanding about the effects of plant growth and soil moisture changes on the carbon cycle in alpine mountains, and provide a theoretical basis for the study of carbon storage and cycle at high altitudes.

