

Introduction
Hymenoptera represents the second-largest order of insects, with 155,000 known species [1]. In terms of human health concerns, Formicoidea (ants), Apoidea (bees), and Vespoidea (wasps) are the three most prominent superfamilies of this order [2]. The members of this order include parasitoid wasps, which regulate the abundance of host plants; predator wasps, which regulate the abundance of prey populations; and bees, which carry out the process of pollination. Therefore, these members play a significant role in maintaining the structure and function of the forest ecosystem [3]. They also influence the characteristics of modern terrestrial ecosystems [4]. For example, members of Hymenoptera exhibit a wide range of social behaviors, such as the solitary lifestyles of parasitic wasps, the simple family system of bumblebees, and the complex nest networks of supercolonial wood ants [5]. Hymenoptera accounts for the maximum number of parasitoid species, representing 75% of the total [6]. Within the Hymenoptera, a few species of the Terebrantia order use their ovipositor for egg-laying, while species from the Aculeata order use their modified ovipositors as stingers for injecting venom into prey or as defense mechanisms [2]. These features are ideal for understanding the evolutionary dynamics and cohesion of complex social groups of taxa.
The abundance and variety of species are influenced by multiple environmental factors such as climate, interaction among species, anthropogenic effects, etc. [7]. Seasonal variation in insect populations has been documented for various regions of the world, providing insight into the ecological processes that occur in specific ecosystems, particularly in dry tropical or temperate forest ecosystems [8, 9]. The pattern of temporal dynamics reflects the population size and richness of insect species [10] affected by biotic and abiotic factors. Abiotic factors such as temperature, rainfall, and humidity have a significant impact on the distribution of insect populations [11, 12]. For example, insect abundance is controlled by temperature in dry temperate zones [13] and by rainfall in tropical zones [14]. Biotic factors comprise several factors, including the availability of food, predation, parasitism, and the morphological structure of the host plant. All of these strongly influence insect abundance throughout the year [15]. The biodiversity of fauna within an ecosystem provides essential health indicators for that ecosystem [16]. For instance, species diversity ensures the natural sustainability of ecosystems and aids in their recovery from natural disasters [17].
The Malaise trap is a widely used entomological tool for the collection of arthropods on a large scale. This trap has a large tent-like structure made with fine mesh netting. It serves as a non-attractant and static insect trap [18]. This trap is usually used to capture flying insects, particularly Diptera and Hymenoptera, and it can also be used to collect various ground-dwelling species [19]. Several studies have established the effectiveness of these traps in capturing Hymenoptera in different South Asian countries, including India [20], Pakistan [21], and Iran [22].
Traditional morphological classification methods of insects remain relevant in taxonomy for describing the diversity of insects [23]. However, identifying species through this morphological method using a microscope proves challenging because it requires in-depth knowledge [24, 25] to differentiate closely related species [26]. The use of DNA-based methods in the identification of species has several advantages, such as the reproducibility of results [27, 28].
This technology is cost-effective, involves a simple protocol that takes only a few hours to complete, and can easily be applied to small animals [29]. Cytochrome oxidase I (COI) DNA barcoding is widely used as an alternative method for identification compared to the traditional morphological method [27]. In other words, this method is superior to other techniques for discriminating cryptic biodiversity [30]. For example, several cryptic species of butterflies have been identified via DNA barcode analysis that were morphologically similar and could not be distinguished at the species level through traditional morphological identification [31]. The current status of the Hymenopteran fauna is relatively robust in countries like Pakistan [32-35]. In addition, there are almost 5000 known species of insects in Pakistan [36]. However, the presence of Hymenoptera species in the Balochistan province of Pakistan has not been completely explored. A literature survey was carried out, which clearly indicated that only a few publications are available on Hymenoptera (wasp fauna) in the Quetta region of Balochistan, which covers only two species, Polistes gallicus and Vespula germanica, in the two subfamilies Polistinae and Vespinae [37]. Another two genera (i.e., Poliste: Latreille 1802, and Ropalida: Guerin-Meneville, 1831) of the subfamily Polistinae and one genus (i.e., Vespa: Linnae Vespinae) were identified in Killa Saifullah (Northeastern Balochistan) [38].
The Ziarat juniper forests in Balochistan, Pakistan, cover a mountainous area extending from an altitude of 1,181 to 3,488 meters. This forest is the major juniper forest in Pakistan, encompassing an area of 110 thousand hectares [39, 40]. A unique ecosystem of fauna and flora has been observed within our study area, i.e., the juniper forest of Ziarat. This forest has been declared a ‘Ziarat Juniper Forest Biosphere Reserve’ by the United Nations Educational, Scientific, and Cultural Organization (UNESCO, 2013). Certain areas within this ecosystem are safeguarded, thus providing refuge for endangered wildlife and protecting the surrounding variety of flora. This is done by establishing wildlife reserves and game parks that protect the habitats from any potentially anthropogenic activities. The insect biodiversity of this area based on molecular identification has not been fully documented. In this study, we combined traditional morphological and DNA barcoding methods using the mitochondrial marker cytochrome c oxidase subunit I (COI) gene. We also studied the temporal dynamics of the Hymenoptera species population in this region.
Materials and Methods
Study Area
The present study was conducted in the juniper forest of Ziarat District (30°22’51N and 67°43’37S), Balochistan province. This district covers an area of 1487 km2 and is situated at an altitude of an average 2454 m (Government of Balochistan, 2011). It is located 70 km from Quetta, the capital of Balochistan province [41].
Malaise Trap Installation
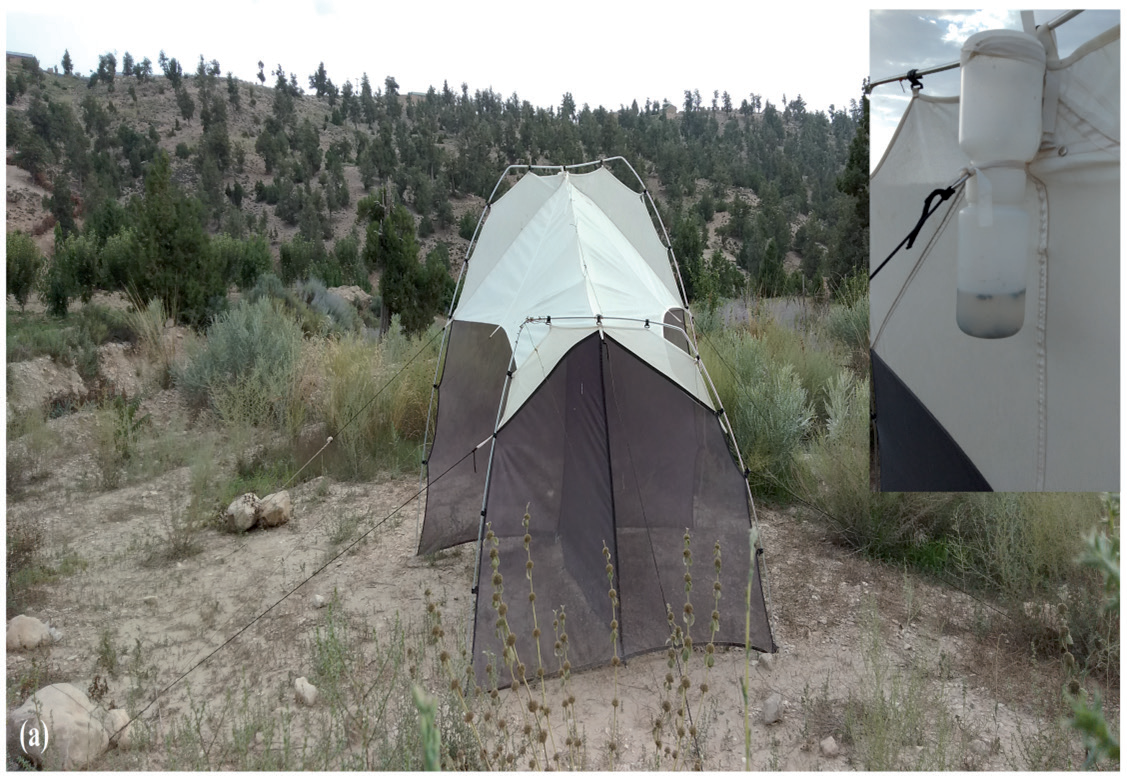
A single Malaise trap made of knitted polyester mesh was used for the present study. This trap had specific dimensions, i.e., length 165 cm, width 80 cm, and height 180 cm. The size of the mesh opening was 96 cm x 26 cm, and the net weight of this trap was 870 g. One face of the tent was left open, and a single Nalgene® insect-collecting bottle filled with 95% ethanol was placed inside the tent. A funnel was used to channel the insects into the bottle via vertical screens or curtains, which intercepted and facilitated flying insects during their attempts to escape. In December 2018, this trap was installed at Sandaman Tangi (30°24’00.5”N, 67°43’36.5”E), a village of the Union Council of Ziarat with an altitude of 2450 m. Malaise trap installation is shown in Fig. 1.
Sampling and Preservation of Samples
Samples were collected on weekends for 52 weeks, from December 2018 to December 2019. Samples were collected in a 500 mL plastic Nalgene® bottle containing 400 ml ethanol (95%) and then transferred into a Whirl- Pak bag® containing 95% ethanol. The dates of collection were marked on bags, and these specimens were then brought to the Entomology Laboratory, Department of Zoology, at the University of Balochistan for their morphological identification. The Hymenoptera insects were sorted from the samples, and large insects were pinned in an entomological box, while the remaining small insects were left in 95% ethanol for morphological identification using available taxonomic references. From the collected samples, alternate specimens for each species were stored in ethanol at -20ºC before and later shifted to the Center for Biodiversity Ggenomic (CBG) in Canada for DNA barcoding.
DNA Extraction and PCR Amplification and Sequencing
DNA extraction, polymerase chain reaction (PCR), and DNA sequencing were performed at the Canadian Center for DNA Barcoding (CCBD). One or two legs of adult morphologically identified insects were used for DNA extraction using standard protocol, and their respective vouchers were recovered for imaging and curation [27, 42]. The cytochrome c oxidase subunit 1 (CO1) was amplified using forward and reverse primers in PCR which are LepFoIF (ATTCAACCAATCATAAAGATATTGG) and LepFoIR (TAAACTTCTGGATGTCCAAAAAATCA) [43].
Extracted DNA samples and the whole mount of morphologically identified insects were sent to the Canadian Centre for DNA Barcoding (CCDB) (http:// ccdb.ca/resources.php) for DNA barcoding following the specified barcoding procedures [44, 45] and then curated at the Center for Biodiversity Genomic for sequencing. The data of each Hymenoptera species regarding DNA sequences, voucher evidence, and taxon information were deposited for public access in the Barcode of Life Data Systems (BOLD) (https://www.boldsystems.org/).
Data Analysis
The sequence generation was possible only for 8 out of 50 insects. The Barcode Index Numbers (BINs) were assigned to seven families of the order Hymenoptera. The sequences, along with BINs and other related taxonomic information, were uploaded to the Barcode of Life Data System (BOLD) (http://www.boldsystems. org/) following standard protocol [45]. These sequences were then downloaded from BOLD for comparative analysis with NCBI (National Center for Biotechnology Information) (https://www.ncbi.nlm.nih.gov/) using BLAST (Basic Local Alignment Search Tool). These sequences were aligned using the BioEdit alignment editor (version 7.0.5). We provided a direct link to the original sequence used for identification and stored in GenBank (NCBI) SUB13919971 Anth_cing_1 OR724646 SUB13919971 Ichne_sarc_1 OR724647 SUB13919971 Pol_gal_1 OR724648 SUB13919971 Cata_aen_1 OR724649 SUB13919971 chrys_1 OR724650 SUB13919971 Athoph_1 OR724651 SUB13919971 campo_1 OR724652
Results and Discussion
Temporal Dynamics of Hymenoptera
Out of the total 8430 insects, only 50 were identified morphologically as belonging to Hymenoptera. It is evident from Fig. 2 and Fig. 3 that the maximum mean population of Hymenoptera occurred during July and August, while the minimum mean population was recorded in January, February, March, and December (Table 1). It has been observed that the average population of Hymenoptera follows a Gaussian distribution pattern. The average monthly atmospheric temperature increases from May to September, leading to an increase in the insect population. A decline in the population of Hymenoptera between January-April and October-December is linked to a fall in temperature during these periods (Fig. 2). The monthly Hymenoptera population plotted as a function of temperature is shown in Fig. 3, which indicates exponential growth. A total of 50 insects of Hymenoptera were identified from the samples, and these belonged to 11 families and 40 genera (Fig. 3). These families included Apidae, Carabornidae, Chrysididae, Colletidae, Ichneumonidae, Formicidae, Megachilidae, Pompilidae, Sphecidae, Thynnidae, and Vespidae. The Ichneumonidae family was the most dominant and accounted for 10 genera and 11 species, followed by the Vespidae family, representing 7 genera and 13 species. The Thynnidae and Colletidae families were represented only by single genera and species. The species population was the highest during June-September and January-May while the population was extremely low from October-December due to low atmospheric temperatures. The most common species was Camponotus compressus (Fabricius, 1787), which reached its peak population during June-July, respectively, followed by Prenolepis impairs (Say, 1836), which was observed in all months except January with a maximum population in July. Anthidium cingulum (Latreille, 1809) had its lowest mean population during July-August while Delta dimidiatipenne (de Saussure, 1852) had its lowest mean population during August- September.
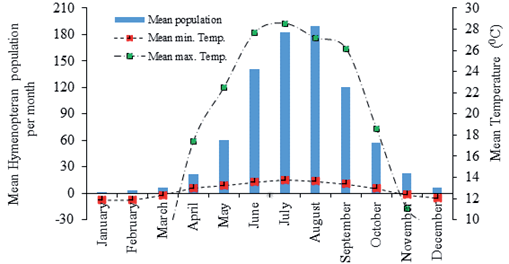
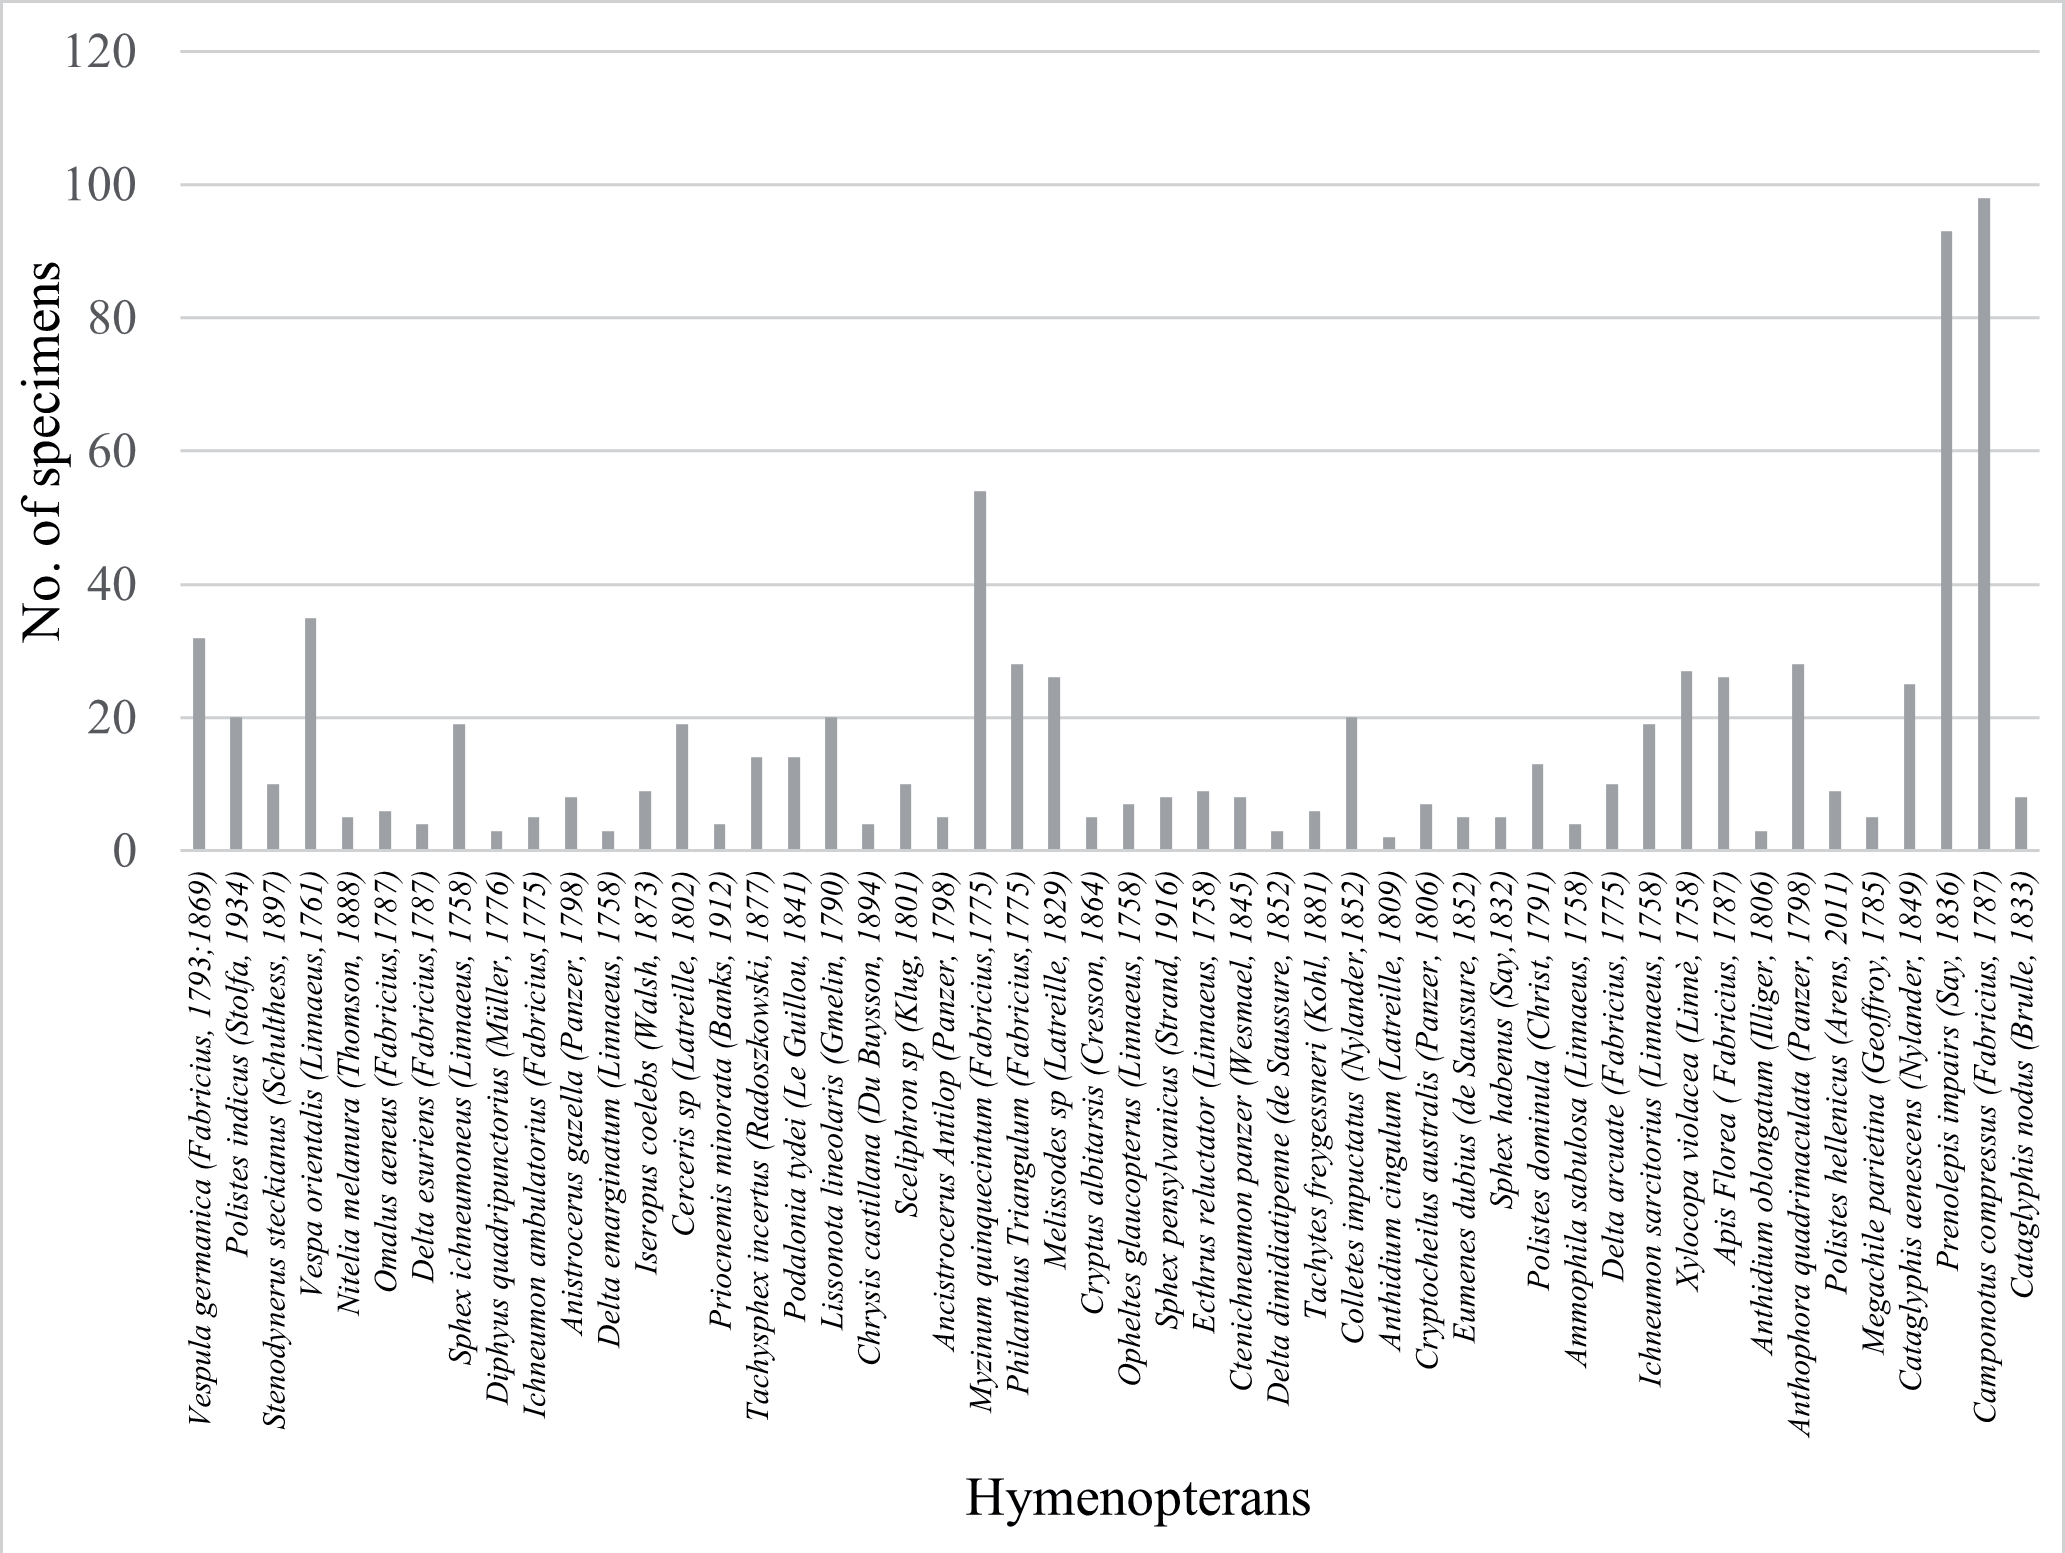
Table 1.
Identification of Hymenoptera insect species through the DNA barcoding method and their close matching results are presented in the NCBI database (%).
DNA Barcoding
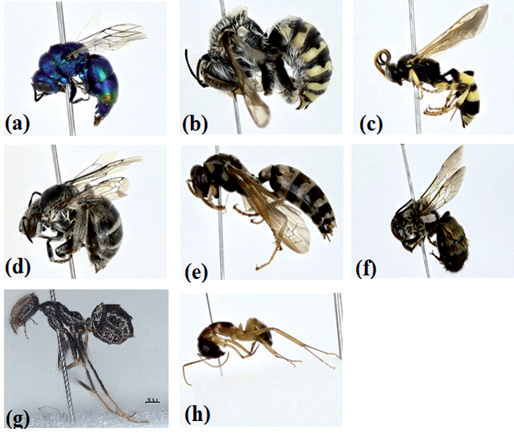
The DNA barcodes were generated only for eight species out of the 50 morphologically identified specimens (Fig. 4 and Fig. 5). Ichneumon sarcitorius showed the highest close match (99.51%) within the NCBI database, followed by Polistes hellenicus (98.55%), Anthidium cingulum (98.26%), Cataglyphis aenescens (96.66%), Anthophora quadrimaculata (93.44%), Megachile parietina (92.24%), Camponotus spp. (92.11%) and Chrysis castillana (88.24%) as shown in Table 1. Barcodes were assigned to three families, four genera, and four species based on their sequence divergence between Hymenoptera taxa and their barcode index numbers (BINs) (Table 2). Two unique BINs were assigned to the Chrysididae family (BOLD:AET0858), one to the Formicidae family (BOLD:AET2316) and one to Anthophora quadrimaculata (BOLD:AET5134). These unique BINS can offer a structured process of categorizing groups of genetically identical taxa, allowing the same taxa featured in different examinations to be labeled with a common identifier. There were no DNA barcodes in the rest of the specimens, possibly due to the contamination of samples and resulting degradation of DNA.
In this study, the Hymenoptera population was found to be most abundant during June-September due to the relatively high atmospheric temperature. Such results have also been reported in earlier studies [46, 47]. The abundance and species richness of bees have been reported during June-August [48]. Temperature, rainfall, and humidity are the main meteorological drivers that cause seasonal variations, which affect the population of insects [49]. Insect abundance is also influenced by temporal changes, which is a common spectacle in any ecosystem [50]. Other factors that control insect populations during a particular season include the unavailability of food, the dominance of insect predators and parasites, the competition for resources, and habitat destruction [51, 52].
Fig. 4.
Exponential correlation between mean population month-1 and mean temperature month-1 of Hymenoptera.
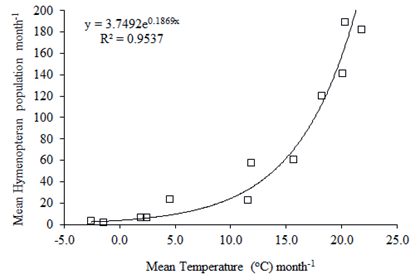
Table 2.
Sample ID of eight Hymenoptera, taxa, p-distance (%), member count, barcode index numbers (BINs) assigned, and their comparison to the nearest BINs in the BOLD database.
Among the morphologically identified 50 species, two species, Camponotus compressus (Fabricius, 1787) and Prenolepis impairs (Say, 1836), were recorded throughout the year. Both species showed the highest individual abundance over the entire study period [53]. Camponotus compressus is considered a significant economic pest [54] and widely known as a ‘carpenter’s pest’ [55, 56] because of its nesting behavior, which causes damage to buildings. [57] also studied the temporal dynamics of ants and found that seasonal behavior was evident in most of their species. On the contrary, Prenolepis impairs (Say, 1836), known as the ‘winter ant’, remains active, foraging across the year, even in the lowest temperature period of the year. This species is more tolerant at low temperatures than other ant species [58, 59]. Our findings are consistent with those of [60], who have also reported the abundances of temporally dynamic of species of these insects.
Fig. 5.
Identified species of Hymenoptera through DNA barcoding. a) Chrysis castillana, b) Anthidium cingulum, c) Ichneumon sarcitorius, d) Anthophora quadrimaculata, e) Polistes hellenicus, f) Megachile parietina, g) Cataglyphis aenescens and h) Camponotus spp.
Malaise traps are mostly preferred for the sampling of flying insects, particularly the Diptera and Hymenoptera, due to their effectiveness [19]. It has been a common practice in insect surveillance studies to use the Malaise trap as a standardized method for species collection and to investigate both the temporal and spatial dynamics of insect populations, as well as the identification of species using DNA barcoding methods [18, 61, 62]. It was reported that Psilochalcis minuta in the Juniper ecosystem using a Malaise trap was the most abundant species during July-August [63].
The taxonomical identification of species relies heavily on DNA sequencing. Only eight sequences and their relevant barcode index numbers (BINs) were generated. Among the assigned BINs, four species were unique, for which there was a lack of barcode databases, which indicates the possibility of a new species. In the IBOL (International Barcode of Life) database, all species codes (from QBZS1 to QBZS50) are displayed along with their photos of 50 morphologically identified species. Only eight species have a standard barcode, while barcodes for 42 species were not possible either due to non-amplification or produced sequences that were difficult to interpret, which might be due to contamination or damage to DNA after the extraction process. Another reason was that those specimens nucleotide sequences higher than 500bp obscured the others showing lower nucleotide sequence values. [64] barcoded 50,094 out of 60,273 specimens collected from Pakistan for DNA sequencing of insect biodiversity in a surveillance study, where DNA barcodes of 17% specimens were not generated. Various research groups have also reported such differences in the recovery of DNA sequences across varied insect taxa [65, 66]. Among the assigned BINs, four species were unique, indicating the possibility of new species.
The earlier published literature has shown that operational taxonomic units (OTUs) assigned to morphologically unidentifiable species are less frequently criticized and accepted to some extent [67, 68]. The BIN system was developed to overcome these constraints [69]. This system has been applied to diverse groups of animals to discriminate between species as well as discover new species [70]. However, it is not an easy tool for morphological analysis and requires further scrutiny and thorough understanding before it could be applied to evolutionary and lineage studies [71].
Conclusion
We have concluded from our study that the Juniper Forest ecosystem is rich in Hymenoptera species. The overall population of Hymenoptera varies with temperature fluctuations throughout the year and exhibits a Gaussian distribution. Hymenoptera abundance showed an increase with a rise in mean temperature, as indicated by the exponential correlation value. Furthermore, we concluded that the combination of traditional morphological and DNA barcoding procedures is useful for investigating Hymenopteran insect species. Malaise traps spread over large areas have proved to be more beneficial and should be installed to study temporal dynamics and species recoveries in Juniper ecosystems.

