

Introduction
Soil organic carbon (SOC), the largest carbon pool in the world and an important component of the carbon cycle, plays a key role in climate change and greenhouse gas emissions [1, 2]. SOC also plays an important role in improving nutrient supply, soil physical and chemical properties, and soil microbial composition, and reduces the negative environmental impacts [3, 4].
Various environmental factors influence SOC, and therefore, changes in these factors result in varying degrees of alterations in SOC [5]. Climate, topography, and spatial and temporal differences affect soil properties and, in turn, SOC distribution [6]. Generally, a relatively high soil pH accelerates SOC decomposition, decreasing SOC storage [7]. Recently, Xu et al. [8], using geographically weighted regression (GWR) technology, found that SOC and pH were positively correlated in Northern Europe but negatively correlated in the central and eastern regions. Climatic conditions regulate the content of SOC, and changes in temperature and precipitation are associated with soil processes [9] and the plant litter input-soil microbial decomposition balance, affecting organic carbon output [10]. In the Liaohe Plain, Liu et al. [11] demonstrated that SOC was positively correlated with mean annual precipitation (MAP) and negatively correlated with mean annual temperature (MAT). Differences due to spatial and temporal factors are usually due to changes in land use types. Land use/cover change is the most direct result of human activities on soil and one of the main driving forces of the carbon cycle in the soil ecosystem [12, 13]. Conant [14] discussed the differences in carbon stocks of grassland ecosystems under the influence of land use change. Liu et al.’s [15] study indicates that the SOC content under plantations and shrubland was significantly higher than that under other land uses in a dry valley in Sichuan province, Southwestern China. A large number of studies have reported on the differences in SOC under different land use types [16-18]. But there are few quantitative studies on the correlation between land use and SOC. In this paper, the land use composite index (La) is used to quantify land use and analyze the degree of land use development and its relationship with SOC.
SOC changes have spatial scale effects, and geographic variability causes spatial heterogeneity in SOC. In recent years, research on soil organic carbon (SOC) at the regional scale in China has mainly focused on the national scale [19, 20] and key ecological regions (such as the Qinghai-Tibet Plateau [21, 22] and the Northeast black soil region [23, 24]). Provincial studies are mostly confined to large agricultural provinces such as Jiangsu [25] and Sichuan [26], and most of them use single-time section data [15]. However, as a transitional zone between the north and south of China (warm temperate zone - North subtropical zone) and the Yangtze River/Huaihe River basin, there are few studies on the geographical differentiation of SOC driving forces in Anhui Province. Therefore, Anhui Province was selected as the research area to analyze the spatial distribution pattern of soil organic carbon and its influencing factors in 1985 and 2018. The temporal and spatial changes of the soil organic carbon pool and its main controlling factors in Anhui Province were studied through a comparative analysis over the years. We adopted “3S” technology (Remote sensing, Geography information systems, Global positioning systems), correlation analysis, and Principal component analysis to assess the spatial and temporal changes in soil organic carbon density (SOCD) in the province and identify the factors influencing the changes in SOC content. Further, combined with Principal component analysis, the main factors controlling SOC content changes in Anhui Province were screened from the influencing factors.
Materials and Methods
Overview of the Study Area
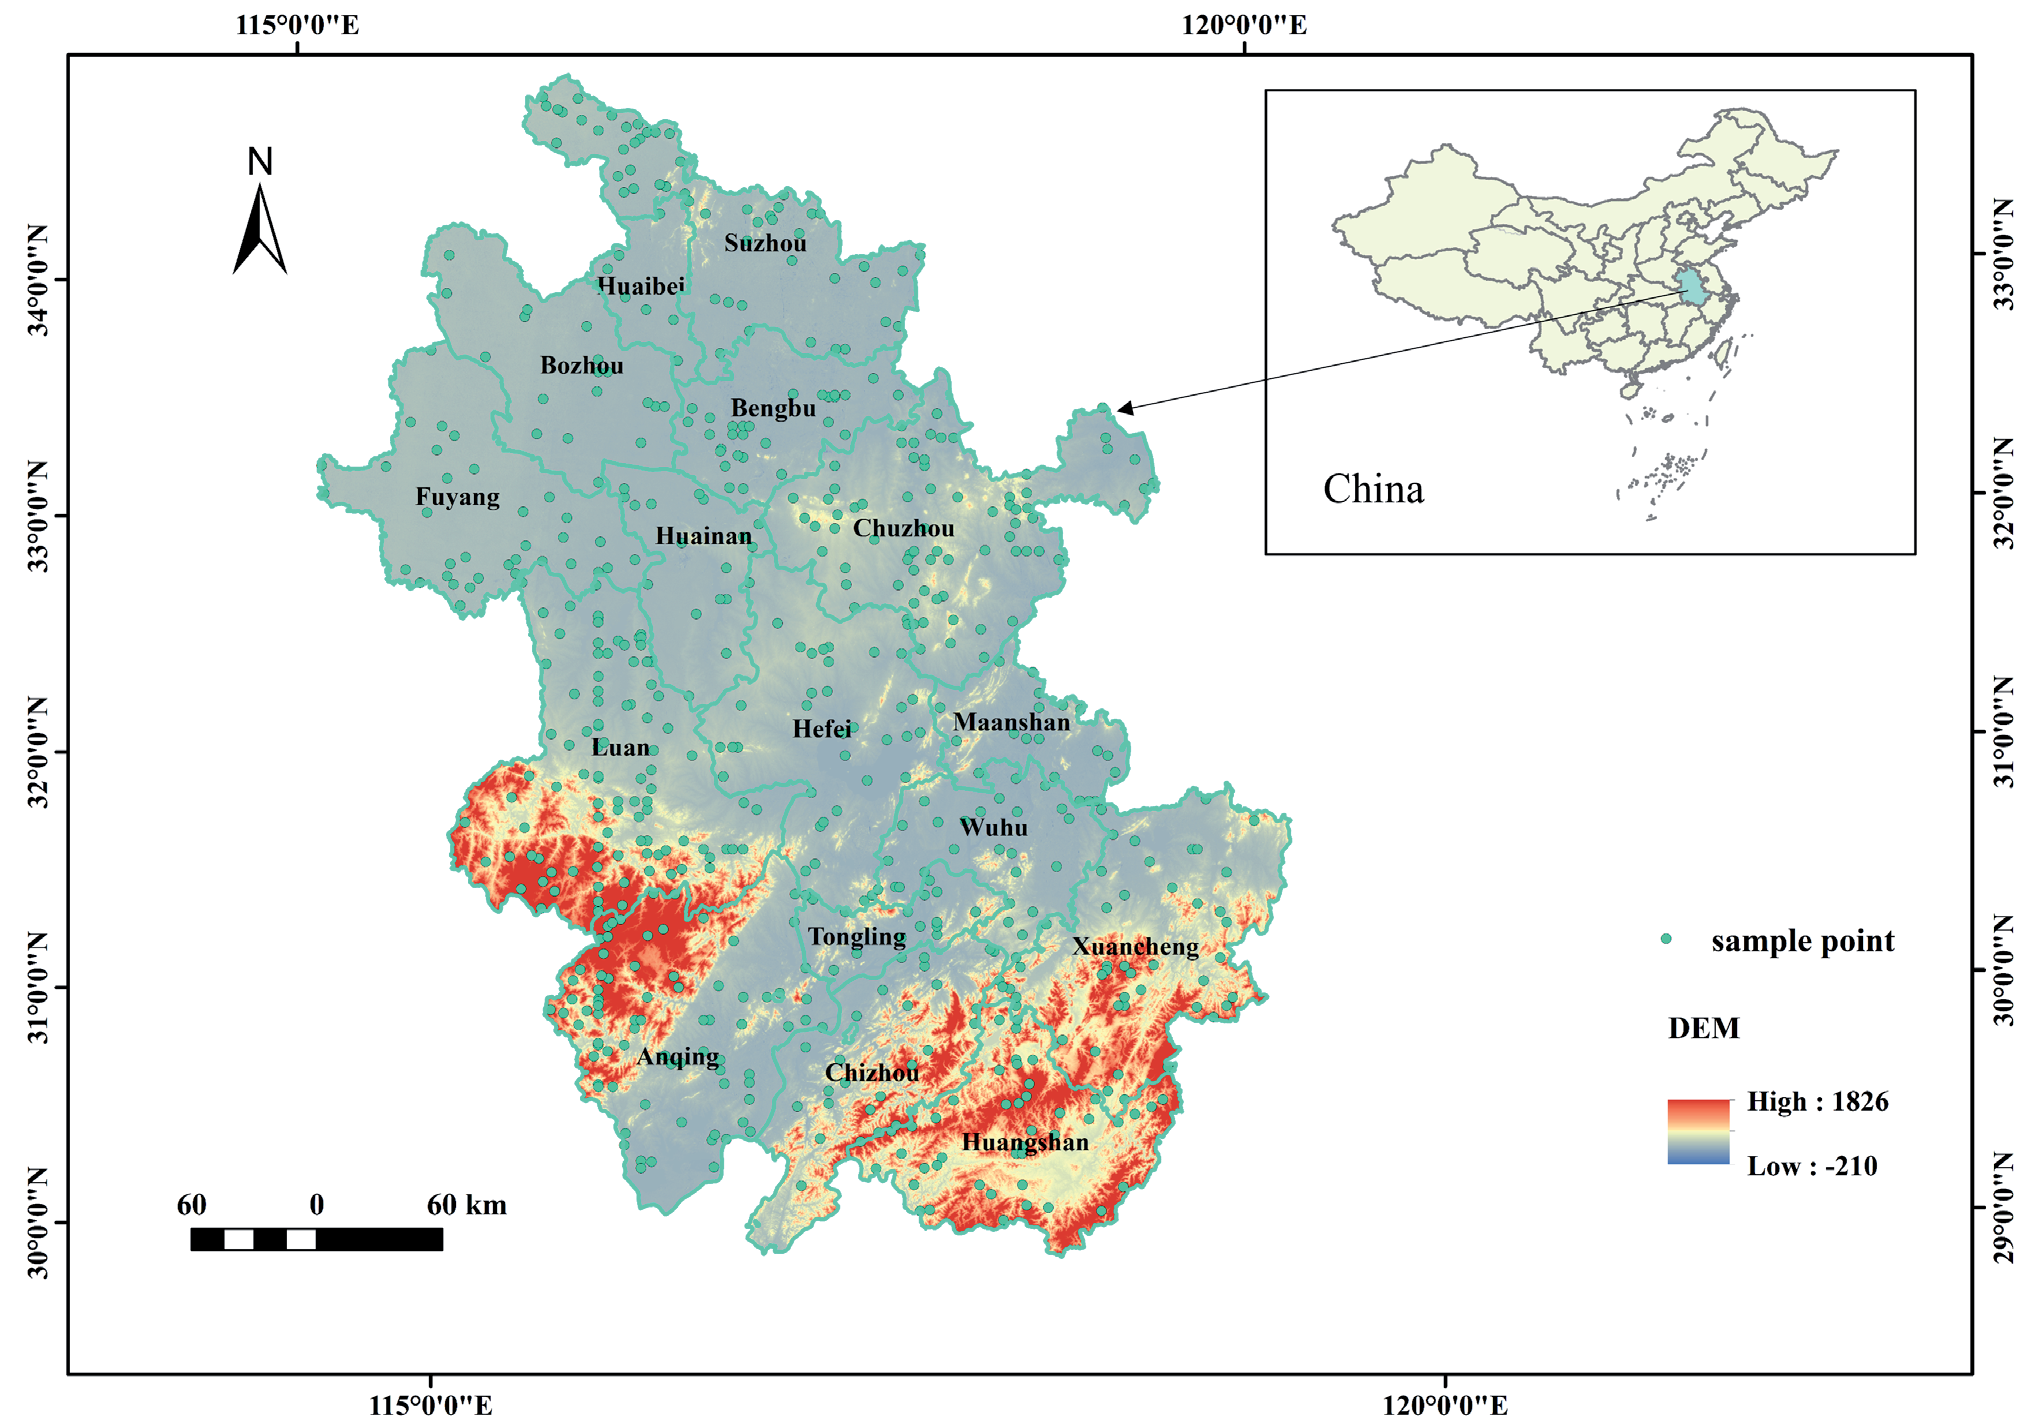
The present study was carried out in Anhui Province, located in southeast China, spanning the middle and lower reaches of the Yangtze and Huai Rivers (Fig. 1; 29°41’ to 34°38’ N and 114°54’ to 119°37’ E). The northern part of Anhui Province has a temperate monsoon climate, while the central and southern parts have a subtropical monsoon climate. The province has an average temperature of 10~19℃ and an annual precipitation of 773~1670 mm. The unique geographic location, diverse geomorphologic types, and complete soil-vegetation zones display subtropical characteristics. In order to facilitate analysis, this study used ArcGIS to weigh and average soil organic carbon content data according to depth (0~5cm, 5~15cm, 15~30cm) to obtain soil surface SOC content data (0~30cm) in Anhui Province in 1985 and 2018. Further, the ArcGIS 10.6 software was used to extract the SOC content data, remove the outliers, and obtain 618 sample data points of the same spatial location in 1985 and 2018.
Data Source
In this paper, four composite variables, including soil properties, topography, remote sensing, and meteorology, were selected to analyze the change mechanism of soil organic carbon content in Anhui Province in 1985 and 2018. Soil characteristics include bulk density (BD) and pH value. Topographic factors include elevation and slope. The remote sensing data include the normalized difference vegetation index (NDVI) and land use. Temperature and precipitation are climate factors. The sources and functions of the above data are detailed in Table 1. It is important to note that NDVI serves as a dynamic vegetation indicator, with annual time-step changes capturing long-term trends (1 km resolution suffices for detecting macro-scale phenological shifts). Topography acts as static or slow-changing constraints (e.g., slope stability), where finer resolution (30 m) improves accuracy in identifying erosion-prone zones without inducing temporal inconsistency.
Calculation of Soil Organic Carbon Density and Soil Organic Carbon
The following formula was used to determine the soil organic carbon density (SOCD) [27]:
Where SOCD is soil organic carbon density (kg·m-2), SOCi is the soil organic carbon content of layer i (g·kg-1), γi is the soil average bulk density of layer i (g·cm-3), and Hi is soil layer thickness (cm). The depth of soil analyzed in this study was 30 cm.
In this study, the soil type method was used to estimate SOC, and the formula is as follows:
Where SOC represents organic carbon reserves (t) in a certain region, Si represents the area (m2) of the map patch of a certain soil type; n represents the number of soil type patches in the GIS layer in the region.
Land Use Composite Index (La) Calculation
La is used to characterize the quantitative characteristics of land use development intensity in a specific period of time [28]. In this study, the degree of land use was divided into four grades, and the grading index was assigned (Table 2). La is mainly based on land and nature. The relative change of state is determined, taking into account human activities and environmental factors. A larger La means a higher degree of land use. La includes both regional economic factors (construction land area) and environmental factors (forest land and grassland area). Based on the classification index and land use area statistics, the land use degree in different stages of the study area was calculated and evaluated by the land comprehensive use index. The detailed calculation formula is as follows:
Table 1.
Various types of data sources.
Table 2.
Grading index of land use types.
| Land use type | Bare land | Forest land, grass land bush | Cultivated land | Construction land |
|---|---|---|---|---|
| Classification index | 1 | 2 | 3 | 4 |
Where La is the comprehensive index of land use; Ai is the classification index of land use type; Ci is the area ratio corresponding to Ai.
Statistical Analysis
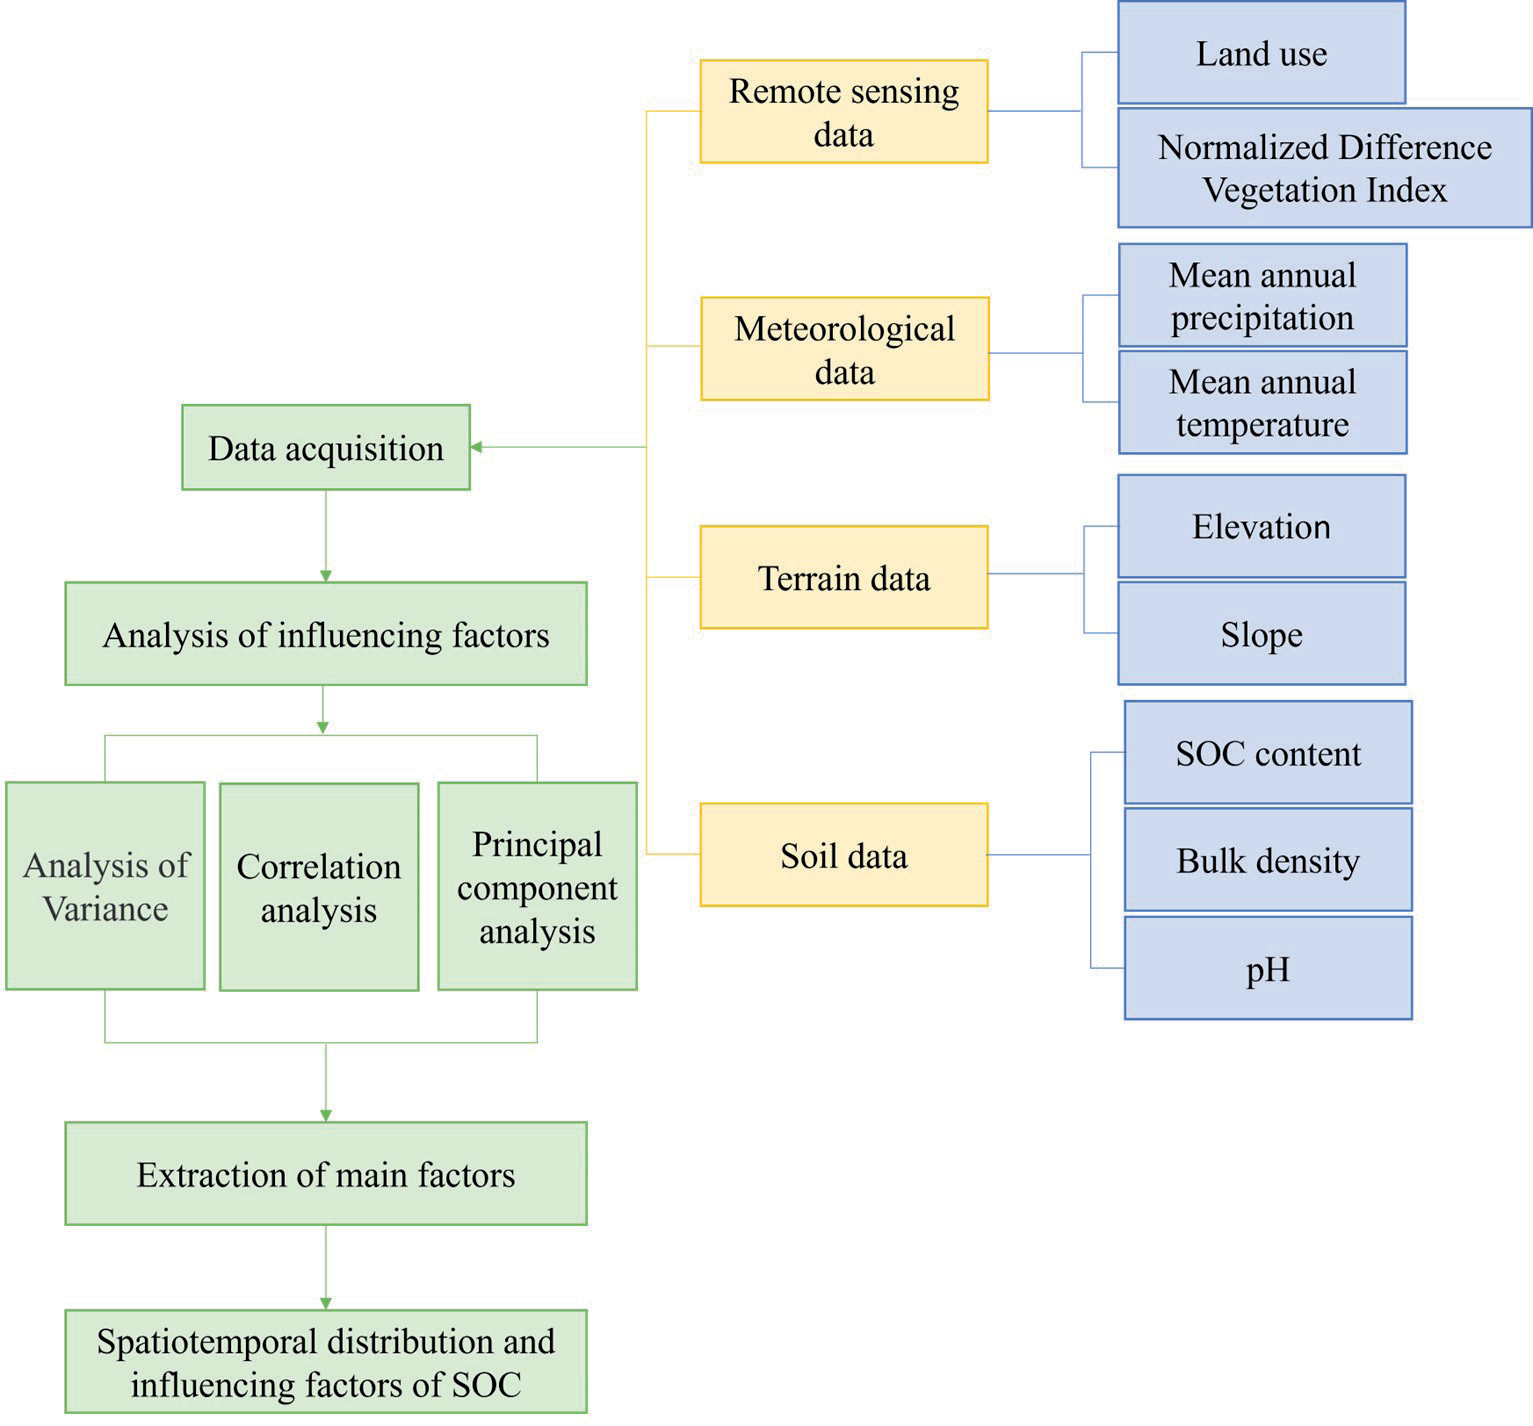
ArcGIS 10.6 was used for basic map generation, projection conversion, layer overlay, cropping, and output based on soil, remote sensing, topographic, and meteorological data. Microsoft Excel 2021 was used for statistical analysis, Origin 2023 was used for data plotting, IBM SPSS Statistics (SPSS 27.0 for Windows) was used for Spearman correlation analysis, and RStudio was used for principal component analysis. One-way analysis of variance (ANOVA) was performed to assess the differences in SOCD values under the influence of various factors. The least significant difference method (LSD) was used to compare the variances. The technology roadmap in this article is shown in Fig. 2.
Results
Spatial Distribution of Soil Organic Carbon Density
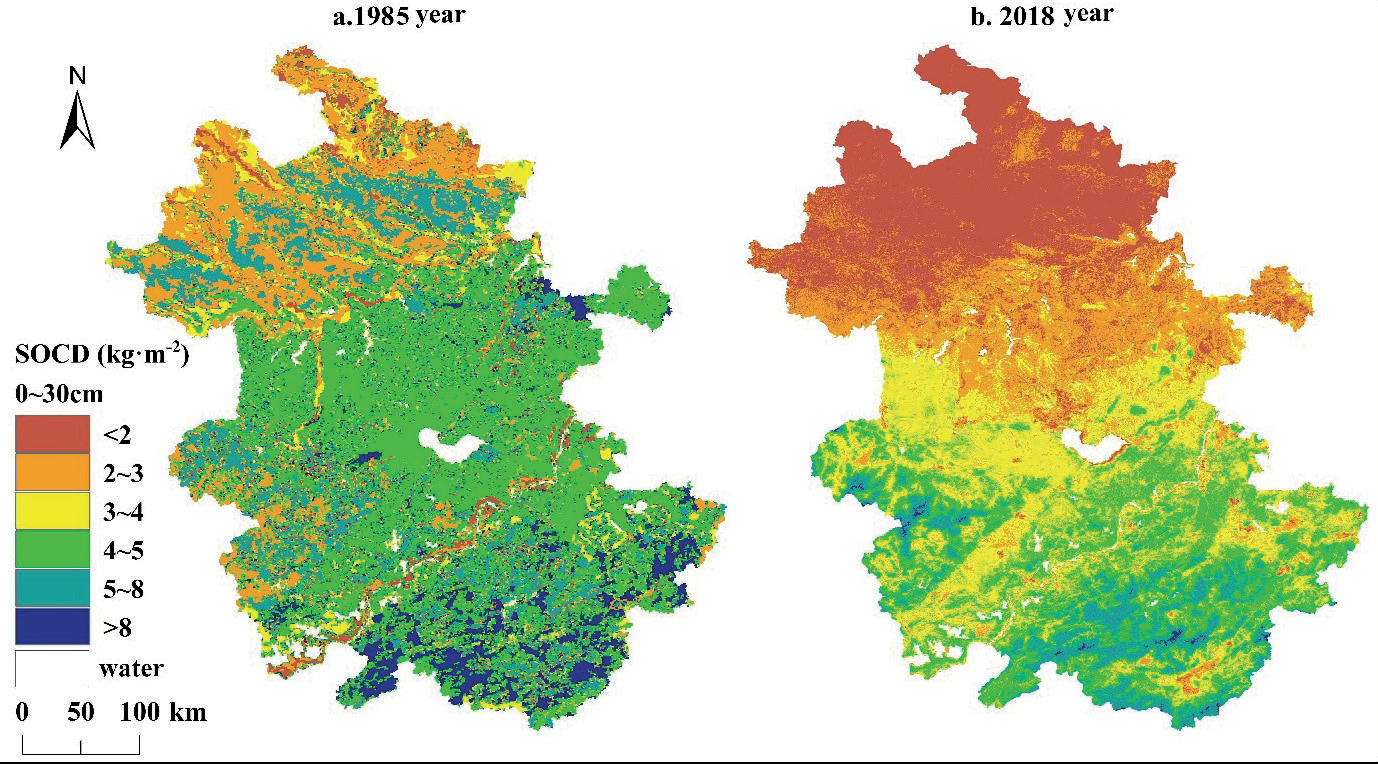
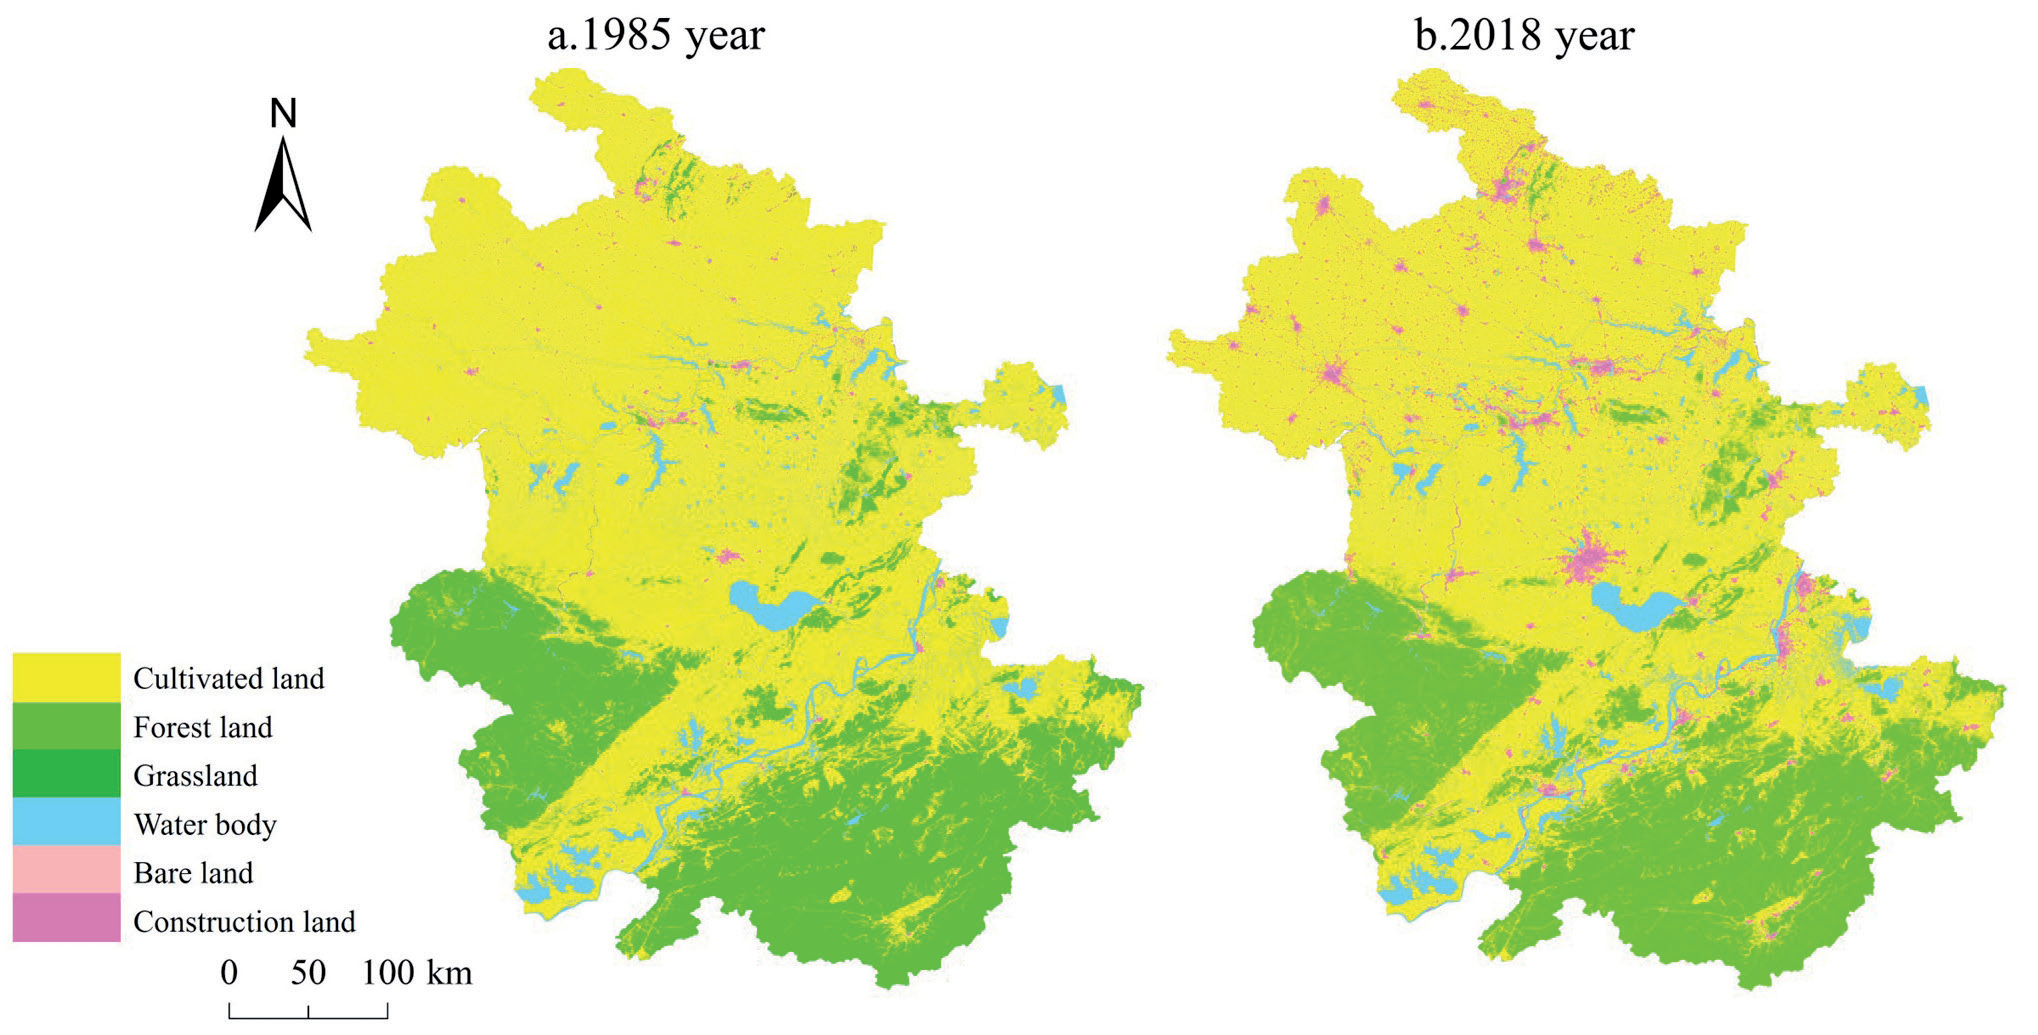
The distribution of SOCD in Anhui Province is shown in Fig. 3. Compared with 1985, 2018 showed a decrease in SOCD in this region. Compared with 1985, SOCD in 2018 was mainly concentrated in the range of 2.0~5.0 kg·m-2. Overall, the spatial distribution of SOCD in Anhui Province was higher in the south and lower in the north, and the SOCD in the southern mountainous area was significantly higher than that in the northern and central areas. It can be seen from Fig. 4 that the northern and central parts of the study area are mostly plain, mainly cultivated land.
Effects of Various Factors on Soil Organic Carbon Content
The SOC content and influencing factors of 618 sampling points obtained in 1985 and 2018 were linearly fitted. The linear fitting of soil bulk density and SOC content is shown in Fig. 5. The linear fitting did not express the relationship between SOC content and BD in 1985, while the fitting in 2018 was better. In both 1985 and 2018, SOC content showed a negative correlation with BD (P < 0.01; r =-0.372 and -0.887, respectively). Meanwhile, SOC content showed a negative correlation with soil pH (Fig. 5), with correlation coefficients of -0.467 and -0.804 in 1985 and 2018, respectively (P < 0.01). The linear fitting in this study showed a significant positive correlation between SOC and elevation in 2018 (Fig. 6; r = 0.865, P < 0.01). Furthermore, the study identified a positive correlation between temperature and SOC content (Fig. 7). The present study showed a positive correlation between NDVI and SOC content in 1985 and 2018 (Fig. 8). Fig. 8 showed that SOC content was negatively correlated with La to varying degrees in 1985 and 2018 (P < 0.01; r =-0.121 and -0.463, respectively).
Principal Component Analysis of Factors Influencing Soil Organic Carbon
There are many natural factors influencing SOC in Anhui Province, and there are interactions among them. In this study, 8 factors [X1 (bulk density), X2 (pH), X3 (elevation), X4 (slope), X5 (precipitation), X6 (temperature), X7 (NDVI), X8 (La)] were selected as independent variables to extract the main factors influencing the changes in SOC. Principal component analysis was performed on SOC content and influencing factors of 618 sampling points obtained in 1985 and 2018. PCA is based on data from 1985 and 2018, and the KMO and Barlett tests are shown in Table 3. The KMO values in 1985 and 2018 were greater than 0.6, and the significance was less than 0.05, which indicated that both the 1985 and 2018 data were suitable for principal component analysis.
Fig. 5.
Relationship between SOC content and bulk density and pH in Anhui Province in 1985 (a) (c) and 2018 (b) (d).
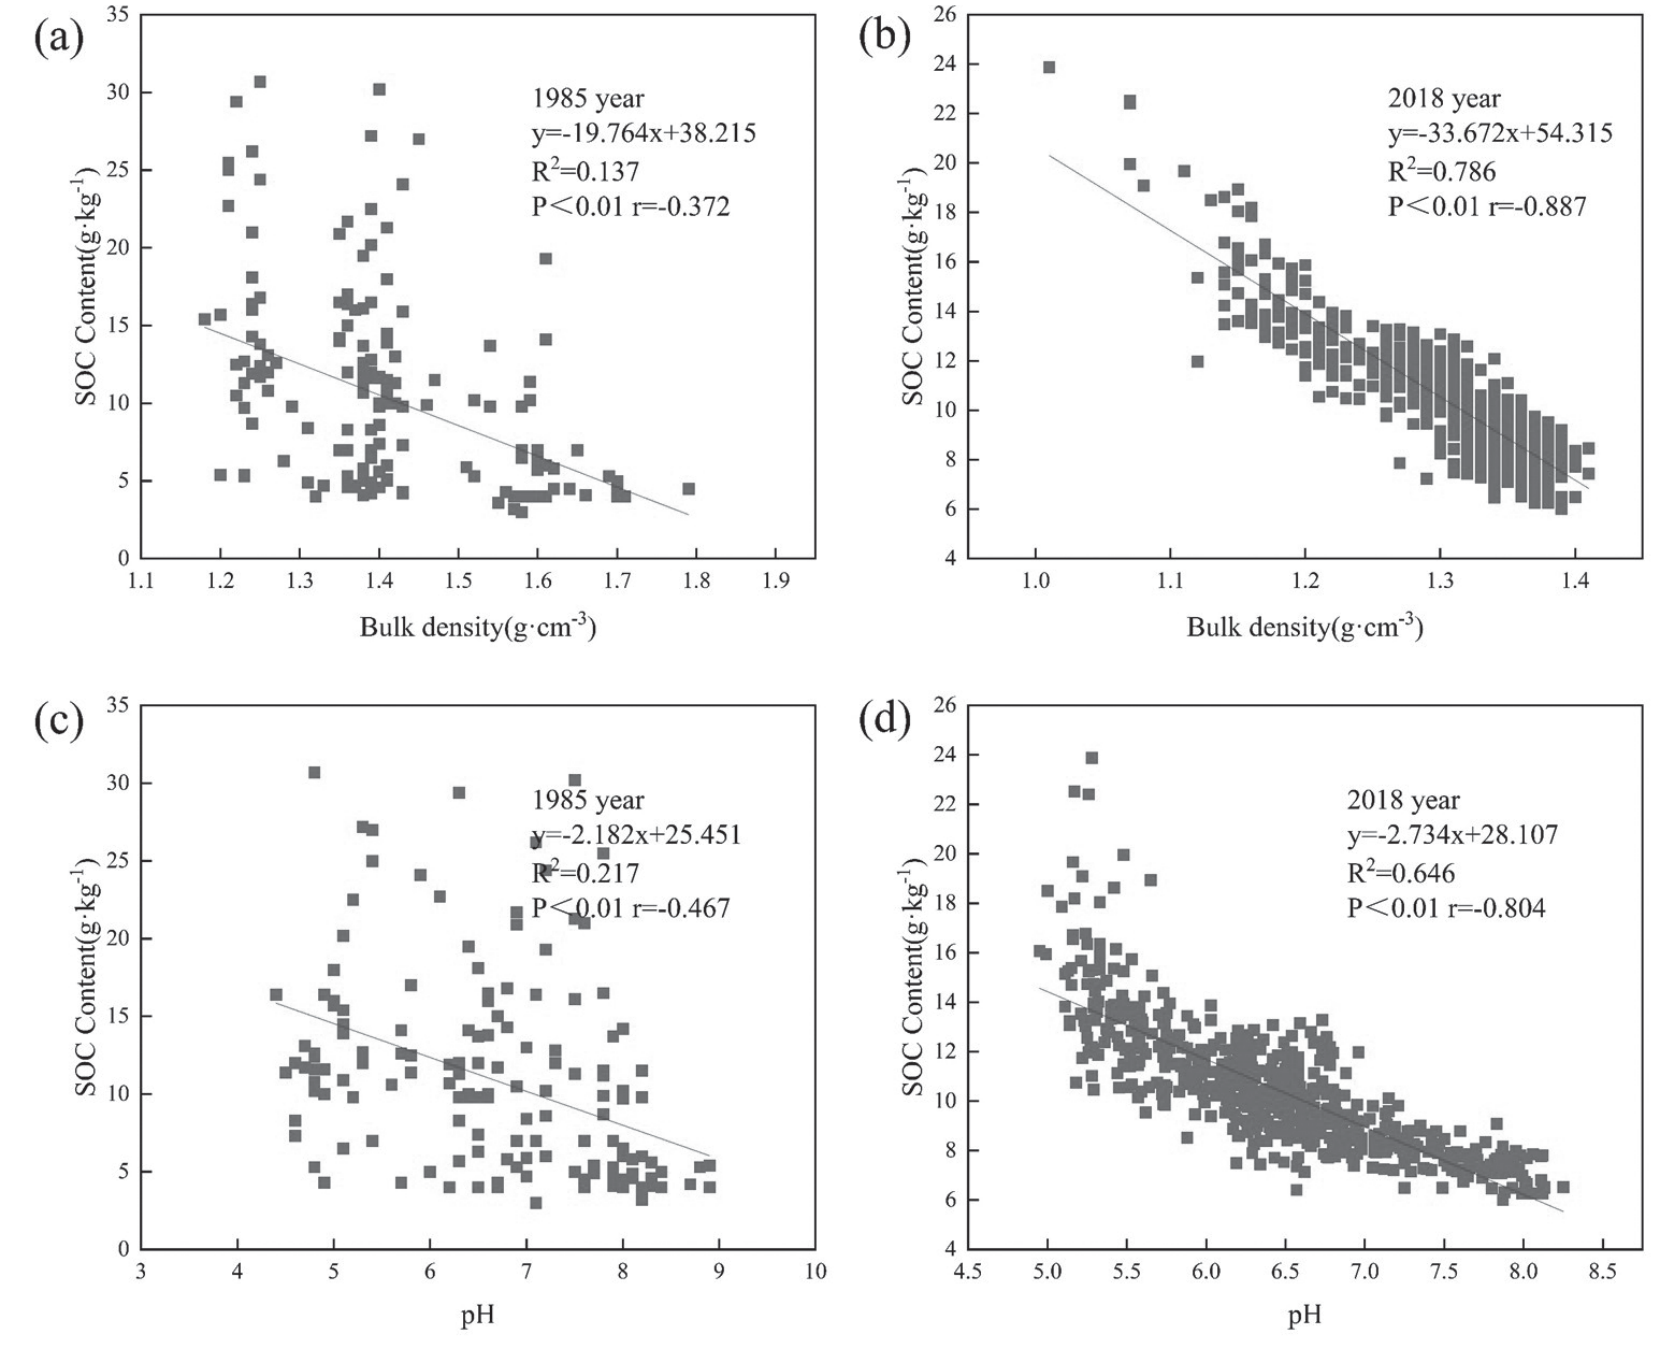
Fig. 6.
Relationship between SOC content and elevation and slope in Anhui Province in 1985 (a) (c) and 2018 (b) (d).
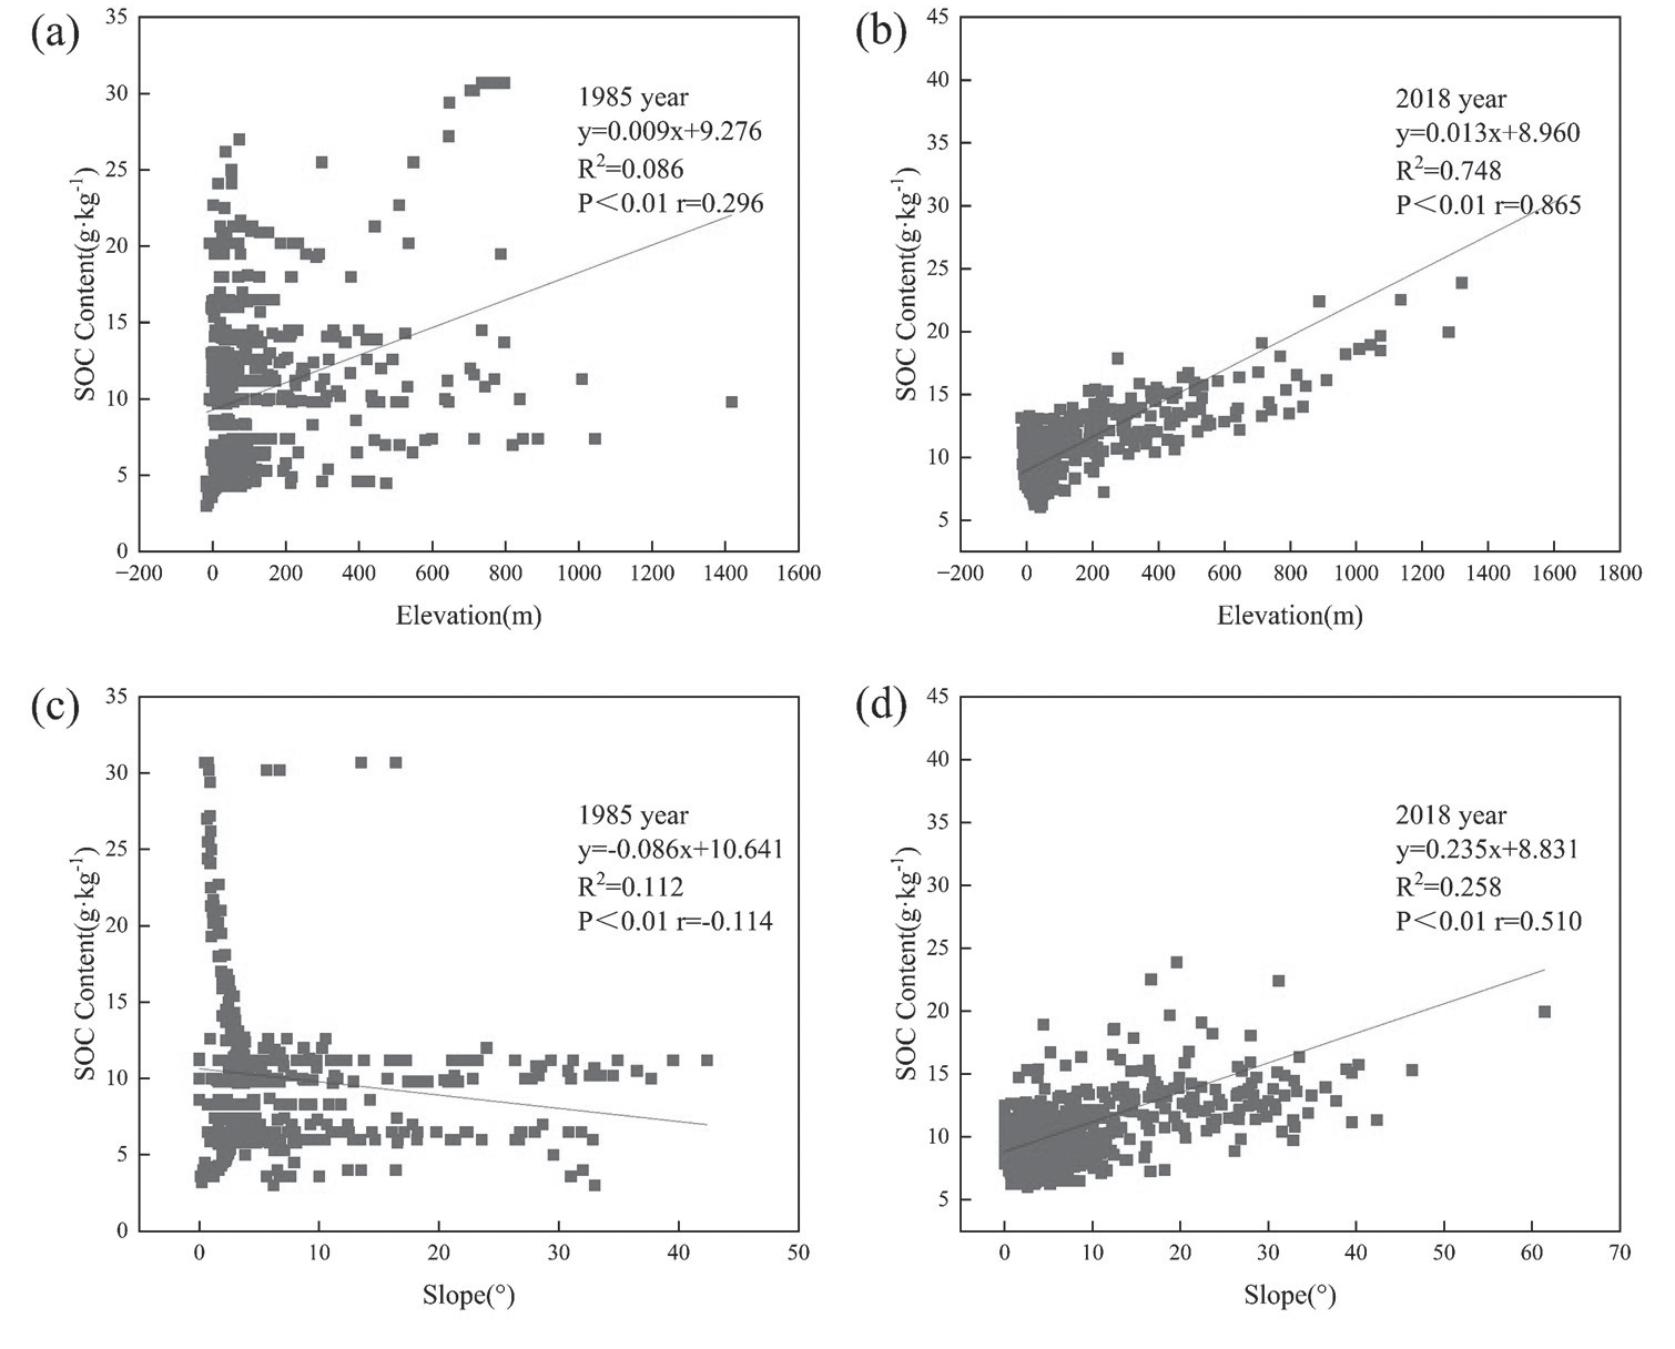
Fig. 7.
Relationship between SOC content and temperature and precipitation in Anhui Province in 1985 (a) (c) and 2018 (b) (d).
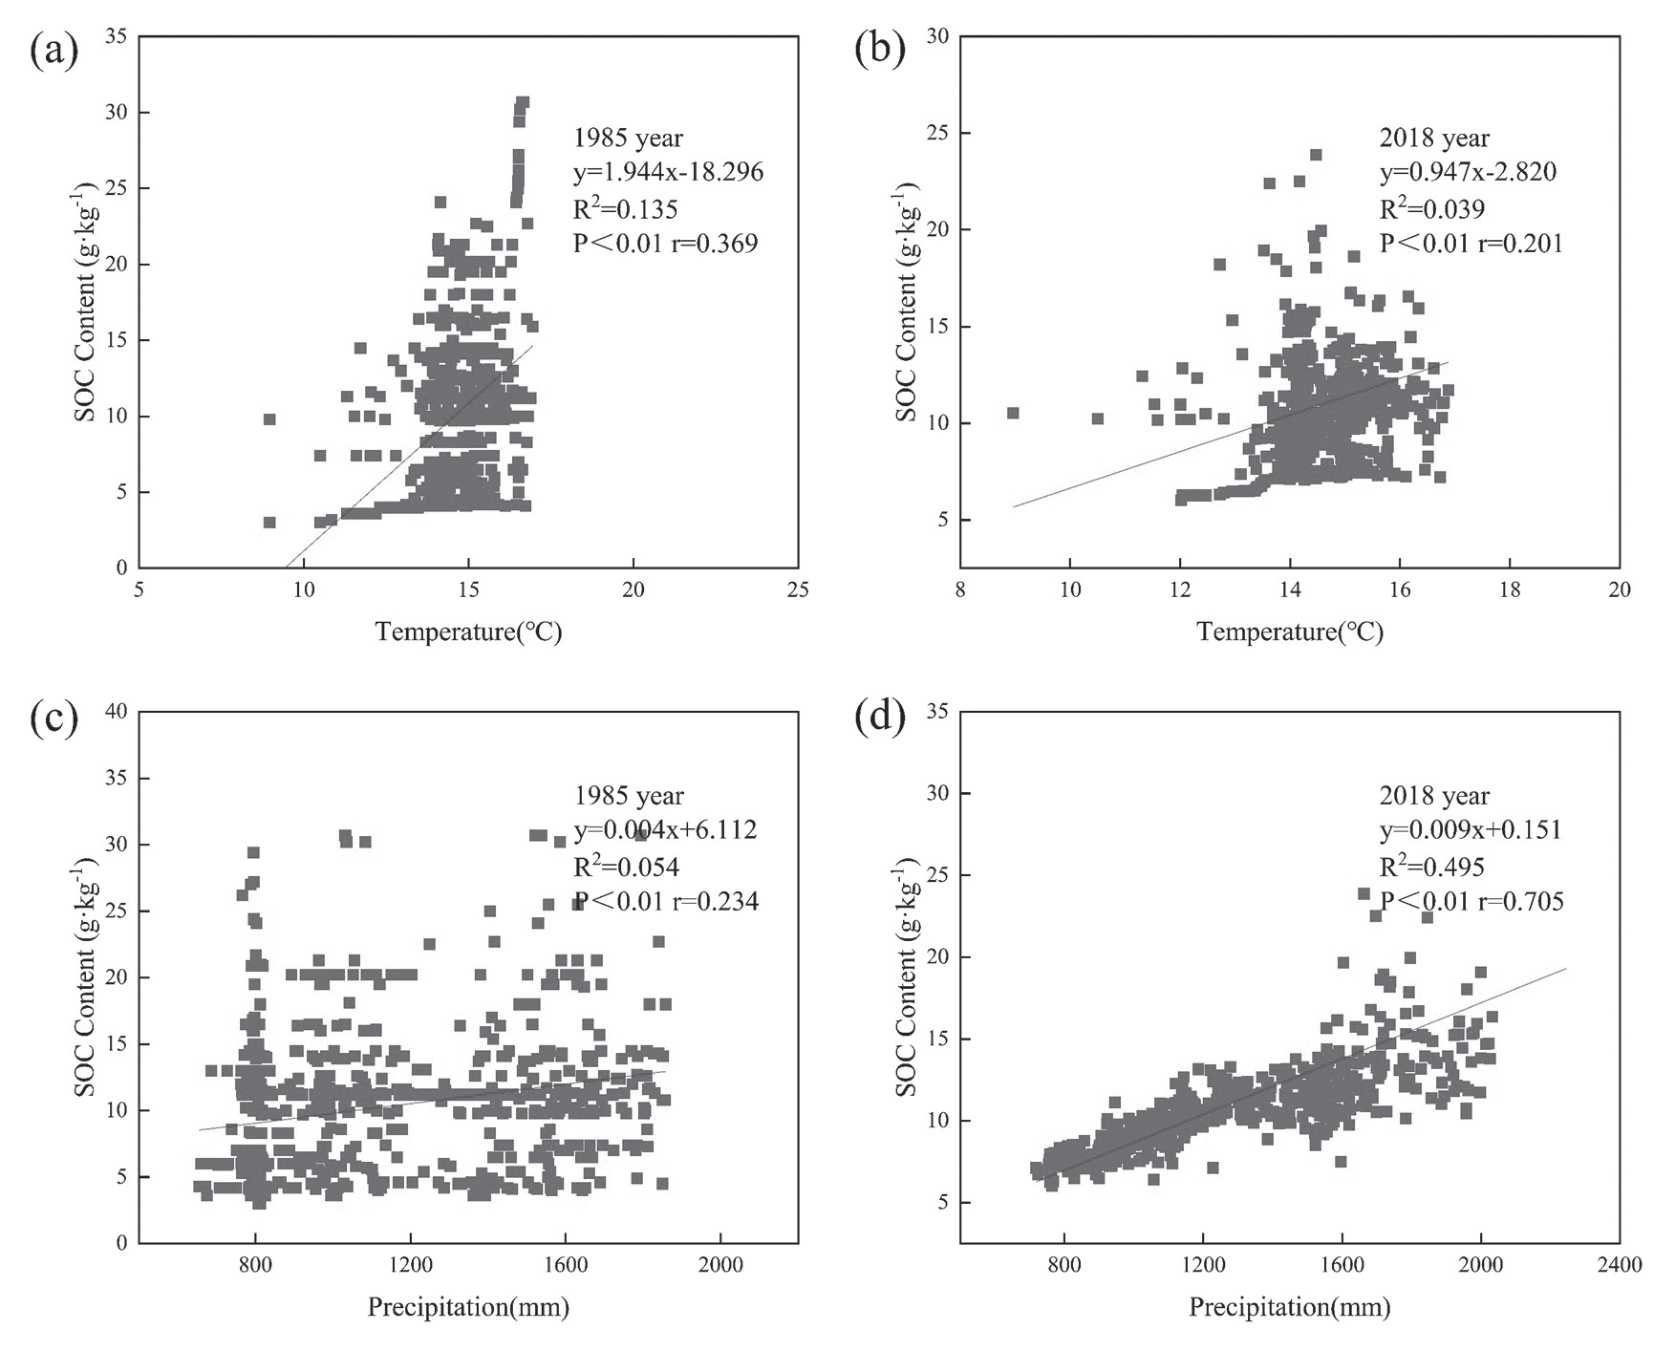
Fig. 8.
Relationship between SOC content and NDVI and La in Anhui Province in 1985 (a)(c) and 2018 (b)(d).
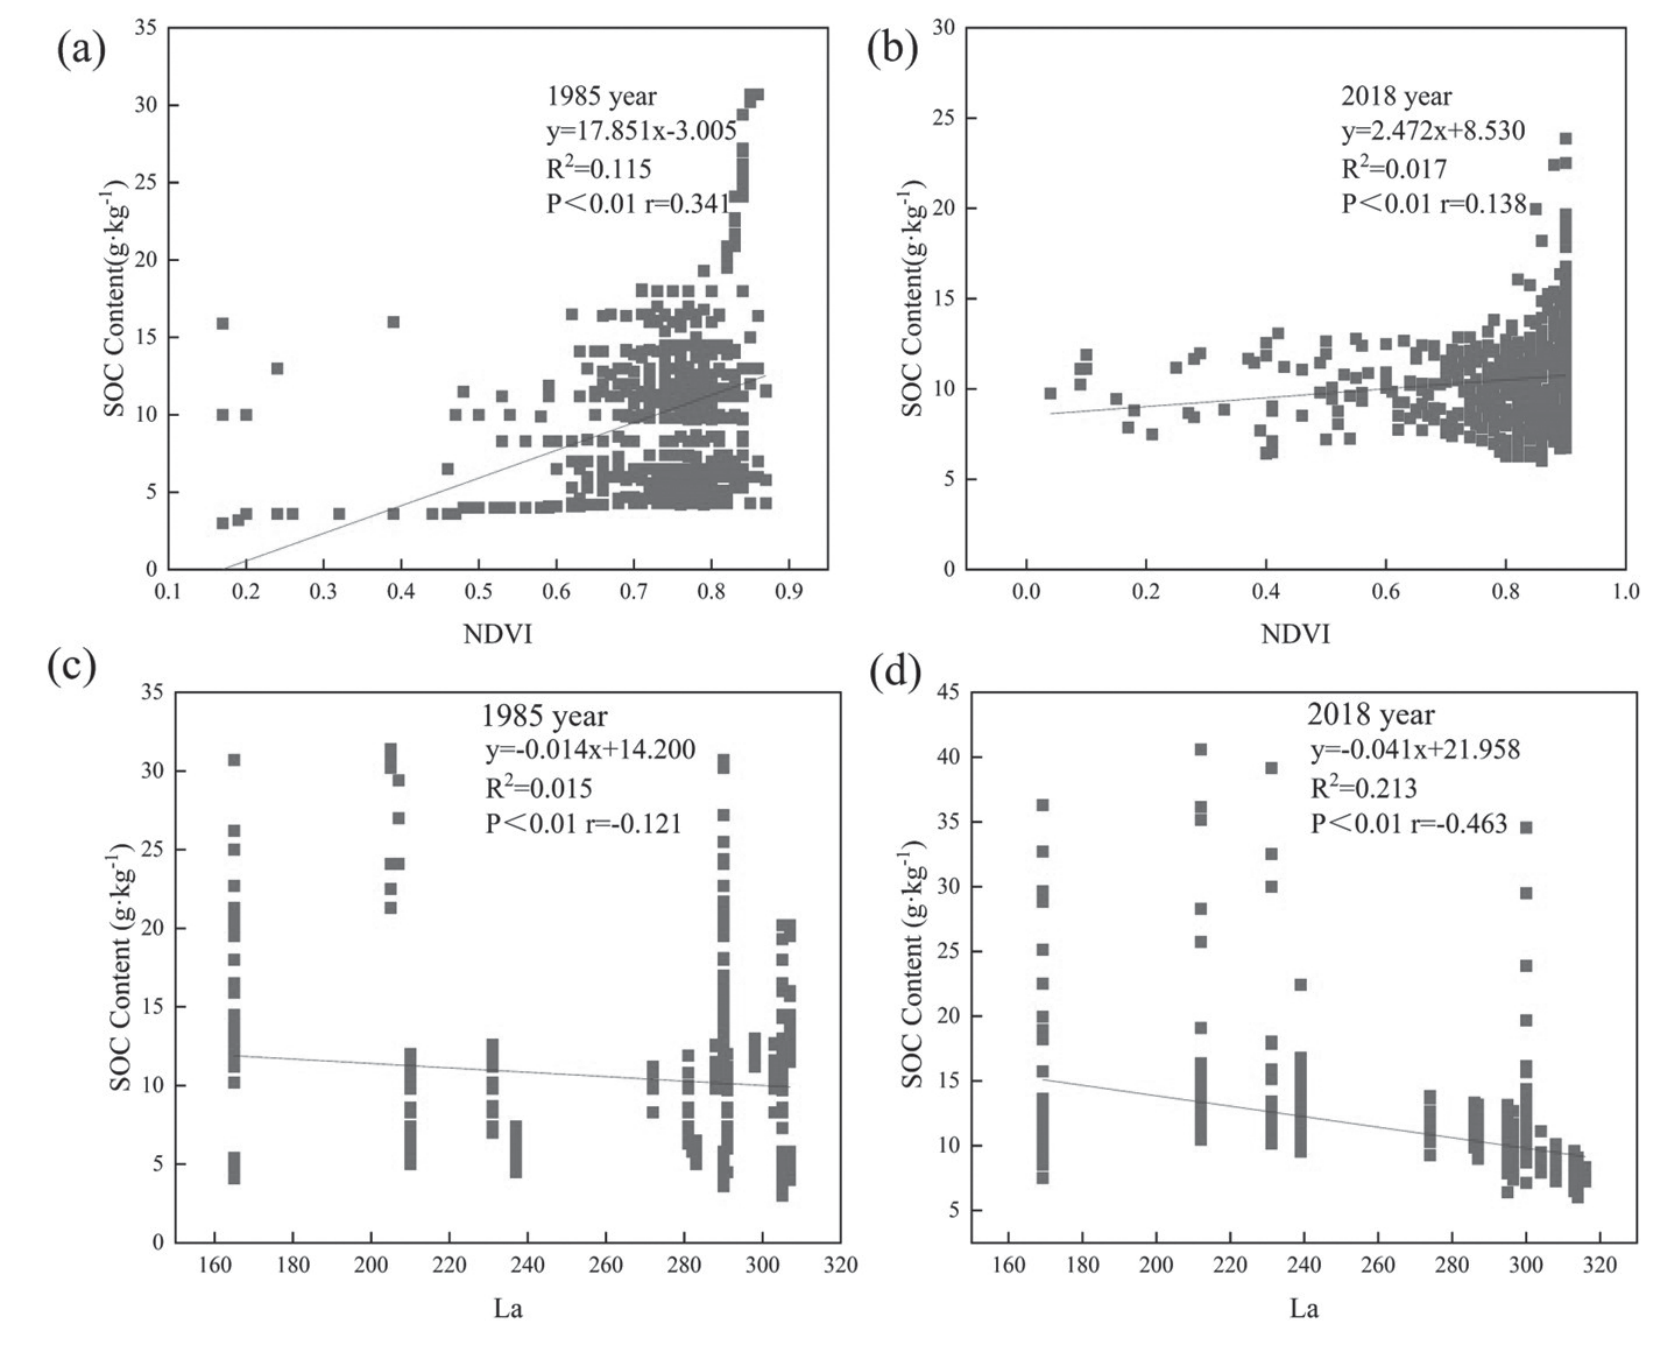
Table 3.
Results of the KMO test and the Barlett test.
| Year | 1985 | 2018 | |
|---|---|---|---|
| Kaiser-Meyer-Olkin | 0.602 | 0.747 | |
| Bartlett’s Test of Sphericity | Approx. Chi-Square | 499.015 | 4468.416 |
| Degree of freedom | 28 | 28 | |
| Significance | <0.001 | 0.000 | |
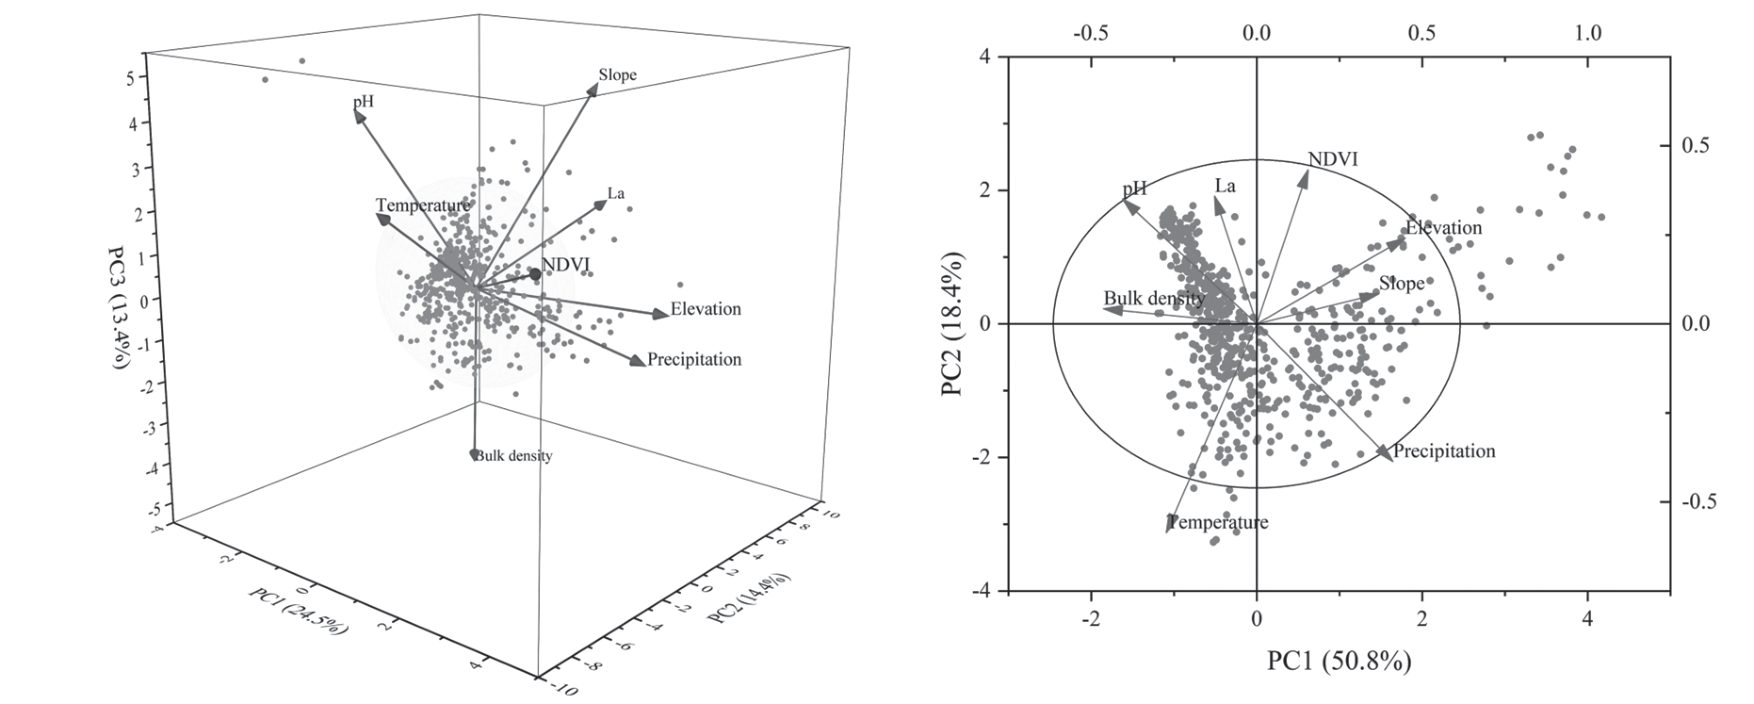
The PCA parameters of each impact factor are shown in Table 4. Further, three principal components were extracted from the data in 1985, and their cumulative contribution rate was 52.270%. In 2018, two principal components were extracted, and their cumulative contribution rate was 69.156%. These observations are consistent with the results shown in Fig. 9. The findings revealed that the cumulative contribution rate in 2018 was higher than that in 1985, indicating that the 2018 data more comprehensively explain the changes in SOC.
The relationship between the factor load coefficient and principal component coefficient revealed that each influencing factor’s weight ratio differed on the principal component. The first principal component in 1985 explained 24.484% of the variance, and the weight coefficients of elevation and precipitation were significantly higher than the other indexes (0.787 and 0.751, respectively). The second principal component explained 14.433% of the variance, with La demonstrating the greatest weight. The third principal component explained 13.354% of the variance, with the bulk density showing the most significant weight. In 2018, the first principal component explained 50.776% of the variance, with bulk density "elevation" precipitation, and pH accounting for the greatest weight. The second principal component in 2018 explained 18.380% of the variance, with temperature demonstrating the greatest weight. The results of principal component analysis in 2018 mainly showed the effects of soil physicochemical properties and rainfall runoff on SOC.
Discussion
In natural ecosystems, soil organic carbon (SOC) levels are determined by the net balance between carbon inputs and outputs. This balance is influenced by various factors, including climate conditions, inherent soil physico-chemical characteristics, and topographic features [29]. This study revealed the North-South differentiation of SOC in Anhui Province, which was lower in the north and higher in the south (Fig. 3). The necessity of provincial-scale analysis is highlighted. It can be seen from Fig. 3 that SOCD in 2018 showed a significant decline compared with 1985 on the whole. Ploughing, fertilization, deep ploughing, and long-term tillage in the process of agricultural planting affect the dynamic balance of soil carbon, especially the application of organic fertilizer. Long-term use of organic fertilizer will reduce soil fertility, have a serious impact on soil quality, reduce soil water storage, weaken soil water holding capacity, and accelerate the decomposition of soil carbon. In the southern part of the study area, the altitude is higher. Due to the influence of rainfall and runoff, the high-density aggregates are decomposed into small-density aggregates, which are eroded and washed by water through the influence of runoff [30]. Therefore, the high value of SOCD decreases significantly. From Fig. 3 and Fig. 1, we can find that the spatial distribution of SOCD in Anhui Province was consistent with its topographic and geomorphologic characteristics. Specifically, SOCD in the mountainous areas was higher than that in the plains. Several studies have shown that SOCD or soil organic carbon storage increases with elevation in mountainous terrains [31]. Lower temperatures and slower soil organic matter decomposition rates at high elevations probably result in greater accumulation of SOC content than other land cover types at lower elevations [32, 33]. Moreover, the mixed land cover at high elevations sequesters a sufficient amount of carbon in the soil [34].
Table 4.
Principal component analysis table of each impact factor.
The linear fitting results of SOC content and various influencing factors are shown in Fig. 5, Fig. 6, Fig. 7 and Fig. 8. Negative correlations between SOC concentration and bulk density have been demonstrated in previous studies [35, 36]. Soil pores function as conduits for soil moisture and air circulation, directly influencing the distribution of vegetation root growth and soil microbial activities [37]. Fig. 5 revealed that the SOC content decreased with an increase in pH, similar to the reports by Andersson et al. [38]. Typically, SOC content decomposition and stability are related to soil pH. The microorganisms are more active in alkaline soils, and the SOC content is lower [39]. On the other hand, acidic soils are not conducive to microbial activity and result in lower soil carbon emissions and higher SOC content. Besides, the relatively high pH accelerates the decomposition of SOC content, reducing its storage [8]. Elevation and slope are important topographic factors influencing land use distribution and vegetation types [40]. With a gradual increase in elevation, the temperature and precipitation decrease. Accordingly, the soil texture changes, the organic matter decomposition rate slows, and problems such as soil material loss occur, ultimately affecting SOC content [41]. Raich et al. [42] showed that the accumulation of soil organic carbon (SOC) at higher elevations may be partially attributed to decreased temperatures and enhanced moisture levels as elevation increases. Other studies have made similar conclusions [43]. Meanwhile, the impact of soil erosion on SOC probably resulted in a negative correlation between slope and SOC in 1985. This is consistent with the conclusion of Hu et al. [44]. Due to the low temperature and heavy precipitation in areas with high slopes, surface runoff gets easily induced, and the aggregates on the soil surface get destroyed. In short, with the aggravation of soil erosion, soil quality decreased, resulting in SOC loss [45]. However, a positive correlation was observed between slope and SOC content in 2018. This conclusion may be related to the topography of Anhui Province. In the northern and central parts of Anhui Province, flat land and gentle slopes dominated, while in the southern parts, steep slopes dominated. The low SOC in the central and northern regions may be due to the effects of various agricultural measures such as re-tillage, deep plowing, and tilling of cultivated land on soil quality. Unlike provinces with a single climate zone, such as Yunnan [46], SOC content is positively correlated with temperature. With the increase of temperature, vegetation growth and biomass increased, which provided a good material basis for SOC content accumulation [47]. At the same time, the temperature is low, the microbial activity is weakened, and the speed of decomposition of residues and microorganisms is slow, limiting the accumulation of SOC content [48]. On the other hand, SOC content was positively correlated with precipitation (Fig. 7), consistent with previous reports [49]. Abundant precipitation and warm climate are conducive to the growth of plants and promote the accumulation of SOC content. Research has pointed out that soil has a water threshold [50], and an increase in the frequency of short-term precipitation significantly increases soil microbial biomass [51] and unstable organic carbon components, increasing the SOC content. NDVI is a factor that impacts vegetation coverage, leaf area index, biomass, and productivity. It effectively identifies vegetation growth status and is a key indicator of regional vegetation change [52]. In general, SOC content increases with an increase in vegetation cover. Vegetation cover mainly helps microorganisms to release nutrients to the soil by raising the dead leaves and underground roots, leading to an accumulation of SOC content [53]. In addition, the spatial distribution of NDVI was higher in the south and lower in the north. This observation indicated that the impact of NDVI on SOC content was more obvious in the south due to the higher terrain, which restricts human activities and results in high vegetation coverage. The plant roots, in turn, provide open pores on the ground, which increases the infiltration of surface runoff and the infiltration of precipitation [54]. Fig. 8 shows that La and SOC content are significantly negatively correlated, indicating that the lower the degree of land use development, the higher the SOC content. Studies have shown that switching from one type of land use to another can lead to imbalances in natural resources and agricultural biodiversity [55].
Soil is a complex natural body, and its formation is influenced by factors such as parental material, climate, and geomorphology. Therefore, the spatial variability in SOC is quite complex and is largely affected by various natural (soil properties, topography, temperature, precipitation) and human factors, which directly or indirectly regulate the changes in soil carbon pool [56, 57]. The results of principal component analysis showed that the main factors affecting SOC content in 1985 were elevation "precipitation" La and bulk density. The main factors of SOC vary with time. The main factors affecting SOC content in 2018 were elevation, precipitation, pH, and bulk density. Fig. 1 shows the topography of Anhui Province, which shows a transition from south to north and decline from mountains to plains, with elevations ranging from -210 to 1826 m. Studies have shown an increase in SOCD with elevation [34]. Generally, the differences in altitude affect temperature and dominant vegetation types, indirectly regulating SOCD and soil organic carbon storage by influencing the amount of vegetation litter and soil microbial activity. In the Qinghai-Tibet Plateau, Zhao et al. [58] found a good positive correlation of SOCD with the increase in altitude. Researchers attributed this change to the difference in climate factors among regions at different altitudes. Zhang et al. [59] further identified elevation and vegetation types as the main factors controlling SOC spatial distribution in the mountainous areas of southwest China. With the increase of elevation, the growth of soil microorganisms increased, and the turnover time of microorganisms decreased, which led to the increase of soil organic carbon storage [60]. Enrichment of plant types increases plant growth, which increases SOC accumulation. Moreover, plant type influences microbial communities, which in turn influence the rate of SOC decomposition [61]. On the other hand, precipitation affects the decomposition of SOC by regulating the ratio of solid, liquid, and gas components of the soil. Most researchers believe that precipitation has a positive effect on SOC [62, 63]. The variations in precipitation lead to changes in soil hydrological patterns, soil properties, plant growth processes, and, ultimately, SOC decomposition [64]. Soil fertility, moisture, and soil organic matter were positively correlated. However, the increase of SOC often means the decrease of soil bulk density, the increase of soil nitrogen content, and the decrease of pH value. The results of SOC in this paper are consistent with those of previous studies [41, 65]. Compared with 1985, the factor affecting SOC content changed in 2018 from La to soil pH. This may be the delayed effects of long-term agricultural management and soil degradation. With global warming, precipitation increases, land use and development intensities increase, and agricultural planting methods and fertilizer use have strong side effects on SOC, resulting in a decline in soil quality and a decrease in soil carbon productivity [66].
The objectives of this study were to: (1) analyze temporal and spatial changes in soil SOC density and storage in surface (0-30 cm) soils in 1985 and 2018 using a well-documented data set, and (2) screen out the main controlling factors affecting SOC content by analyzing the influencing factors of SOC content in both years. The aim of this study was to provide data support for regional soil carbon sequestration potential, soil fertility change, and agricultural production management decision-making in East China.
Conclusions
The present research analyzed the spatial distribution and spatio-temporal variations in the SOC pool density in Anhui Province. The approach selected eight influencing factors, such as topographic, meteorological, soil physical and chemical properties, and vegetation factors, to assess and clarify their influence on the SOC. Our correlation analysis revealed that SOC was negatively correlated with bulk density, soil pH, La, and temperature, but positively with elevation, slope, precipitation, and NDVI. Further analysis showed that the main factors influencing SOC were elevation, precipitation, La, and bulk density in 1985 and elevation, precipitation, pH, and bulk density in 2018.

