

Introduction
In the past three decades, rapid economic development, urbanization, industrialization, and population agglomeration caused by the siphoning effect of cities in China have caused serious atmospheric pollution [1-8]. When the new Ambient Air Quality Standard (GB 3095-2012) replaced GB 3095-1996 and was gradually implemented in China in 2013 [9], most regions and cities with excessively poor ambient air quality were affected by fine particulate matter (PM2.5, particulate matter with an aerodynamic diameter less than 2.5 µm). Statistical assessments show that, in 2013, only 4.1% of the 74 important cities in China implemented new ambient air quality standards up to the PM2.5 standard [10]. After nearly ten years of continuous effort by governments at all levels, many experts and scholars, and people worldwide, PM2.5 pollution has been greatly alleviated, and only 25.4% of 339 cities in China had PM2.5 concentrations exceeding the national standard in 2022 [11]. Overtime, PM2.5 pollution, as the most important type of atmospheric pollution, has gradually become a public health concern and has become a research focus of scholars and experts because of its complex composition, wide range of pollution sources, influencing factors that vary from place to place, and great harm to human health [2, 4-5, 12-20].
Because the particle size of PM2.5 is small, it can float in the air for a long time. In contrast, PM2.5 has a large specific surface area and strong activity, and its surface can adsorb many carbonaceous components (sometimes called carbonaceous aerosols), water-soluble ions, and chemical elements [17, 21], which can then be carried into the human body through the respiratory tract and cause great harm to the human body, resulting in widespread scientific attention [19, 22]. PM2.5 mainly originates from natural sources (such as soil dust, [5, 23]) and anthropogenic sources (such as biomass burning, vehicle exhaust, firework burning, and construction dust, [5, 23-25]). In the atmosphere, once adsorbed to PM2.5, elements are less likely to react with other substances, so they can remain adsorbed on the surface of PM2.5 for a long time. The contribution of each element to PM2.5 varies with different pollution sources, so the source of pollutants can be analyzed by identifying the characteristic elements in PM2.5. In the past, many experts and scholars have carried out many studies on the types, concentration levels, and sources of elements in PM2.5 and analyzed the sources of PM2.5 using models such as positive matrix factorization (PMF), chemical mass balance (CMB), and principal component analysis (PCA) [21, 25-26]. However, China has a vast territory, variable terrain, and different levels of economic development, and the developed regions (such as the Beijing–Tianjin–Hebei region [5, 19, 23, 27-29], the Yangtze River Delta region [5, 19, 23, 30-31], the Pearl River Delta region [5, 19, 23], etc.) and megacities [5, 32-40]) have attracted more attention than underdeveloped regions and smaller cities.
Nanchong City is a typical basin city, located in the northeastern Sichuan Basin and is the second most populous city in Sichuan Province. It is a typical agricultural city with fast development and a low level of industrialization. Its terrain slopes from north to south, with elevations between 888.8 and 256 meters. The urban area of the city is located in southern Nanchong City, with low elevations and extremely poor meteorological diffusion conditions for pollutants. The purpose of this study was to explore the pollution level, spatial and temporal variations, and sources of PM2.5 and elements in the urban and rural areas of Nanchong City to compensate for the shortage of domestic research on the sources and prevention of PM2.5 pollution in urban ambient air in the basin. The results of our study could provide insightful information and a scientific basis for the prevention and control of air pollution in basin cities and other types of Chinese cities in the future. The major objectives were as follows: (1) to determine the characteristics and sources of PM2.5, (2) to analyze the seasonal variations in PM2.5 in urban areas and rural areas, (3) to determine the degree of element enrichment in PM2.5, and (4) to determine the sources of elements in PM2.5.
Materials and Methods
Study Area
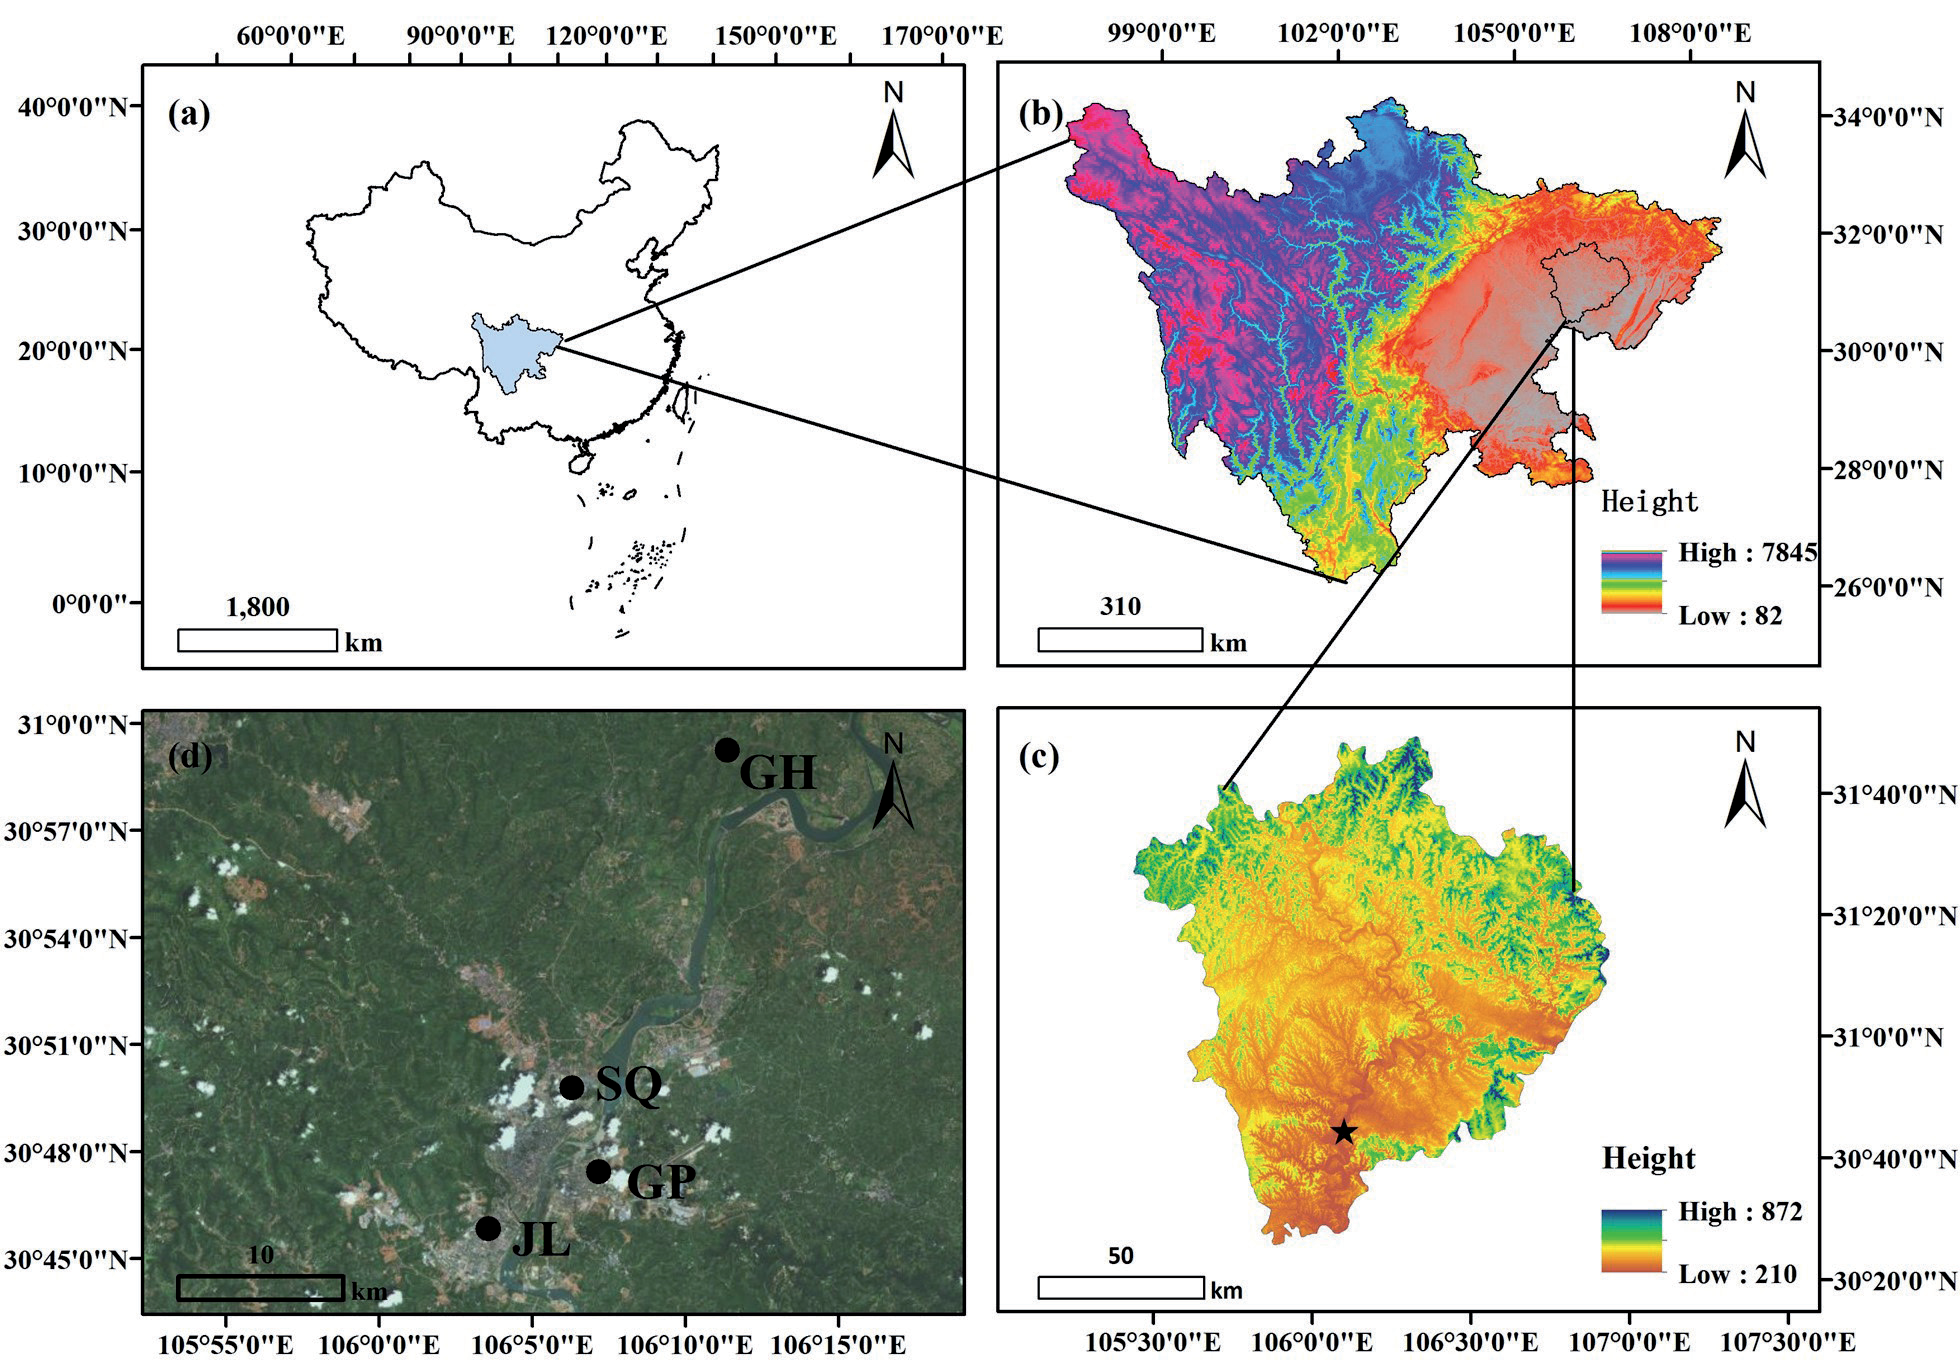
Nanchong City (30°35′-31°51′N, 105°27′-106°58′E, 256-889 masl) is in the northeastern Sichuan Basin and in the midstream section of the Jialing River (Fig. 1a-b). This city has a mid-subtropical humid monsoon climate with four distinct seasons and is famous throughout the country for its poor meteorological diffusion conditions for pollutants, notably its breezy, damp, rainy, and foggy conditions. The landform type is mainly hilly, and the terrain slopes from north to south [41]. The urban area of Nanchong City is in the southern region and is at low elevations, i.e., approximately 300 meters (Fig. 1c). There are three districts in the main urban area of Nanchong, namely, Shunqing (SQ), Gaoping (GP), and Jialing (JL), with populations of more than 1.7 million and an area of approximately 170 km2. In this study, one site was selected for PM2.5 sample collection in each of the three districts and in a rural area (the rural site is in Guihua Township (GH)) located approximately 25Kilometers from the urban area in the dominant upwind direction. The sampling site at SQ was situated on the rooftop (approximately 27 m above the ground) of the Nanchong Housing and Urban-Rural Development Bureau office building; at GP, it was situated on the rooftop (approximately 23 m above the ground) of the Gaoping Ecological and Environmental Bureau of Nanchong City office building; and at JL, it was situated on the rooftop (approximately 30 m above the ground) of the Jialing District People’s Government’s office building. The SQ, GP, and JL sampling sites were located in mixed educational, commercial, traffic, and residential areas, and no obvious industrial pollution sources were detected within 3 km. Thus, the SQ, GP, and JL sampling sites can represent the urban environments of the Shunqing District, Gaoping District, and Jialing District, respectively. The sampling site at GH was located on the rooftop of the Guihua Township People’s Government office building (approximately 8 m above the ground); this sampling site was surrounded by woodland, farmland, and villages without industrial pollution sources. The PM2.5 sampling sites are shown in Fig. 1d).
Sampling and Analysis
The PM2.5 samples were collected synchronously at the SQ, GP, JL, and GH sampling sites from December 22, 2014, to April 27, 2016. The PM2.5 samples were collected every six days with a four-channel sampler (each channel maintained a flow rate of 16.7 L min-1) made by Tianhong Instrument Co., Ltd., of China (TH-16A), and the duration of each sampling was 24 hours (from 10:00 a.m. to 10:00 a.m. of the next day). A total of 86, 65, 74, and 89 samples were collected at SQ, GP, JL, and GH, respectively (Table S1). The PM2.5 samples were collected on Teflon and quartz filters. The procedures for membrane replacement and sample storage were conducted following the Technical Guidelines for Source Analysis and Monitoring of Atmospheric Particulates (Trial) [42].
The Teflon filters were weighed at least three times with an electronic balance made by Mettler-Toledo Intl., Inc., USA (AX105 DeltaRange) after being balanced for 24 h in a super-clean environment at a constant temperature (20±1ºC) and relative humidity (40%±3%). The PM2.5 concentration was obtained by dividing the mass difference of the Teflon filter before and after sampling by the sampled air volume.
The Teflon filters were nitrated in a solution of 3 mL HNO3 (65%), 1 mL HCl (38%), and 0.2 mL HF (48%) at 175°C for 1 hour. The nitrification liquids were cooled to room temperature and diluted to 100mL with ultrapure water, and the elemental concentrations (Na, Mg, Al, Ca, Fe, K, Mn, Cu, Zn, As, Ti, Cd, Se, Ni, V, Pb, Co, Ba, and Cr) in the solutions were analyzed via inductively coupled plasma‒mass spectrometry (Agilent 7500c, Agilent Technologies Co., Ltd., USA).
The hourly concentrations of PM2.5 and PM10 were used to calculate and evaluate the proportion of PM2.5 in PM10. The tracked aerological data for air masses (such as pressure and wind speed) for backward trajectory analysis were obtained from the Air Resource Laboratory, National Oceanic and Atmospheric Administration (http://www.arl.noaa.gov/). The hourly concentrations of PM2.5 and the tracked aerological data were used to calculate the potential source contribution function (PSCF).
Data Processing and Statistical Analysis
Potential Source Contribution Function (PSCF)
In this study, Metewoinfo software (download website: http://www.meteothinker.com) was used to analyze the 24-h backward trajectories of 500-m-high air masses in the urban area of Nanchong (30.80 N, 106.08 E, 500 m AGL) [43]. Then, the PSCF model in MetewoFo software, based on the results of backward trajectory analysis, was used to identify the potential source regions of PM2.5.
PSCF analysis relies on the conditional probability function as the basic principle and uses air mass trajectories to analyze and calculate the geographical location and spatial distribution of potential source areas. The research region is equally divided into i × j grid cells, and the ijth cell is determined to affect the pollutant at the research site on the basis of the set pollutant concentration threshold. The PSCFij value in the ijth cell is calculated by Mij/Nij, and grids with high PSCFij values are considered potential source regions [35, 44]. The calculation formula of PSCFij is as follows:
where PSCFij denotes the ratios of Mij and Nij, Mij denotes the number of trajectories that exceed the pollutant concentration threshold passing through the ijth cell, and Nij denotes the total number of trajectories of the air mass passing through the ijth cell. In this study, the resolution of the grid cells was set to 1° × 1°, and the seasonal average concentration of PM2.5 was set as the threshold.
Uncertainties exist due to the small values of Nij. Therefore, the weight function (Wij) is used to reduce uncertainty [45]. The weight potential source contribution function (WPSCF) is then defined as the PSCF result multiplied by Wij. The calculation formula of Wij is as follows:
where Navg denotes the average number of endpoints of the air mass trajectories in the grid cells in the study area.
Enrichment Factor (EF)
The enrichment factor (EF) was used to analyze the relative contributions of anthropogenic sources and natural sources to the metal elements in PM2.5 [41, 46]. The calculation formula for the EF is as follows:
where EFi denotes the enrichment factor of element i, (Ci/Cref)PM2.5 denotes the ratio of the concentration of element i to the concentration of the reference element ref in PM2.5, and (Ci/Cref)soil denotes the ratio of the concentration of element i to the concentration of the reference element ref in topsoil.
The evaluation criterion of the EFs of elements in PM2.5 refers to [41, 47]. When the EFi of element i is greater than 10, an element is mainly contributed by an anthropogenic source. In contrast, when EFi is less than 10, the element is contributed mainly by a natural source. The concentrations of the elements in the topsoil were derived from the background values of the topsoil in Sichuan Province [48]. During the sampling period, the average concentration of iron (Fe) at the four sites was lower than that of aluminum (Al), and the concentration of Fe in the PM2.5 in the GH was the lowest (Table S2). Therefore, Fe was selected as the reference element, and the Fe in PM2.5 at the GH was used to calculate the EFs of the elements in PM2.5 at the four sites.
Principal Component Analysis (PCA)
PCA is a multivariate analysis method that can be used as a source apportionment tool to explain the variance in the data effectively and identify the underlying reasons. In this study, the elemental data for PM2.5 at SQ, GP, JL, and GH during the sampling period were used to quantify the major sources of elements in PM2.5 and the contributions of each site via PCA. PCA was performed using SPSS 22.0 statistical software.
Table S2.
The background concentrations of topsoil elements in Sichuan Province. The data cited in Background values of soil elements in China (China National Environmental Monitoring Centre, 1990).
| Elements | Mean | Unit |
|---|---|---|
| Na | 0.85 | % |
| Mg | 0.85 | % |
| Al | 6.26 | % |
| Ca | 1.13 | % |
| Fe | 3.3 | % |
| K | 2.02 | % |
| Mn | 657 | mg/kg |
| Cu | 31.1 | mg/kg |
| Zn | 86.5 | mg/kg |
| As | 10.4 | mg/kg |
| Ti | 0.4 | % |
| Cd | 0.079 | mg/kg |
| Ti | 0.4 | % |
| Ni | 32.6 | mg/kg |
| V | 96 | mg/kg |
| Pb | 30.9 | mg/kg |
| Co | 17.6 | mg/kg |
| Ba | 474 | mg/kg |
| Cr | 79 | mg/kg |
Data Processing and Analysis
The PM2.5 and element data were analyzed using the statistical software SPSS 22.0. The normality and homoscedasticity of the variables were checked via the Shapiro‒Wilk and Levene tests, respectively. Normal and normalizable data were compared via one-way ANOVA (with Duncan’s multiple range test). Nonparametric tests (with the Kruskal‒Wallis H test) were used when the variables could not be normalized. The values are presented as the means±SEs. Spearman’s correlation analysis was used to analyze the correlations between elements.
Origin-pro 9.1 and ArcGIS 10.8 software were used for data processing and graph construction.
Results and Discussion
Overview of PM2.5
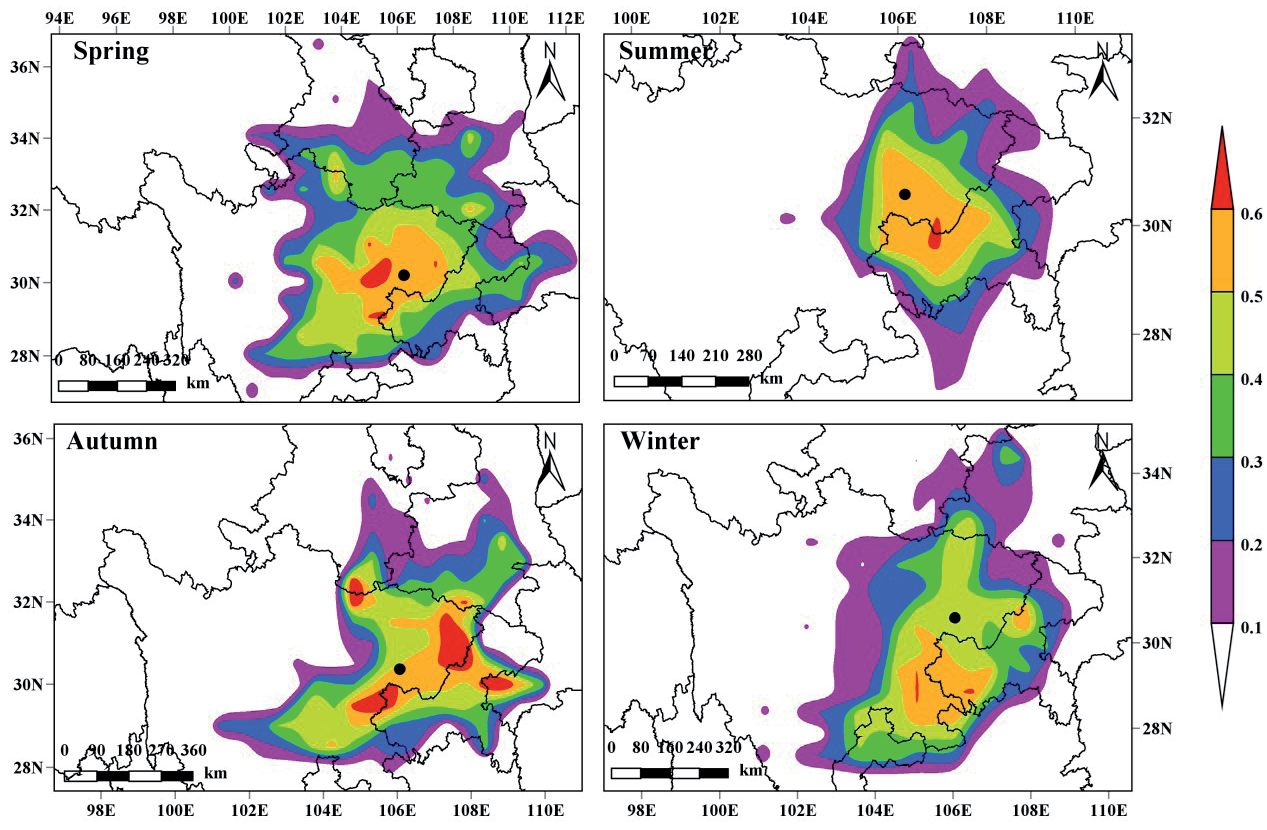
During the sampling period, the daily concentrations of PM2.5 at SQ ranged from 6.87 to 158.45 μg m-3, with 32.58% of daily PM2.5 concentrations exceeding the standard. The daily concentrations at GP ranged from 12.48 to 217.54 μg m-3, with 22.73% of daily PM2.5 concentrations exceeding the standard. The daily concentrations at JL ranged from 12.19 to 191.07 μg m-3, with 29.49% of daily PM2.5 concentrations exceeding the standard. Finally, the daily concentrations at GH ranged from 8.23 to 210.22 μg m-3, with 31.87% of daily PM2.5 concentrations exceeding the standard. The upper limit of the daily average PM2.5 concentration is 75 μg m-3 for Class II areas in the Standard of China’s National Air Quality Standard, such as urban residential, commercial and traffic, cultural, industrial, and rural areas) [9]. The average concentrations of PM2.5 were 63.03±4.20 μg m-3 in SQ, 58.89±4.80 μg m-3 in GP, 61.70±4.41 μg m-3 in JL, and 60.13±4.28 μg m-3 in GH, which were slightly lower than those reported in Chengdu (67.0±43.4 μg m-3) and Chongqing (70.9±41.4 μg m-3) in the Sichuan Basin [49] but significantly lower than those reported in other cities in China (P<0.001), such as Beijing [28-29], Tianjin [28], Shijiazhuang [28], Chengde [28], Shanghai [30], Nanjing [30-31], Hangzhou [30], Ningbo [30], and Wuhan [34-35]. During the study period, the average concentrations at the four sites were significantly greater than that of the Grade II Standard of China’s National Air Quality Standard for PM2.5 based on a one-sample t test (SQ, t = 6.682, P<0.001; GP, t = 4.976, P<0.001; JL, t = 6.051, P<0.001; GH, t = 5.865, P<0.001) (the upper limit of the annual average is 35 μg m-3 for Class II areas) [9], exceeding the standard by 0.80 times (SQ), 0.68 times (GP), 0.76 times (JL), and 0.72 times (GH). In addition, there was no significant difference in the concentration of PM2.5 among the four sites (χ2 = 0.666, P = 0.881), indicating that the PM2.5 pollution in the urban and rural areas of Nanchong City was relatively severe during the study period. Lei et al. [50] reported that PM2.5 was the major standard-exceeding pollutant in the urban area of Nanchong and that the mean annual concentrations of PM2.5 exceeded the Grade II Standard of China’s National Air Quality Standard for PM2.5 (35 μg m-3) from 2015 to 2018. In other cities in the Sichuan Basin, the mean concentrations of PM2.5 ranged from 37 μg m-3 to 73 μg m-3, and the proportion of pollution caused by PM2.5 accounted for 77.83% of the total pollution from 2015 to 2016 [51]. These findings indicate that other cities in the Sichuan Basin also suffer from severe PM2.5 pollution.
Seasonal Variations in PM2.5
The seasonal variations in the PM2.5 concentration at the four sites are depicted in Fig. 2. The concentrations of PM2.5 at the four sites were highest in winter, with mean values of 94.06±7.07 μg m-3 in SQ, 94.32±10.98 μg m-3 in GP, 90.29±6.40 μg m-3 in JL, and 87.25±6.05 μg m-3 in GH, followed by spring and fall, with the lowest concentrations in summer. Compared with those in other seasons, the sources of pollutants in Nanchong City did not change significantly in winter, but the mass concentrations of PM2.5 increased significantly (SQ, χ2 = 37.469, P<0.001; GP, χ2 = 24.025, P<0.001; JL, χ2 = 38.492, P<0.001; GH, χ2 = 43.429, P<0.001). Similar seasonal trends have also been reported in other cities in the Sichuan Basin, such as Chengdu [38, 52-53], Chongqing [49], Leshan [38, 53], Dazhou [38, 53], and Ya’an [53-54]. Studies have shown that the concentration of particulate matter in the urban atmosphere is influenced by source emission intensities [20-21, 49, 55-56], atmospheric processes [49, 57], and meteorological conditions [49-50, 52, 58]. Yang et al. [58] reported that the low-level ventilation volume in cities in the Sichuan Basin is negatively correlated with the PM2.5 concentration and that a low wind speed can reduce the diffusion and migration of PM2.5, whereas temperature and relative humidity are favorable conditions for secondary aerosol generation.
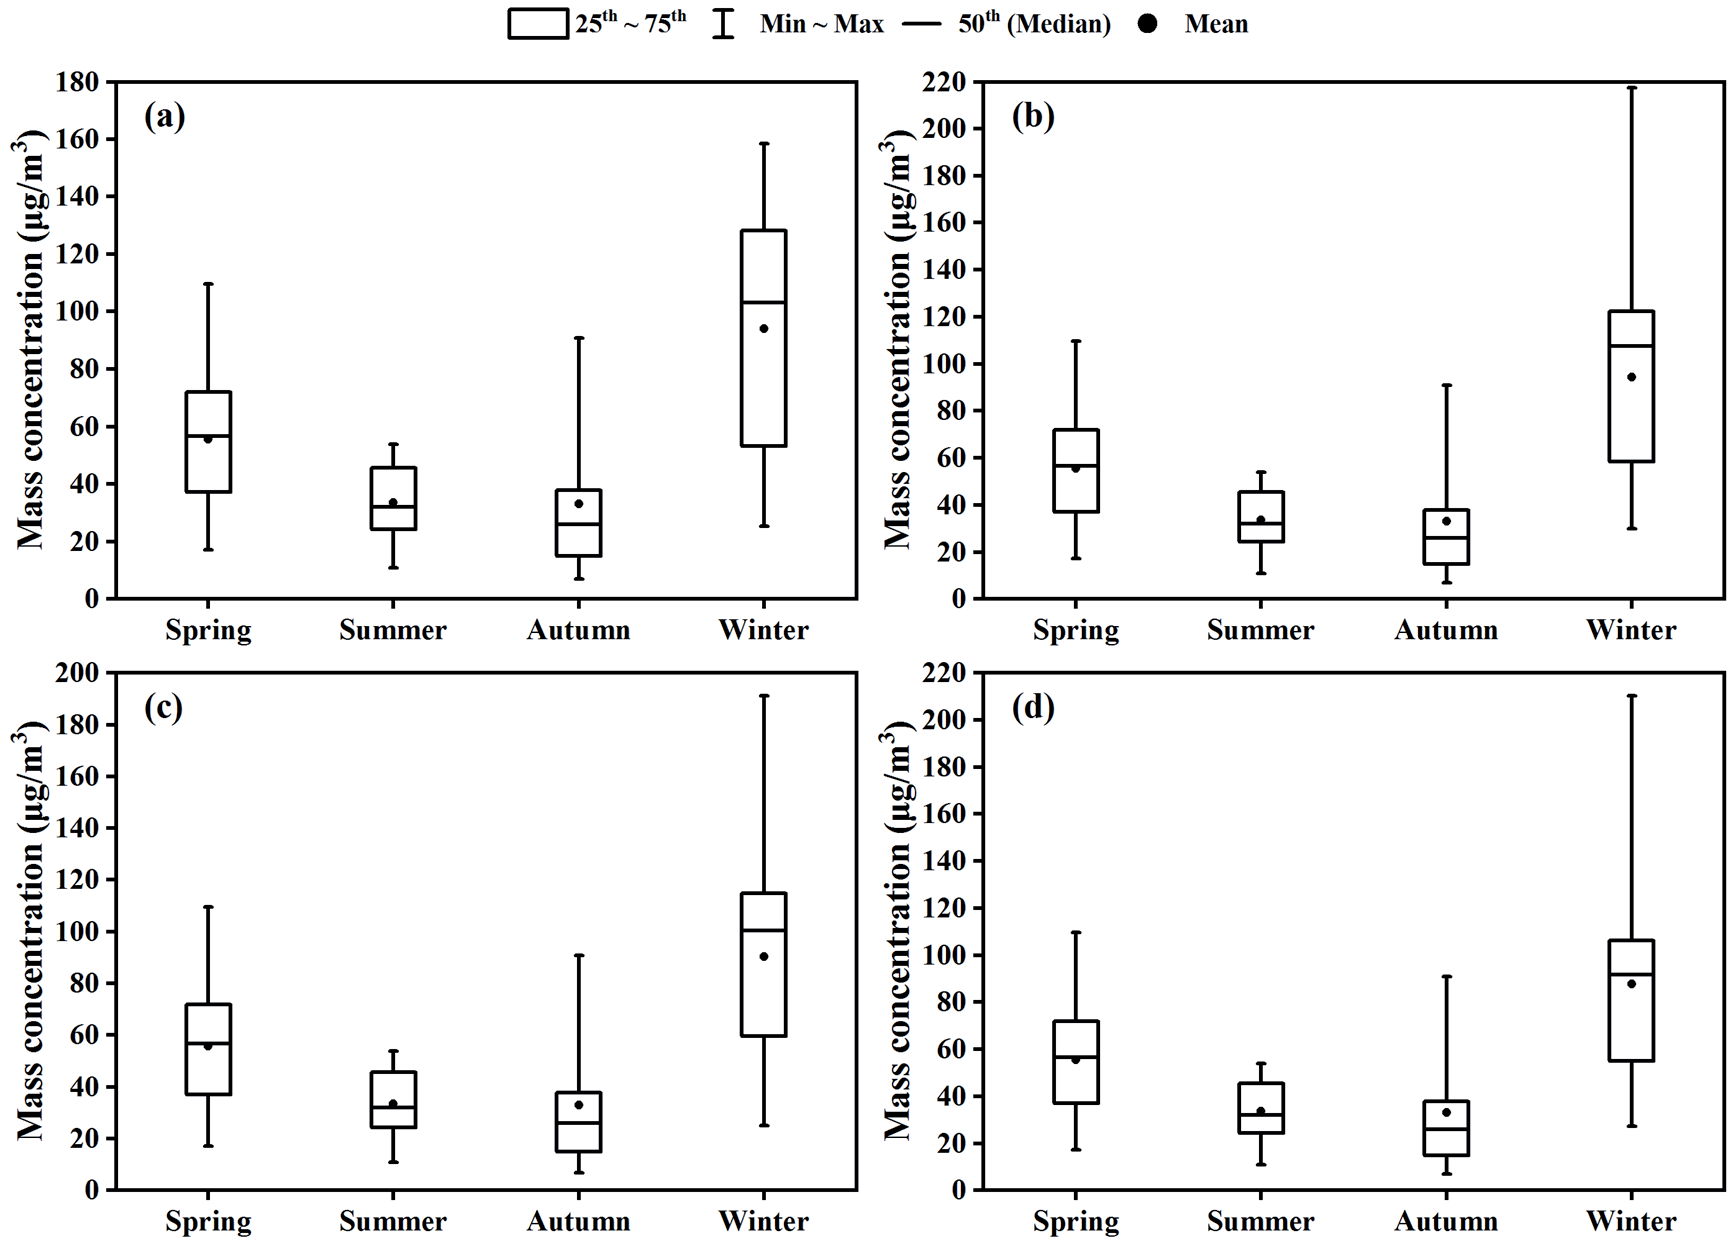
Fig. 3.
Seasonal variation of WPSCF values of PM2.5 in the urban area of Nanchong City. ●, the location of the urban area of Nanchong City.
As shown in Fig. 3, the mass concentration of PM2.5 in the urban area of Nanchong City was affected mainly by the surrounding areas because of poor meteorological diffusion conditions for pollutants (such as low wind speeds and high frequencies of calm winds) and advantageous conditions for the generation of PM2.5 (such as high temperatures and relative humidity). The proportion of the mass concentration of aerosols in Nanchong from the local and surrounding areas was 79.45% in spring, 85.42% in summer, 83.89% in fall, and 81.12% in winter [41]. In addition, Qiao et al. [59] reported that emissions within the Sichuan Basin contributed approximately 80% of the total PM2.5 in Chengdu and Chongqing during the four seasons. Xu et al. [60] also confirmed that PM2.5 in Chengdu in winter was less affected by the long-range transport of air masses, and the contribution of the long-traveled air masses was only 12.9%. Although this seasonal trend in PM2.5 concentrations has been widely found in cities in northern China [24, 35, 61], the backward trajectories of PM2.5 concentrations were completely different from those of cities in the Sichuan Basin, and the contribution of local pollution sources to PM2.5 from the end of December 2013 to the end of January 2014 was only 12.9% in Beijing and only 38.7% in Changchun [60]. Local pollution sources contributed no more than 60% of the total PM2.5 in Beijing’s atmosphere during the whole heating season, and the contribution proportion of local pollution sources was only 40% in the summer [62].
Characteristics of the Elements
Nineteen elements in PM2.5 (Na, Mg, Al, Ca, Fe, K, Mn, Cu, Zn, As, Ti, Cd, Se, Ni, V, Pb, Co, Ba, and Cr) were measured in this study. During the sampling period, the total concentrations of the analyzed trace elements at SQ ranged from 0.45 to 20.45 μg m-3, with a mean value of 2.81±0.26 μg m-3; those at GP ranged from 0.53 to 49.00 μg m-3, with a mean value of 3.13±0.73 μg m-3; those at JL ranged from 0.41 to 37.36 μg m-3, with a mean value of 3.43±0.62 μg m-3; and those at GH ranged from 0.15 to 19.02 μg m-3, with s mean value of 2.55±0.26 μg m-3. These nineteen elements accounted for 1.43%-15.10% of the total mass of PM2.5 in SQ (mean value of 4.84%±0.25%), 1.73%-22.53% of the total mass of PM2.5 in GP (mean value of 4.83%±0.39%), 1.38%-26.33% of the total mass of PM2.5 in JL (mean value of 5.05%±0.42%), and 1.77%-15.73% of the total mass of PM2.5 in GH (mean value of 4.55%±0.25%). The total concentrations of the analyzed trace elements (χ2 = 1.163, P = 0.762) and their mass fractions in PM2.5 (χ2 = 0.816, P = 0.846) did not significantly differ among the four sites. Compared with those in other cities in China, the total concentrations of the analyzed trace elements in the PM2.5 in the urban area of Nanchong City were similar to those in Chengdu [37], Chongqing [37], and Jinan [39] but significantly lower than those in Beijing [28-29], Tianjin [28], Shijiazhuang [28], Chengde [28], Shanghai [30], Hangzhou [30], and Wuhan [34-35] (Table S3). Similarly, the total concentration of elements in PM2.5 in the rural area of Nanchong was lower than that in the suburbs of Beijing [29], Ningbo [30], and Wuhan [29] (Table S3).
Fig. 4.
The seasonal variations of the total concentration of the analyzed trace elements in SQ a), GP b), JL c), and GH d).
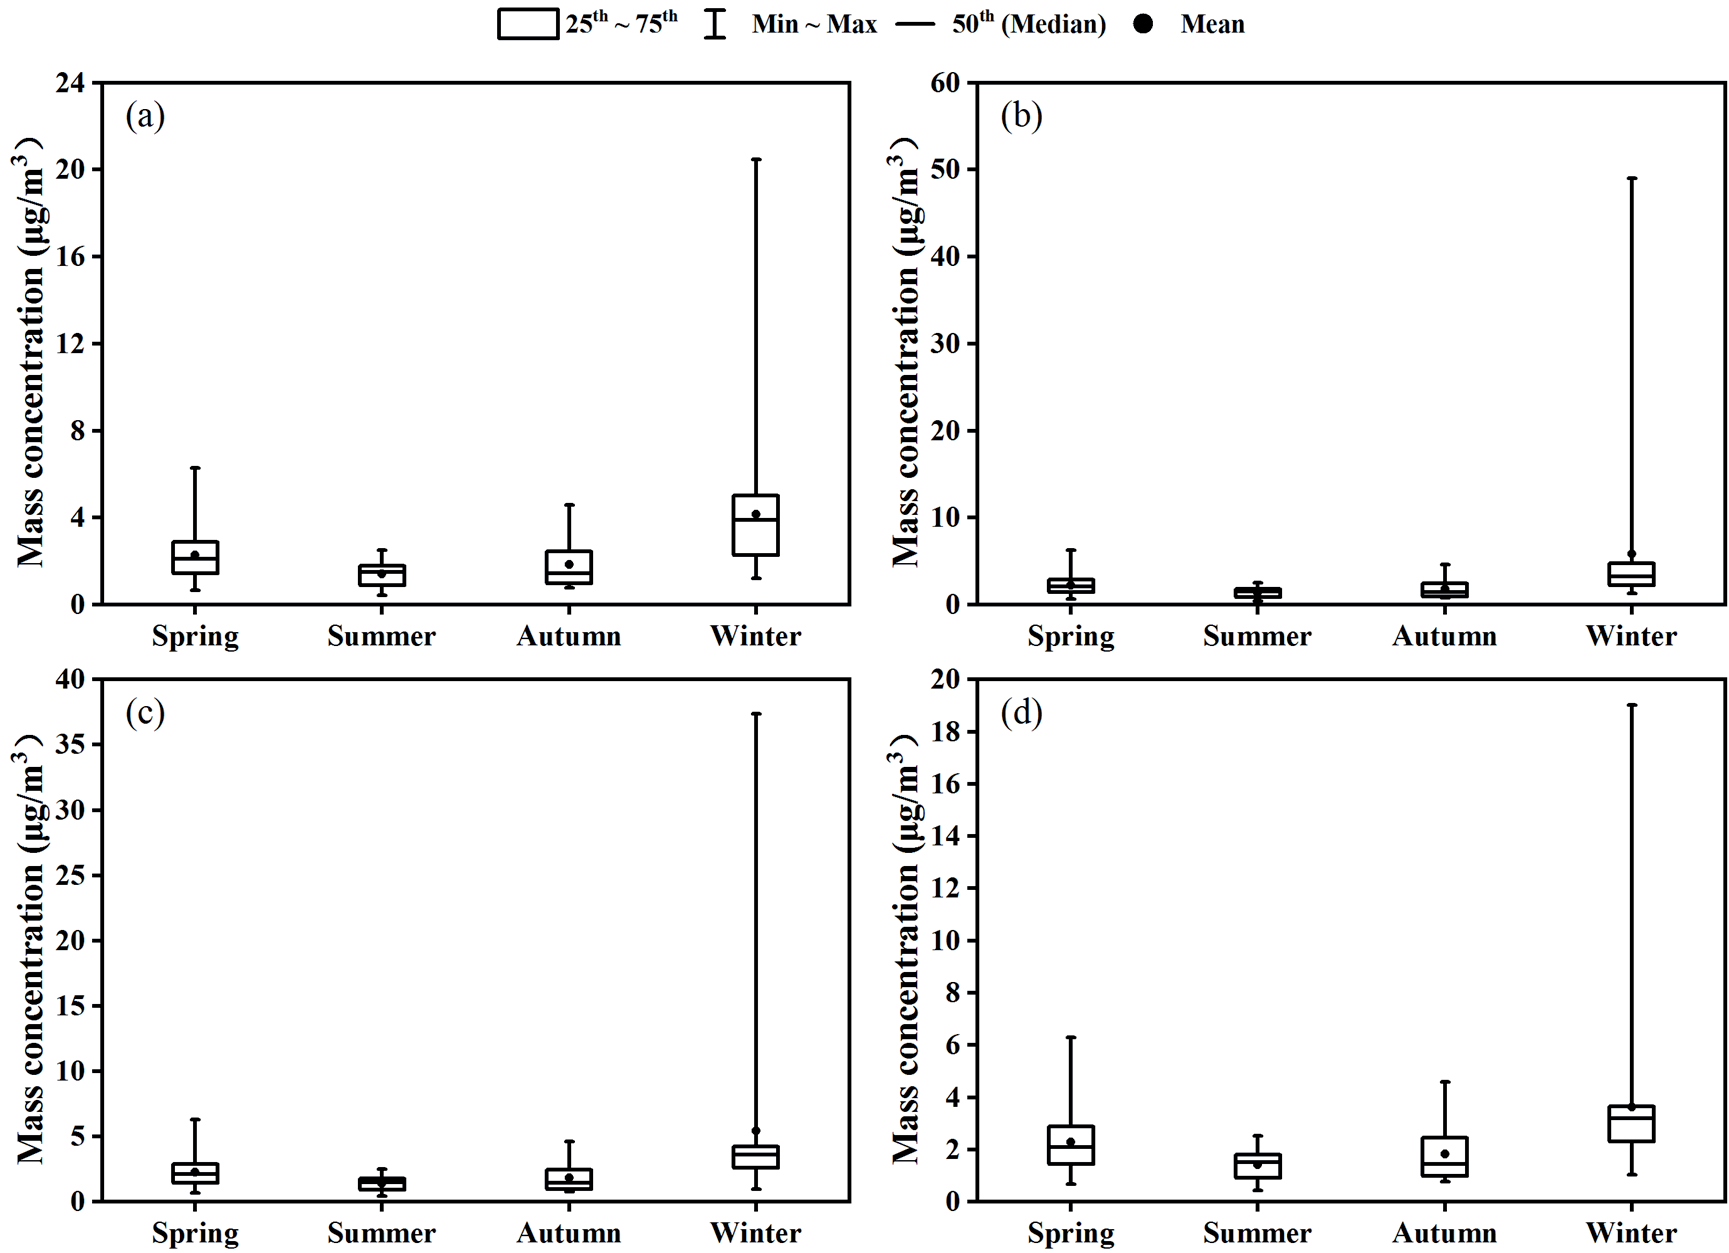
Furthermore, there was a significant positive correlation between the total elemental concentration in PM2.5 and the mass fraction of the 19 elements in PM2.5 among the four sites (P<0.001). However, the seasonal differences in the total concentrations of the analyzed trace elements (SQ, χ2 = 31.447, P<0.001; GP, χ2 = 22.702, P<0.001; JL, χ2 = 26.281, P<0.001; GH, χ2 = 38.962, P<0.001) and the mass fraction of the 19 elements in PM2.5 (SQ, χ2 =10.099, P = 0.018; GP, χ2 = 9.717, P<0.021; JL, χ2 = 7.976, P<0.047; GH, χ2 = 21.846, P<0.001) at the four sites reached significant levels. Fig. 4 shows the seasonal variation trends of the analyzed trace elements at the four sites in Nanchong. The seasonal trends of the analyzed trace elements at the four sites were the same as those in PM2.5, with the highest occurring in winter, intermediate values occurring in spring and autumn, and the lowest occurring in summer. However, the seasonal variation trends in the mass fractions of the analyzed trace elements in PM2.5 at the four sites were not the same. The mass fractions of the analyzed trace elements in PM2.5 at sites GP and GH were the highest in autumn, intermediate in spring and winter, and lowest in summer (Fig. 5b and 5d). In contrast to those in GP and GH, the mass fractions of the analyzed trace elements in PM2.5 ranked in the order autumn>summer>winter>spring at site SQ (Fig. 5a) and in the order autumn>winter> summer>spring at site JL (Fig. 5c).
Enrichment Factor (EF)
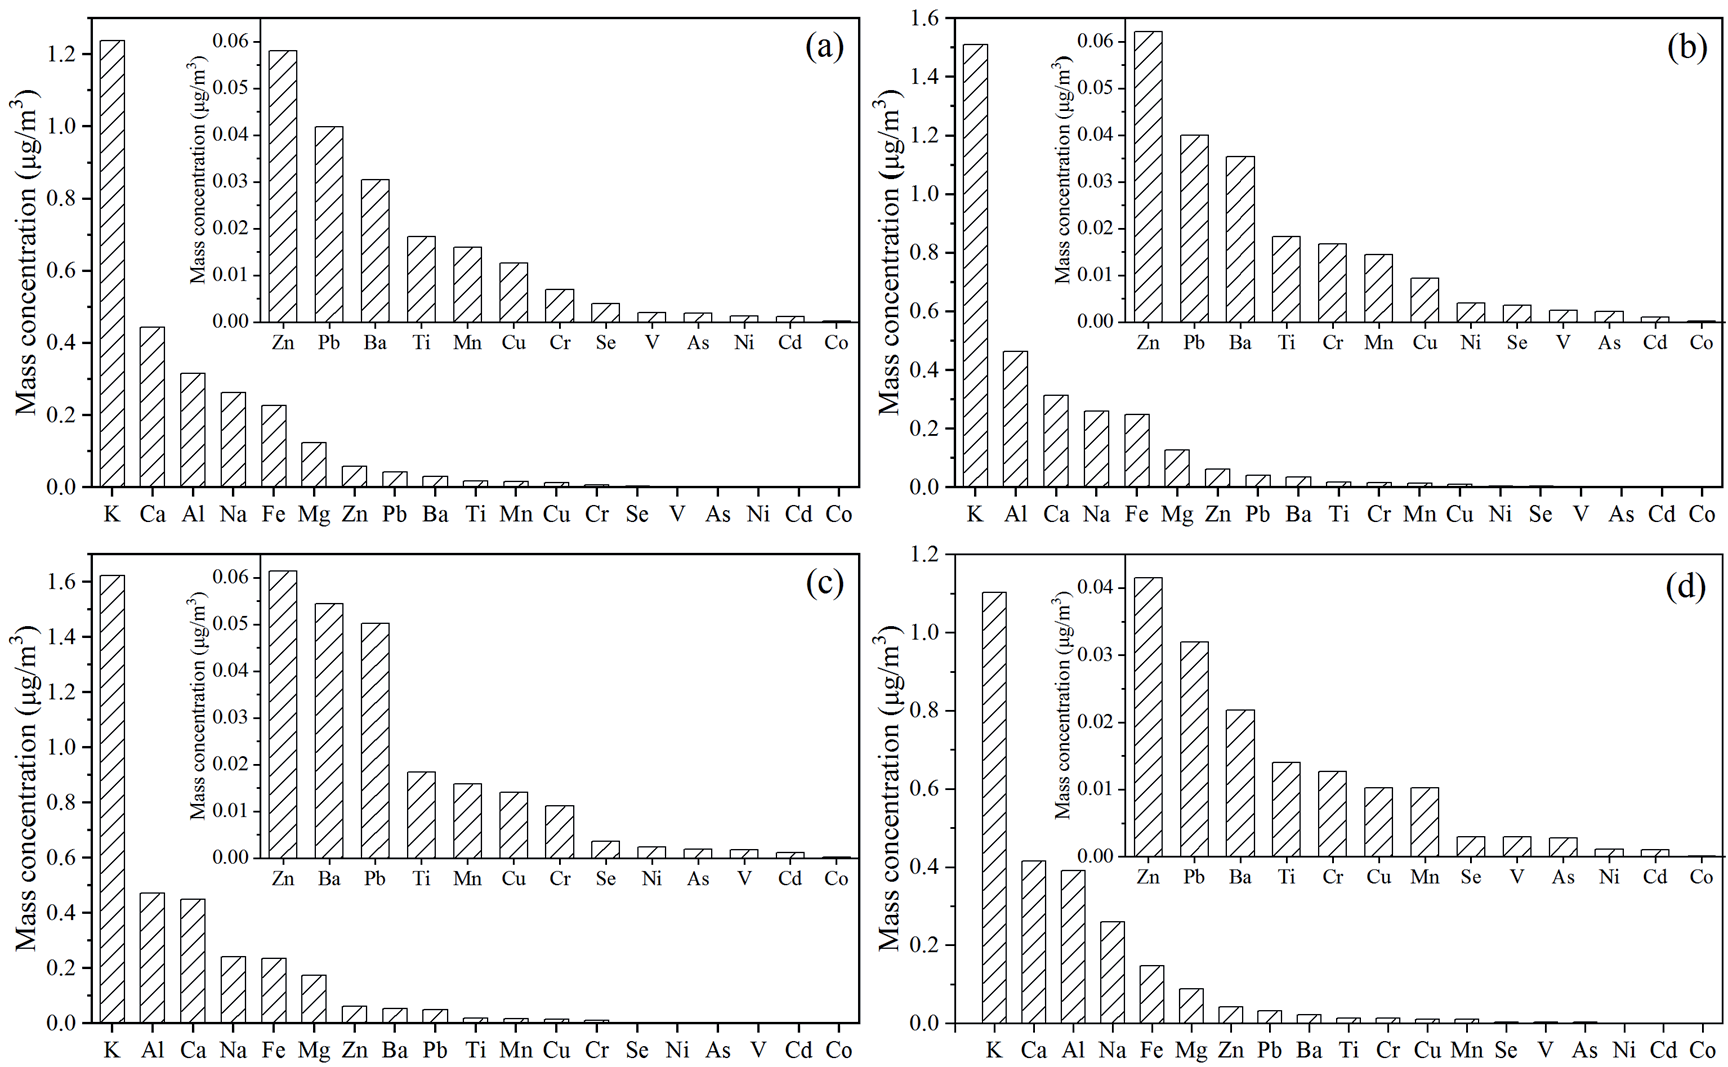
Fig. 6 shows the mean concentrations of the 19 elements in PM2.5 at the four sites during the sampling period. Generally, the distributions of the 19 elements in PM2.5 were similar among the four sites. K was found to be the dominant element in PM2.5 at the four sites, with K concentrations of 1.24±0.16 μg m-3 in SQ (Fig. 6a), 1.51±0.56 μg m-3 in GP (Fig. 6b), 1.62±0.44 μg m-3 in JL (Fig. 6c), and 1.10±0.15 μg m-3 in GH (Fig. 6d). The contribution of K to the total concentration of the analyzed trace elements in PM2.5 was 40.62%±1.21% in SQ, 38.06%±1.60% in GP, 38.40%±1.55% in JL, and 41.73%±1.651% in GH, and there was no significant difference among the four sites (χ2 = 3.812, P = 0.283). The crustal elements K, Ca, Al, Na, Fe, Mg, and Ti were the dominant metals at the four sites, and their contributions to the total concentration of the analyzed trace elements were 93.50%±0.20% in SQ, 93.01%±0.30% in GP, 93.03%±0.26% in JL, and 94.27%±0.21% in GH. Most studies have confirmed that crustal elements are the most important elements in PM2.5 and contribute 80.97%-92.73% of the total concentration of the analyzed trace elements in many Chinese cities (Table S3), such as Beijing [28-29], Chengdu [37], Chongqing [37], Tianjin [28], Hangzhou [30], Jinan [39], Shijiazhuang [28], Ningbo [30], and Chengde [28].
Fig. 5.
The seasonal variations of the mass fraction of the analyzed trace elements in PM2.5 in SQ a), in GP b), in JL c), and GH d).
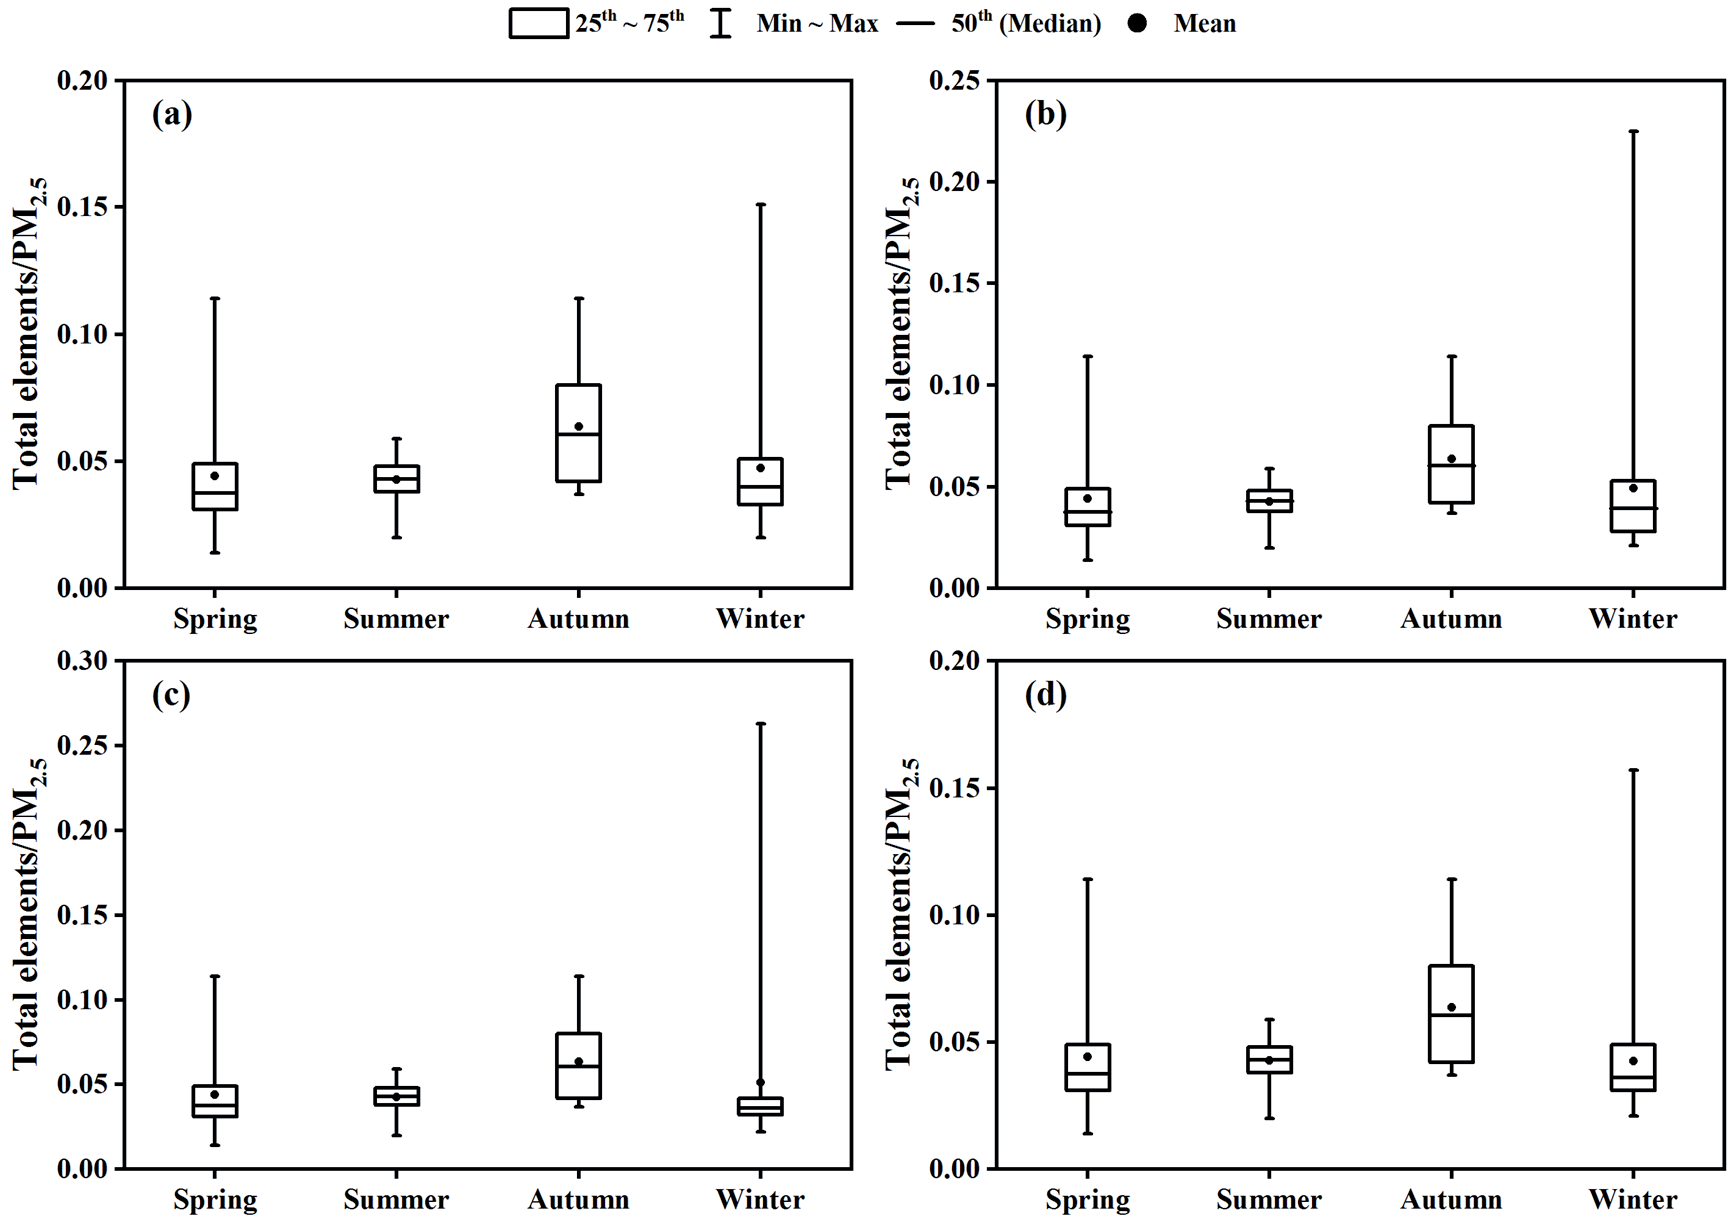
Table S3.
The mean concentrations of elements in PM2.5 at SQ, GP, JL, GH, and the major cities of China. (unit: ng/m3).
[i] Chengdu: The sampling site (Sichuan Academy of Environmental Science) located in the mixed area of traffic, commerce, residence, and education in Chengdu City, Sichuan Basin of southwest China. The sampling campaign was divided into four periods: autumn (23 October to 18 November, 2014), winter (6 January to 2 February, 2015), spring (2 to 29 April, 2015), and summer (2 to 30 July, 2015).
Chongqing: The sampling site (Chongqing Monitoring Center) located in the mixed area of traffic, commerce, and residence in Chengdu City, Sichuan Basin of southwest China. The sampling campaign was divided into four periods: autumn (23 October to 18 November, 2014), winter (6 January to 2 February, 2015), spring (2 to 29 April, 2015), and summer (2 to 30 July, 2015).
Beijing: The sampling site (Institute of Atmospheric Physics, Chinese Academy of Sciences) located in the mixed area of traffic, residence, and education in Beijing City, China. The sampling period was from September 15 to November 12, 2014.
Beijing: The sampling site (the campus of the University of Chinese Academy of Sciences ) located in the suburban area of Beijing City, China. The sampling period was from September 15 to November 12, 2014.
Beijing: The sampling site (local meteorological bureau) located in the mixed area of traffic, commerce, and residence in Beijing City, north China. The sampling campaign was divided into four periods: spring (6 April to 1 May 2009), summer (9 July to 4 August 2009), autumn (11 October to 4 November 2009), and winter (14 January to 8 February 2010).
Tianjin: The sampling site (local meteorological bureau) located in the mixed area of traffic, commerce, and residence in Tianjin City, north China. The sampling campaign was divided into four periods: spring (6 April to 1 May 2009), summer (9 July to 4 August 2009), autumn (11 October to 4 November 2009), and winter (14 January to 8 February 2010).
Shijiazhuang: The sampling site (local meteorological bureau) located in the mixed area of traffic, commerce, and residence in Shijiazhuang City, north China. The sampling campaign was divided into four periods: spring (6 April to 1 May 2009), summer (9 July to 4 August 2009), autumn (11 October to 4 November 2009), and winter (14 January to 8 February 2010).
Chengde: The sampling site (local meteorological bureau) located in the mixed commercial and residential area in Chengde City, north China. The sampling campaign was divided into four periods: spring (6 April to 1 May 2009), summer (9 July to 4 August 2009), autumn (11 October to 4 November 2009), and winter (14 January to 8 February 2010).
Shanghai: The sampling site located in the urban area of Shanghai City, east China. The sampling period was from September 2013 to August 2014.
Nanjing: The sampling site located in the urban area of Nanjing City, east China. The sampling period was from September 2013 to August 2014.
Nanjing: The sampling site (Nanjing Environmental Protection Building) located in the mixed area of traffic, commerce, and residence in Nanjing City, east China. The sampling period was from December 12, 2016 to December 31, 2017.
Hangzhou: The sampling site located in the urban area of Hangzhou City, east China. The sampling period was from September 2013 to August 2014.
Ningbo: The sampling site located in the rural area of Ningbo City, east China. The sampling period was from September 2013 to August 2014.
Jinan: The sampling site (Jinan Environmental Monitoring Center Station) located in the mixed commercial and residential area in Jinan City, East China. The sampling period was from October 1, 2016 to September 30, 2017.
Wuhan: The sampling site (Super Monitoring Station of Wuhan) located in the typical residential urban area of Wuhan city, central China. The sampling period was from May 15 to May 31, 2014.
Wuhan: The sampling site (the campus of the Wuhan University) located in the mixed area of traffic, commerce, residence and education in Wuhan city, central China. The sampling period was from August 2012 to July 2013.
Wuhan: The sampling site (Wuhan East Lake High-tech Zone) located in the suburban area of Wuhan city, central China. The sampling period was from August 2012 to July 2013.
EF analysis has been widely used to determine the source origins (anthropogenic or natural) of elements in PM2.5 [38, 47, 63]. K, Ca, Al, Na, Fe, Mg, and Ti were the most abundant elements in PM2.5 in Nanchong, and with the exception of the EF of K, which was close to 20, the EFs of the other crustal elements were very low. As shown in Fig. 7, the mean EF of K at the four sites was close to 20, indicating that K was derived mainly from anthropogenic sources. The mean EFs of the crustal elements Mg, Fe, and Al in PM2.5 at the four sites were significantly less than 5, indicating that they were derived mainly from natural dust. The mean EFs of the crustal elements Na and Ca and the trace element Ni were close to (or slightly greater than) 10, indicating that they were lightly enriched and influenced by both natural and anthropogenic sources. Unlike crustal elements such as K, Ca, Al, Na, Fe, and Mg, the crustal element Ti and the trace elements Co, V, and Mn have fewer anthropogenic sources, their concentrations were low, and their contributions to the total concentrations of the analyzed trace elements at the four sites were less than 1.10% during the sampling period. additionally, the EFs of Ti, Co, V, and Mn were less than 10, indicating that they were derived mainly from natural sources (Fig. 7). Nanchong is a typical agricultural city with rapid development and a low level of industrialization. Dust is emitted during the process of urban construction, resulting in a high concentration of crustal elements in PM2.5 [50, 64-65]. In addition, owing to the lack of technology for processing straw and the high cost of processing straw, most straw has been burned directly in the past [50], which has contributed to the increase in the concentration of K in PM2.5. Yang et al. [65] reported that the contribution rate of biomass burning to OC was greater than 60% in Nanchong City.
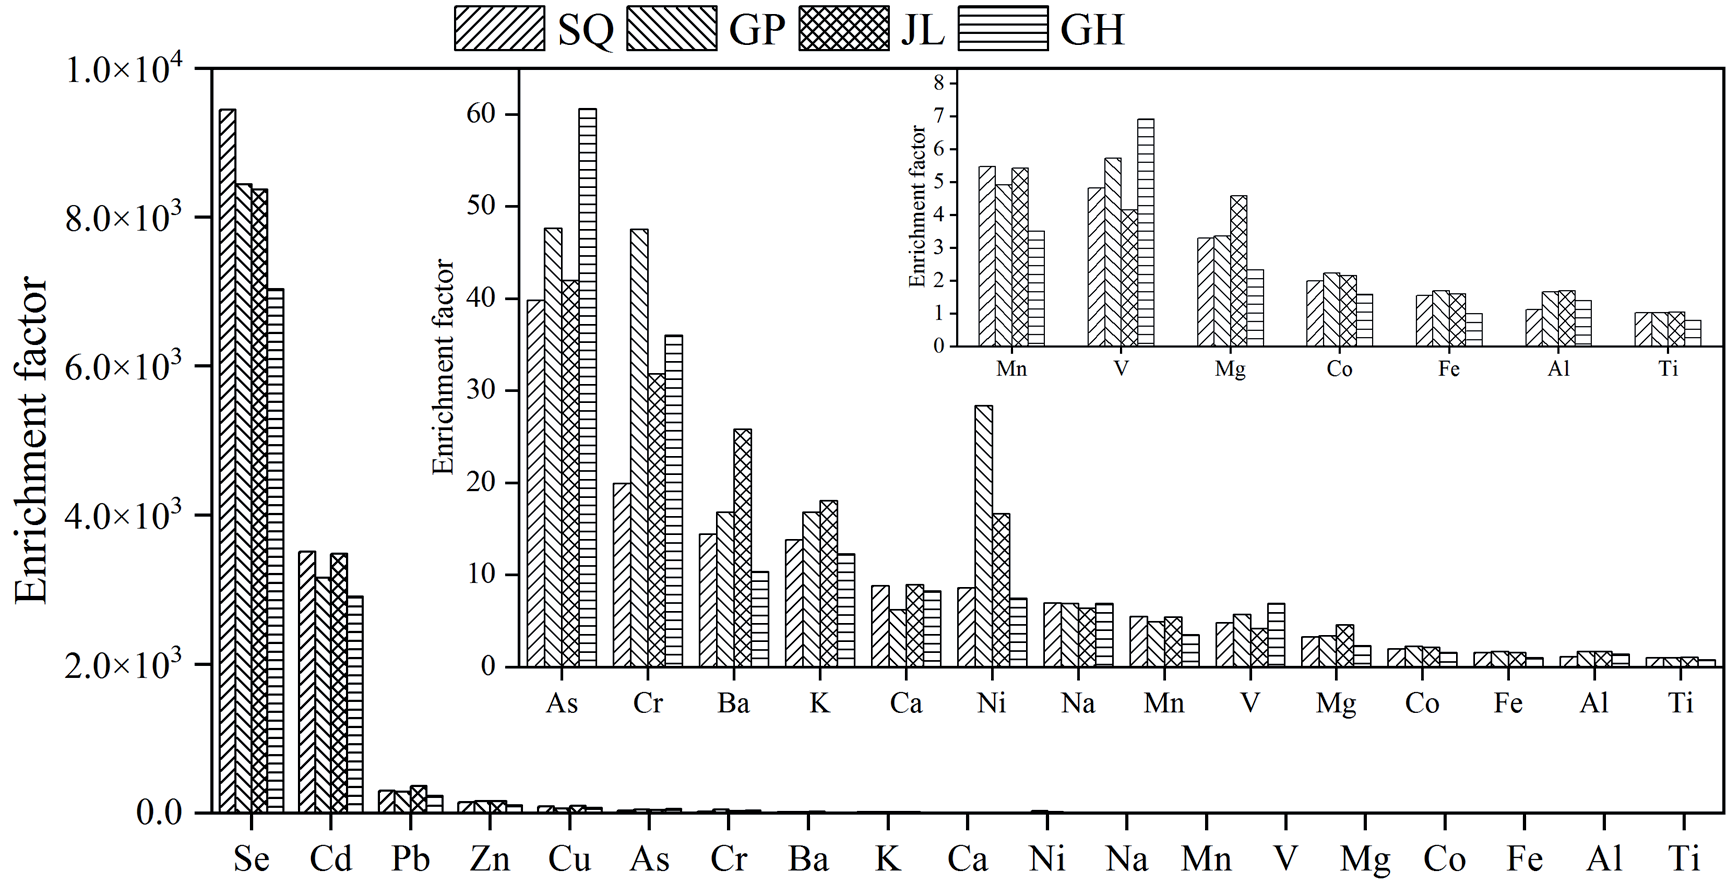
In contrast, the remaining 12 elements (Mn, Cu, Zn, As, Cd, Se, Ni, V, Pb, Co, Ba, and Cr) accounted for only 5.73%-6.99% of the total concentration of the analyzed trace elements in Nanchong, and the EFs of Co, V, and Mn were less than 10, suggesting that they were little influenced by anthropogenic sources. However, the EFs of Cu, Zn, As, Cd, Se, Ni, Pb, Ba, and Cr were much greater than 10, suggesting that these elements were mainly contributed by anthropogenic sources.
Source Apportionment via PCA
In this study, the sources of elements in PM2.5 were estimated quantitatively via PCA with varimax rotation, and the retention of principal components with eigenvalues greater than 1.0 was used to identify the major pollutant sources. Fig. 8 shows the PCA results for the elements in PM2.5 at the four sites.
At the SQ sampling site (the urban site), four principal component factors were found to explain the possible sources of elements in PM2.5 (Fig. 8a). Factor 1 (total variance 57.2%) was associated with elements such as Cd, Pb, Cu, K, Mn, and Zn. This group appears to represent a mixture of sources related to vehicular emissions [23, 66-67] and biomass burning [21, 25, 68- 69]. Previous studies have shown that Cd is derived mostly from smelting and vehicular emissions [66, 70-71]; Pb and Cu are derived mostly from vehicular emissions [23, 66, 70] and industrial emissions [23, 72]; Zn is derived mostly from vehicular emissions, tire and brake debris, and industrial emissions [66, 73- 74]; and Mn is derived from vehicular emissions, coal combustion, metal smelting [67] and soil dust [40, 73]. Cd (EFCd = 3513.4), Pb (EFPb = 304.1), Cu (EFCu = 91.1), Mn (EFMn = 5.5), and Zn (EFZn = 151.1) were significantly enriched and positively correlated with each other at the SQ sampling site (P<0.01), indicating that they were derived mainly from vehicle emissions. Another element with a high degree of loading in factor 1, K, is derived mostly from biomass burning [21, 25, 68-69] and soil dust [40, 73]. The EF of K was 13.8 at the SQ sampling site during the sampling period, which was greater than 10 and much greater than that of other crustal elements (Ca, Al, Na, Fe, Mg, and Ti), indicating that K was strongly influenced by anthropogenic emissions. Therefore, the source of K in factor 1 was mainly biomass burning. The second factor (total variance: 10.8%) was assigned to emissions related to soil dust, a natural source. The crustal elements Mg, Ti, Fe, and Al, which had relatively high loadings in this factor, the EFs less than 5, indicating that they were derived from soil dust [40, 73]. The third factor included As and Na. This factor explains 6.1% of the total variance. It appears to be a mixture of sources related to coal combustion [27, 75-76] and construction dust [27, 77]. Se is frequently used as a marker of coal burning in many studies [75]. Although sodium hydroxide is often used in the exhaust gas desulfurization of coal-fired boilers, the final exhaust gas of coal-fired boilers often contains Na [77]. However, the concentration of Na was significantly greater than that of As at the SQ sampling site during the sampling period (χ2 = 119.853, P<0.001), and the EF of Na was only 7.0, which was much lower than that of As (EFAs = 39.8), indicating that Na was less influenced by humans than As. In addition, the EF of Na was close to 10, indicating that Na was affected by certain human activities. Therefore, Na may be derived mainly from construction dust. Factor 4 explains 5.8% of the total variance in the data, with the highest loading of V and high loadings of Co, Se Zn, and Fe, representing contributions from industrial emissions [36].
Fig. 8.
Varimax-rotated principal component loading for elements in PM2.5 in SQ a), in GP b), in JL c), and GH d).
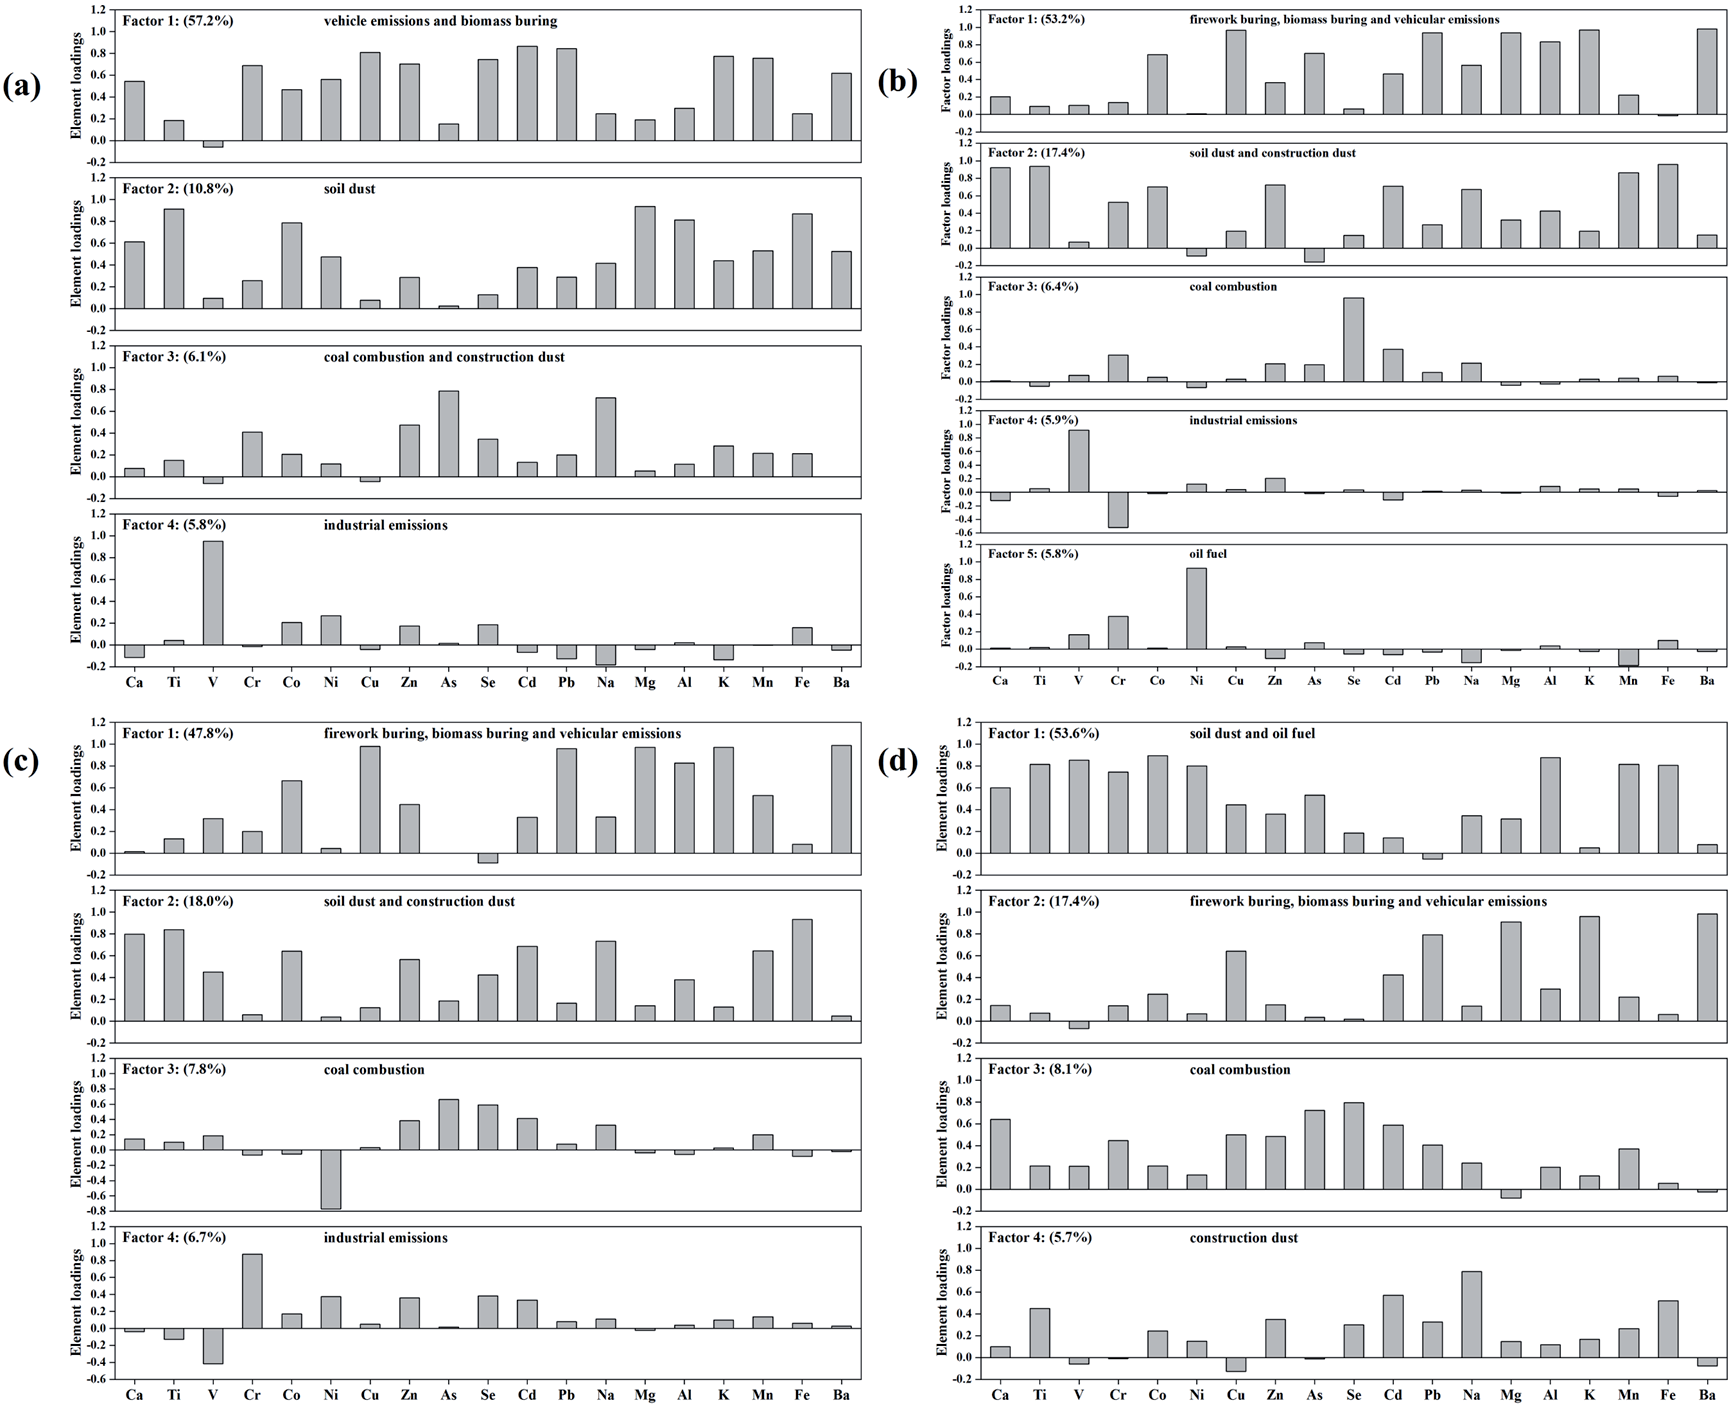
At the GP sampling site (the urban site), five principal component factors were found to explain the possible sources of elements in PM2.5 (Fig. 8b). Factor 1 accounts for 53.2% of the total variance in the data, with Ba, K, Cu, Pb, Mg, and Al exhibiting the highest loadings, representing a mixture of sources related to firework burning [20, 65], biomass burning [21, 25, 68-69] and vehicular emissions [23, 66-67]. The raw materials of fireworks are black powders, and their major components are sulfur, charcoal powder, potassium chlorate, or potassium nitrate. Metal powders containing Cu, Mg, Al, and Ba are used as flame coloring and glitter additives to add a festive effect. On February 9, 2016, the concentration of Ba was as high as 1.374 μg m-3, accounting for 0.63% of the total PM2.5. In contrast, the concentration of Ba was only 0.015 in the non-Spring Festival period, accounting for only 0.03% of the total PM2.5. While the concentrations and proportions of Cu, Mg, and Al were similar to those of Ba, their concentrations and proportions in PM2.5 increased significantly during the Spring Festival compared with those during the non-Spring Festival. Factor 2 (17.4%), with high loadings of Fe, Ti, Ca, and Mn, represents soil dust [40, 73] and construction dust [27, 77]. Factor 3, with a high loading of Se, accounts for 6.4% of the total variance and represents coal combustion [27, 75- 76]. Factor 4 accounts for 5.9% of the total variance in the data, with V exhibiting the highest loading and Zn and Ni exhibiting relatively high loadings, representing contributions from industrial emissions [36]. Factor 5, explaining 5.8% of the variance and exhibiting the highest loading for Ni and high loadings of Cr and V, is considered related to oil fuel [32-33].
At the JL sampling site (the urban site), four principal component factors were found to explain the possible sources of elements in PM2.5 (Fig. 8c). The metal sources at JL are similar to those at GP, and factor 1 accounts for 47.8% of the total variance in the data, with the highest loadings for Ba, Cu, K, Mg, Pb, and Al, representing a mixture of sources related to firework burning [20, 65], biomass burning [21, 25, 68-69] and vehicular emissions [23, 66-67]. Factor 2 (18.0%) is related to soil dust [40, 73] and construction dust [27, 77]. Factor 3 (7.8%) is related to coal combustion [27, 75-76] and is characterized by high loadings of As and Se. Factor 4 (6.7%), with the highest loading of Cr and high loadings of Se, Ni, Zn, and Cd, represents industrial emissions [36].
At the GH sampling site (rural site), four principal component factors were found to explain the possible sources of elements in PM2.5 (Fig. 8d). Factor 1 (total variance 53.6%) was assigned to emissions related to soil dust [40, 73] and oil fuel [32-33]. Al, Ti, Mn, and Fe had high loadings in this factor and are indicative of primary crustal sources. V and Ni are considered markers of oil fuel. Factor 2 accounts for 17.4% of the total variance in the data and has high loadings of Ba, K, Mg, and Pb, suggesting that firework burning [20, 65], biomass burning [27, 75-76], and vehicular emissions [27, 75-76] were the major contributors. Factor 3 accounts for 8.1% of the total variance in the data, with high loadings of As and Se representing contributions from coal combustion [27, 75-76]. A high loading of Na is observed in factor 4 (5.7%), which is considered related to construction dust [27, 77].
In general, the metal sources of PM2.5 at the urban sampling sites in Nanchong were consistent. Biomass burning, vehicular emissions, firework burning, soil dust, and construction dust were the most important sources of metals in PM2.5, and the total contribution of these sources was greater than 65%. Additionally, the contributions of coal combustion and industrial emissions were relatively low, while contributions from oil fuel were observed only at the GP sampling site. For the rural GH sampling site, the metal sources with the highest contributions to PM2.5 were soil dust, oil fuel, firework burning, biomass burning, and vehicular emissions, whereas the contributions of coal combustion and industrial emissions were lower. Nanchong is an agricultural city with a low level of industrial development. Owing to the lack of relevant straw treatment technology and the high cost of straw treatment, many stalks are directly burned in the open air after crop harvest, resulting in a sharp increase in the PM2.5 concentration. In addition, Nanchong City is developing rapidly, and it features a large population and a high number of motor vehicles. By the end of 2022, the number of motor vehicles in Nanchong was close to 1.2 million, and the total acreage and population of the main urban area were 171 square kilometers and 1.61 million, respectively. Therefore, vehicular emissions and construction dust are important sources of urban air pollution. In contrast, owing to the lower level of industrialization, the demand for coal in Nanchong has not been high, and since 2000, the main urban area of Nanchong has implemented the policy of replacing coal with gas. Therefore, the contributions of coal combustion and industrial emissions to PM2.5 were small.
Conclusions
During the study period, the average concentrations of PM2.5 in SQ, GP, JL, and GH were 63.03±4.20 μg m-3, 58.89±4.80 μg m-3, 61.70±4.41 μg m-3, and 60.13±4.28 μg m-3, respectively, which exceeded the Grade II Standard of China’s National Air Quality Standard for PM2.5 by 0.80, 0.68, 0.76, and 0.72 times, respectively. The new Ambient Air Quality Standard (GB 3095-2012) replaced GB 3095-1996 and was implemented in China in 2014, and PM2.5 was a newly added monitoring item. During this period, China’s economy was in a period of rapid development, and the control of PM2.5 in most cities was still in the exploratory stage. As a result, Nanchong, like other cities in China, faces serious PM2.5 pollution.
Nanchong City is located in the northeastern Sichuan Basin, it is low in elevation, and the meteorological conditions do not favor pollutant diffusion. Because of these poor meteorological diffusion conditions for pollutant dispersal (such as low wind speeds and high frequencies of calm winds) and advantageous conditions for generating PM2.5 (such as higher temperatures and relative humidity), the PM2.5 in Nanchong City mainly originates from surrounding areas. There was little difference in PM2.5 concentration between the main urban area and the rural areas, and the seasonal trends were the same, with the highest concentration occurring in winter, intermediate values occurring in spring and autumn, and the lowest concentration occurring in summer.
The total concentrations of the analyzed trace elements in SQ, GP, JL, and GH were 2.81±0.26 μg m-3, 3.13±0.73 μg m-3, 3.43±0.62 μg m-3, and 2.55±0.26 μg m-3, respectively, and the mass fractions of those elements in PM2.5 were 4.84%±0.25%, 4.83%±0.39%, 5.05%±0.42%, and 4.55%±0.25%, respectively. The total concentrations of the analyzed trace elements and their mass fractions in PM2.5 did not significantly differ among the four sites. The seasonal variation trends of the analyzed trace elements at the four sites were consistent, with the highest occurring in winter, intermediate values occurring in spring or autumn, and the lowest occurring in summer. However, the seasonal variation trends of the mass fractions of the 19 elements in PM2.5 at the four sites exhibited the highest values in autumn and lowest in spring or summer.
The crustal elements K, Ca, Al, Na, Fe, Mg, and Ti were the most abundant in PM2.5 in Nanchong, and their contributions to the total mass of the analyzed trace elements were 93.50%±0.20%, 93.01%±0.30%, 93.03%±0.26%, and 94.27%±0.21% at the SQ, GP, JL, and GH sites, respectively. The EF of K in Nanchong City was close to 20, indicating that it was mainly contributed by anthropogenic sources, and the EFs of other crustal elements were less than 10, indicating that they were derived primarily from natural sources. In contrast, the remaining 12 elements (Mn, Cu, Zn, As, Cd, Se, Ni, V, Pb, Co, Ba, and Cr) accounted for only 5.73%- 6.99% of the total mass of the analyzed trace elements in Nanchong. Nevertheless, the EFs of these elements were each much greater than 50, suggesting that they were contributed mainly by anthropogenic sources.
Nanchong City has a large population, its economy is mainly agricultural, and its industrial development is relatively weak. The PCA results revealed that the PM2.5 in the urban area of Nanchong City mainly originates from natural sources such as soil dust and anthropogenic sources such as biomass burning, construction dust, vehicular emissions, and firework burning. In rural areas of Nanchong City, the PM2.5 mainly originates from soil dust, oil fuel, biomass burning, firework burning, and vehicular emissions. The contributions of coal combustion and industrial emissions to PM2.5 were lower in the urban and rural areas of Nanchong City.

