

Introduction
Ecological vulnerability can have a dampening effect on high-quality economic development. With the rapid development of human society, global environmental problems, such as climate change and environmental pollution, have become increasingly prominent, making it increasingly important to assess the vulnerability of regional ecosystems scientifically and continuously [1, 2]. Chongqing Municipality has harsh natural conditions, and with the development of tourism, population, resource, and environmental problems are becoming more and more prominent, and the ecological environment of the region is receiving more and more attention [3]. The rapid development of urbanization and industrialization, especially after the completion of the Three Gorges Reservoir, has made ecological problems more prominent and more acute contradiction between resources and the environment. Atmospheric pollution, water pollution, soil erosion, desertification, and the accelerated extinction of species have seriously constrained the sustainable development of the region [4, 5]. However, there is still a lack of research on the ecological vulnerability of small areas in the county of Chongqing Municipality. Therefore, ecological vulnerability evaluation, spatial analysis, and prediction are important issues in the context of the country’s new development model.
At present, research on ecological vulnerability mainly focuses on the refinement of the research scale, the construction of the evaluation index system, and the diversification of evaluation methods [6]. Most of the research scales of regional ecological vulnerability by Chinese scholars are based on the background of large area scales of provinces and watersheds; correspondingly, there are relatively few researches on the ecological vulnerability of small areas of counties [7, 8]. Only a few scholars studied the ecological vulnerability of Chongqing Municipality [9, 10], whose evaluation index is relatively single, and fewer spatial relevance analysis researchers. Moreover, the simulation prediction of the future development trend of ecological vulnerability has been ignored. The evaluation models selected by researchers vary according to the natural conditions and anthropogenic factors in different regions. The earliest proposed is the Pressure-State-Response (PSR) model, in which the interaction between humans and nature is clear [11, 12]. In addition to this, there is the Vulnerability Scoping Diagram (VSD) model [13, 14], the distributed hydrological model [15], the pressure-sensitivity-elasticity (PSE) model [16], the object-element model [17], the gray trigonometrically whitening weight set pair analysis (SPA) model [18], and the Sensitivity-Resilience-Pressure (SRP) model [19, 20]. The existing evaluation models selected for the current study lack a comprehensive analysis of the ecological problems and evolutionary characteristics in the study area. With the refinement of the scale of the evaluation object and the in-depth study of the evaluation model, the evaluation methods have become more and more systematic and diversified. Currently, the main evaluation methods include the analytic hierarchy process(AHP) [21], the entropy weight method(EWM) [22-24], the BP neural network method [25, 26], the Bayesian network method [27, 28], the fuzzy comprehensive evaluation method [29-31], and principal component analysis [32-34]. The evaluation methods selected for the existing studies rarely reflect specific differences in the degree of ecological vulnerability within the region.
This study mainly achieves the following objectives:
1) Establish an ecological vulnerability evaluation method based on PCA and GIS; 2) Based on the SRP evaluation model, construct the county small area ecological vulnerability evaluation index system; 3) Analyze the spatial and temporal distribution of ecological vulnerability in Chongqing Municipality, and carry out spatial correlation analysis and hot spot analysis; 4) Using the gray prediction model GM(1,1) to predict the ecological vulnerability of Chongqing Municipality in 2025, to analyze the spatial and temporal distribution of ecological vulnerability and the trend of change, to provide a scientific basis for the ecological environmental protection and restoration of Chongqing Municipality and to promote the high-quality development of the region.
Material and Methods
Study Area
Chongqing Municipality is situated in the southwest of China, in the upper reaches of the Yangtze River (105°11′~110°11′E, 28°10′~32°13′N). As a direct-controlled municipality of China and a key national center city, it is a megacity encompassing 38 districts and counties, with a total area of 82,300 square kilometers and a population of approximately 31 million permanent residents [35]. The altitude of Chongqing Municipality ranges from 73.1m to 2796.8m, with the terrain gradually decreasing from south to north along the Yangtze River valley. The northwest and central parts of Chongqing Municipality are mainly hilly and low mountainous, while the southeastern part has a lot of slopes due to the Daba Mountains and Wuling Mountains [36]. Chongqing Municipality has a subtropical monsoon humid climate, with an average annual temperature of 16-18°C. The average annual rainfall is 1000-1350mm, making Chongqing Municipality rich in climate resources, but prone to frequent meteorological disasters [37]. The major rivers in Chongqing Municipality include the Yangtze River, Jialing River, Wujiang River, Fuliang River, Qijiang River, Daning River, Apeng River, Youshui River, etc. The main stream of the Yangtze River traverses the whole territory from west to east, crossing three anticlines in the Wushan Mountains and forming the famous Qutang Gorge, Wu Gorge, and Xiling Gorge [38].
Data Source
The study data mainly come from remote sensing data, meteorological data, socio-economic data, and other data of Chongqing Municipality in 2010, 2015, and 2020 (Table 1).
Data Processing
1) Remote sensing data, including Normalized Vegetation Index (NDVI) and land use data. The normalized vegetation index involves preprocessing NDVI and NPP data by stitching, clipping, and reprojection transformation using MODIS Reprojection Tool and ArcGIS 10.8. Subsequently, the maximum value composite method (MVC) is applied to reduce errors caused by cloud cover, atmospheric conditions, and solar elevation angle disturbances, thereby enhancing data accuracy. The authors synthesized NDVI data into annual data to obtain the average values of each district. Land use data, through ERDAS, ArcGIS software human-computer interaction interpretation, and field survey validation [39], radiometric and geometric correction processing is carried out on remote sensing data of thematic mapper (TM) and operational land imager (OLI) in different periods, so as to obtain six land use types, namely, cropland, forest land, grassland, watersheds, built-up land, and unutilized land [40]. After resampling and clipping, the author can extract 1km resolution annual raster data of land use in each district of Chongqing Municipality and then calculate the land use extent index L calculated for each county, as shown in Formula (1).
Table 1.
Data sources for study.
Table 2.
Parameters for different levels of land use.
| Land use intensity parameters | 0.545 | 0.114 | 0.215 | 0.12 | 0.936 | 0.063 |
| Land use type | Cropland | Forest land | Grassland | watersheds | Built-up land | Unutilised land |
where ηi is the proportion of the area of the region covered by the ith land-use type; Pi is a parameter for the degree of land use of the ith land-use type (Table 2).
2) Other data include elevation and the Shannon diversity index (SHDI). Elevation data, generated by resampling based on SRTMV4.1 data, were cropped to extract 1km resolution annual average data for each county. The Shannon diversity index, based on land use data, is equal at the landscape level to the negative of the sum of the area ratios of each patch type multiplied by the natural exponent of its value, as in Formula (2), which can be calculated by Fragstats 4.2 software.
Where n is the number of landscape types and Pi is the proportion of area occupied by landscape type i.
3) Data standardization. Due to the different units, value sizes, and indicator types of each variable in the raw data, in order to eliminate data bias arising from the variable’s magnitude and range of variation. This paper standardizes the data in terms of polar deviation, with Formula (3) for positive indicators and Formula (4) for negative indicators, and the results take the values of [0,1].
Where ximax and ximin are the maximum and minimum values of the ith indicator, respectively.
Methodology
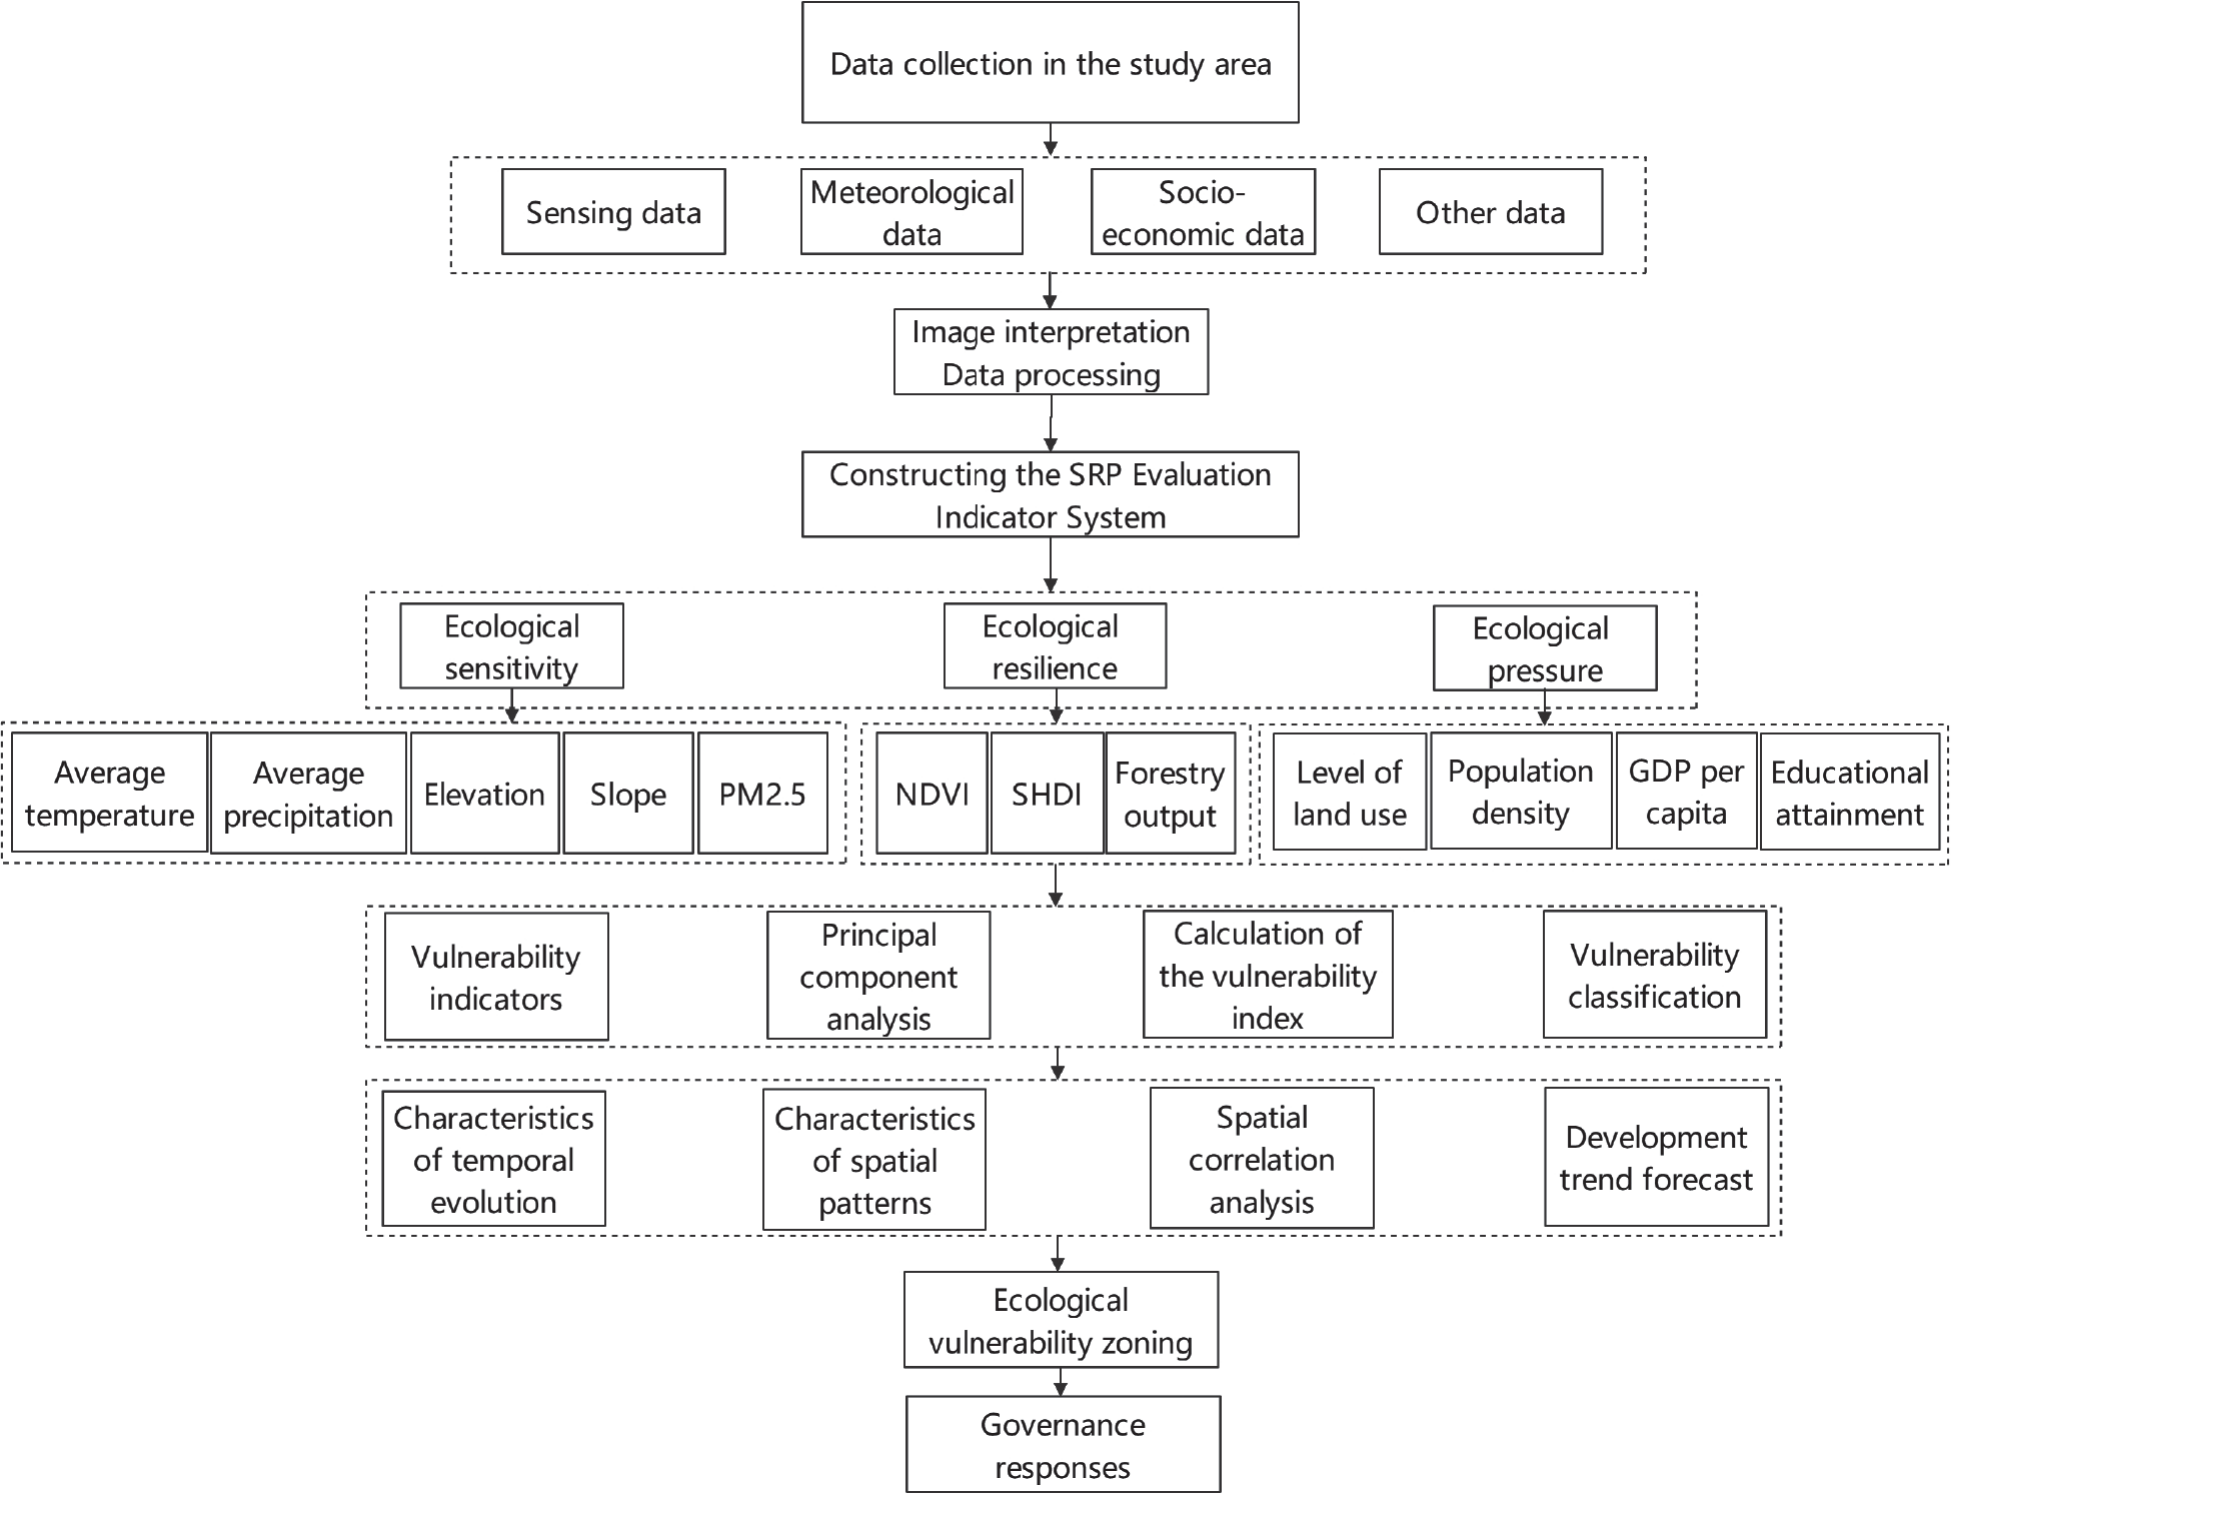
The SRP model is a comprehensive evaluation model with strong causality, premised on ecosystem stability, and capable of comprehensively analyzing ecological vulnerability [41, 42]. The SRP model and PCA method have been widely used in the China ecological vulnerability evaluation [43–45]. The authors comprehensively analyzed the ecological condition of Chongqing Municipality to study the spatial and temporal characteristics of the ecological vulnerability of Chongqing Municipality as well as its future prediction (Fig. 1).
Evaluation Index System
Ecological vulnerability is the result of the interaction between nature and humans [46]. The ecological sensitivity in the SRP model is the sensitivity to the geological and climatic environment. The ecological recovery in the SRP model is the ability to recover to the original state after an external disturbance. The ecological pressure degree in the SRP model is the pressure of ecosystems being disturbed by social factors [47-49]. In this paper, 12 evaluation indicators that are representative and in line with the characteristics of the study area were selected and classified into positive and negative indicators according to the influence of each indicator on the ecological vulnerability index (Table 3).
Principal Component Analysis
The Principal Component Analysis (PCA) method can transform relevant multivariate spatial data into a few irrelevant composite indicators by rotating the original spatial axes. PCA has the advantage that it can maximize the retention of spatial information reflected in the original larger number of variables by using a smaller number of composite indicators, but its accuracy depends on the cumulative contribution rate of the principal components [50-53]. The score of each principal component is calculated as in Formula (5).
where Yj is the score of the jth principal component; zij is the eigenvector corresponding to evaluation index i (i = 1, 2, ..., n) in the jth principal component.
Table 3.
Chongqing Ecological Vulnerability Evaluation Indicator System.
Calculated Ecological Vulnerability
The Ecological Vulnerability Index (EVI) is used to express the degree of ecological vulnerability, as shown in Formula (6).
where EVI is the Ecological Vulnerability Index; Yj is the score of the jth principal component; and wj is the contribution rate corresponding to the jth principal component.
Spatial Correlation Analysis
The global Moran index analyzes the degree of clustering of a variable at different scales (Formula 7) [54]. It can clearly determine whether there is a spatial aggregate of ecological vulnerability in the study area, and its limitation is that it can only measure the spatial correlation between geographical elements.
Where xi, xj are the ith and jth spatial region fragile values; –x is the fragile average of all regional attribute values; wij is the spatial weight matrix between regions; s is the sum of the elements of the spatial weight matrix; n is the number of regions.
Hot Spot Analysis
The hot spot analysis (Getis-OrdG*i) method is capable of identifying spatial clustering of high (hot) and low (cold) values of data so as to reveal the clustering characteristics of spatial points. This method has been widely used in ecological vulnerability studies (Formula 8) [55]. Its advantage is that it can clearly show the spatial distribution of high values (hot spots) and low values (cold spots) of the data. Nevertheless, if the number of samples in the study area is too small or the confidence level is low, the characteristics of the spatial distribution of the high and low values will be very unclear.
where xj and xi are the ecological vulnerability index values of patches j and i, respectively, and Wij is the spatial weight array. Z-test was also performed on G*i. If G*i is significantly positive, it means that the ecological vulnerability index is highly clustered, i.e., it is a hot-spot area; conversely, it is a cold-spot area.
Driver Analysis
Geodetector is a spatial statistical method whose main objective is to detect spatial heterogeneity and explain the causal relationship between the independent variable and its influences [56]. The advantage is that it is easy to analyze the driving forces and influencing factors of various phenomena, but the independent variables need to be discretized and converted into type quantities. In this paper, the authors use the factor probing of Geodetector, with 12 indicators as independent variables and EVI values as dependent variables, to explore the magnitude of the influence of the independent variables on the dependent variables, which is expressed by the q-value, as shown in Formula (9).
Table 4.
Model fit class
where q is the degree of explanation of ecological vulnerability by the evaluation factors; n is the number of samples; L is the number of indicator classifications; Nh is the sample size of the stratum; σh2 is the variance of the ecological vulnerability index of the h stratum; σ2 is the variance of the ecological vulnerability index of the whole region.
Prediction Methodology
The gray prediction model GM(1,1) is a prediction method based on gray system theory, where a differential equation model is built based on the generated data and then the predicted values are obtained by cumulative reduction [57]. The advantage is that more reasonable short- and medium-term predictions can be obtained from less data. However, if the original data pattern does not conform to the exponential pattern and it is a long-term prediction with a low model fit rating, the prediction will not achieve the ideal effect [58].
The ecological vulnerability value values of each district and county in Chongqing Municipality are used as the original sequence, and the original sequence is set to be x(0) (Formula 10). A single cumulative generative transformation is performed on the original series to generate a new sequence x(1) (Formula 11). Let a cumulative generating sequence x(1) satisfy the first-order ordinary differential equation (Formula 12), transform to obtain Formula (13), and apply the least squares method to find the parameters a and b. After matrix operations, the time response function (Formula 14) of the gray prediction model GM(1,1) is obtained, which is calculated to obtain the fitted value of x(1)(t), and back-substituted to obtain the predicted value of x(0)(t). Two methods were used in this study to test the model predictions, as shown in Table 4.
Results and Discussion
Analysis of Ecological Vulnerability Results for Chongqing
The evaluation indicators of the ecological vulnerability of Chongqing Municipality from 2010 to 2020 were subjected to principal component analysis. By calculating the contribution rate of each factor as well as the cumulative contribution rate of all factors, the top six indicators with a cumulative contribution rate of more than 95% were extracted as principal component factors (Table 5). The score Yj of each evaluation index on the six principal components was calculated, and finally, the ecological vulnerability index EVI was calculated.
Based on the natural, social, economic, and environmental characteristics of the study area, this paper uses the natural breakpoint method in ArcGIS 10.8 to classify the 2010–2020 EVI into five classes: micro vulnerability, mild vulnerability, moderate vulnerability, severe vulnerability, and extreme vulnerability (Table 6).
Analysis of the Spatial and Temporal Distribution and Drivers of Ecological Vulnerability
By using ArcGIS10.8, the authors obtained the spatial distribution of ecological vulnerability assessment in Chongqing during 2010–2020 (Fig. 2). From the perspective of spatial distribution, there is obvious heterogeneity in the northeast, southeast, central, and western regions of Chongqing. The details are as follows: the northeastern part of the city is dominated by micro vulnerability and mild vulnerability; the south is dominated by mild vulnerability; the central part is dominated by mild vulnerability and moderate vulnerability; and the west is dominated by severe vulnerability and extreme vulnerability.
In terms of time, there is a general upward trend in ecological vulnerability in Chongqing; however, there are also local declines in some areas. (Table 7). Ecological vulnerability levels are mainly distributed between mild, moderate, and severe vulnerability.
From 2010 to 2015, an area of 7076 km2 was transferred from moderately and above vulnerable areas to lower vulnerable areas (Table 8). The ecological vulnerability decreased, mainly in Fengdu County, Qijiang District, and Dazu District.
Table 5.
Results of spatial principal component analysis by period.
Table 6.
Ecological vulnerability level.
From 2015 to 2020, the area of moderately or above vulnerable areas transformed into more highly vulnerable areas is 10,115 km2 (Table 9). The ecological vulnerability is on an upward trend, which is mainly distributed in Beipei District, Bishan District, Rongchang District, Yongchuan District, Yubei District, and Changshou District.
Using a geodetector to statistically analyze the driving factors, the magnitude of the explanatory power of each factor on the ecological vulnerability index is shown in Table 10. p<0.01 in the table indicates that the evaluation index passed the significance test. In 2010, the three factors that had the greatest impact on the vulnerability of the study area were population density, land use, and vegetation index, followed by GDP per capita, PM2.5, and elevation, and the impact of the other factors was relatively small. In 2015, the three factors that had the greatest impact on the vulnerability of the study area were population density, land use, and PM2.5, followed by vegetation index, GDP per capita, and elevation, while the other factors had relatively little impact. In 2020, the three factors that had the greatest impact on the vulnerability of the study area were vegetation index, land use, and population density, followed by PM2.5, GDP per capita, and elevation, while the other factors had relatively little impact. Overall, the explanatory power of the drivers for ecological vulnerability varied slightly, but the main drivers were essentially the same, with socioeconomic and vegetation factors playing a dominant role.
Spatial Correlation Analysis of Ecological Vulnerability
1) Calculation of the global Moran index
The results of the global Moran’s index for Chongqing Municipality’s ecological vulnerability index in 2010, 2015, and 2020 are shown in Table 11. Table 11 shows that the Moran’s index has been positive across all years, fluctuating between 0.63 and 0.74. The P-value is less than 0.01, indicating that the results are significant at the 1% level, and there is a strong positive correlation between ecological vulnerability and geographic location. Specifically, the more similar the ecological vulnerability is as the spatially distributed locations are clustered, the more there are differences in ecological vulnerability as the spatially distributed locations are discrete.
2) Calculation of the Local Moran’s Index and LISA Clustering Diagram
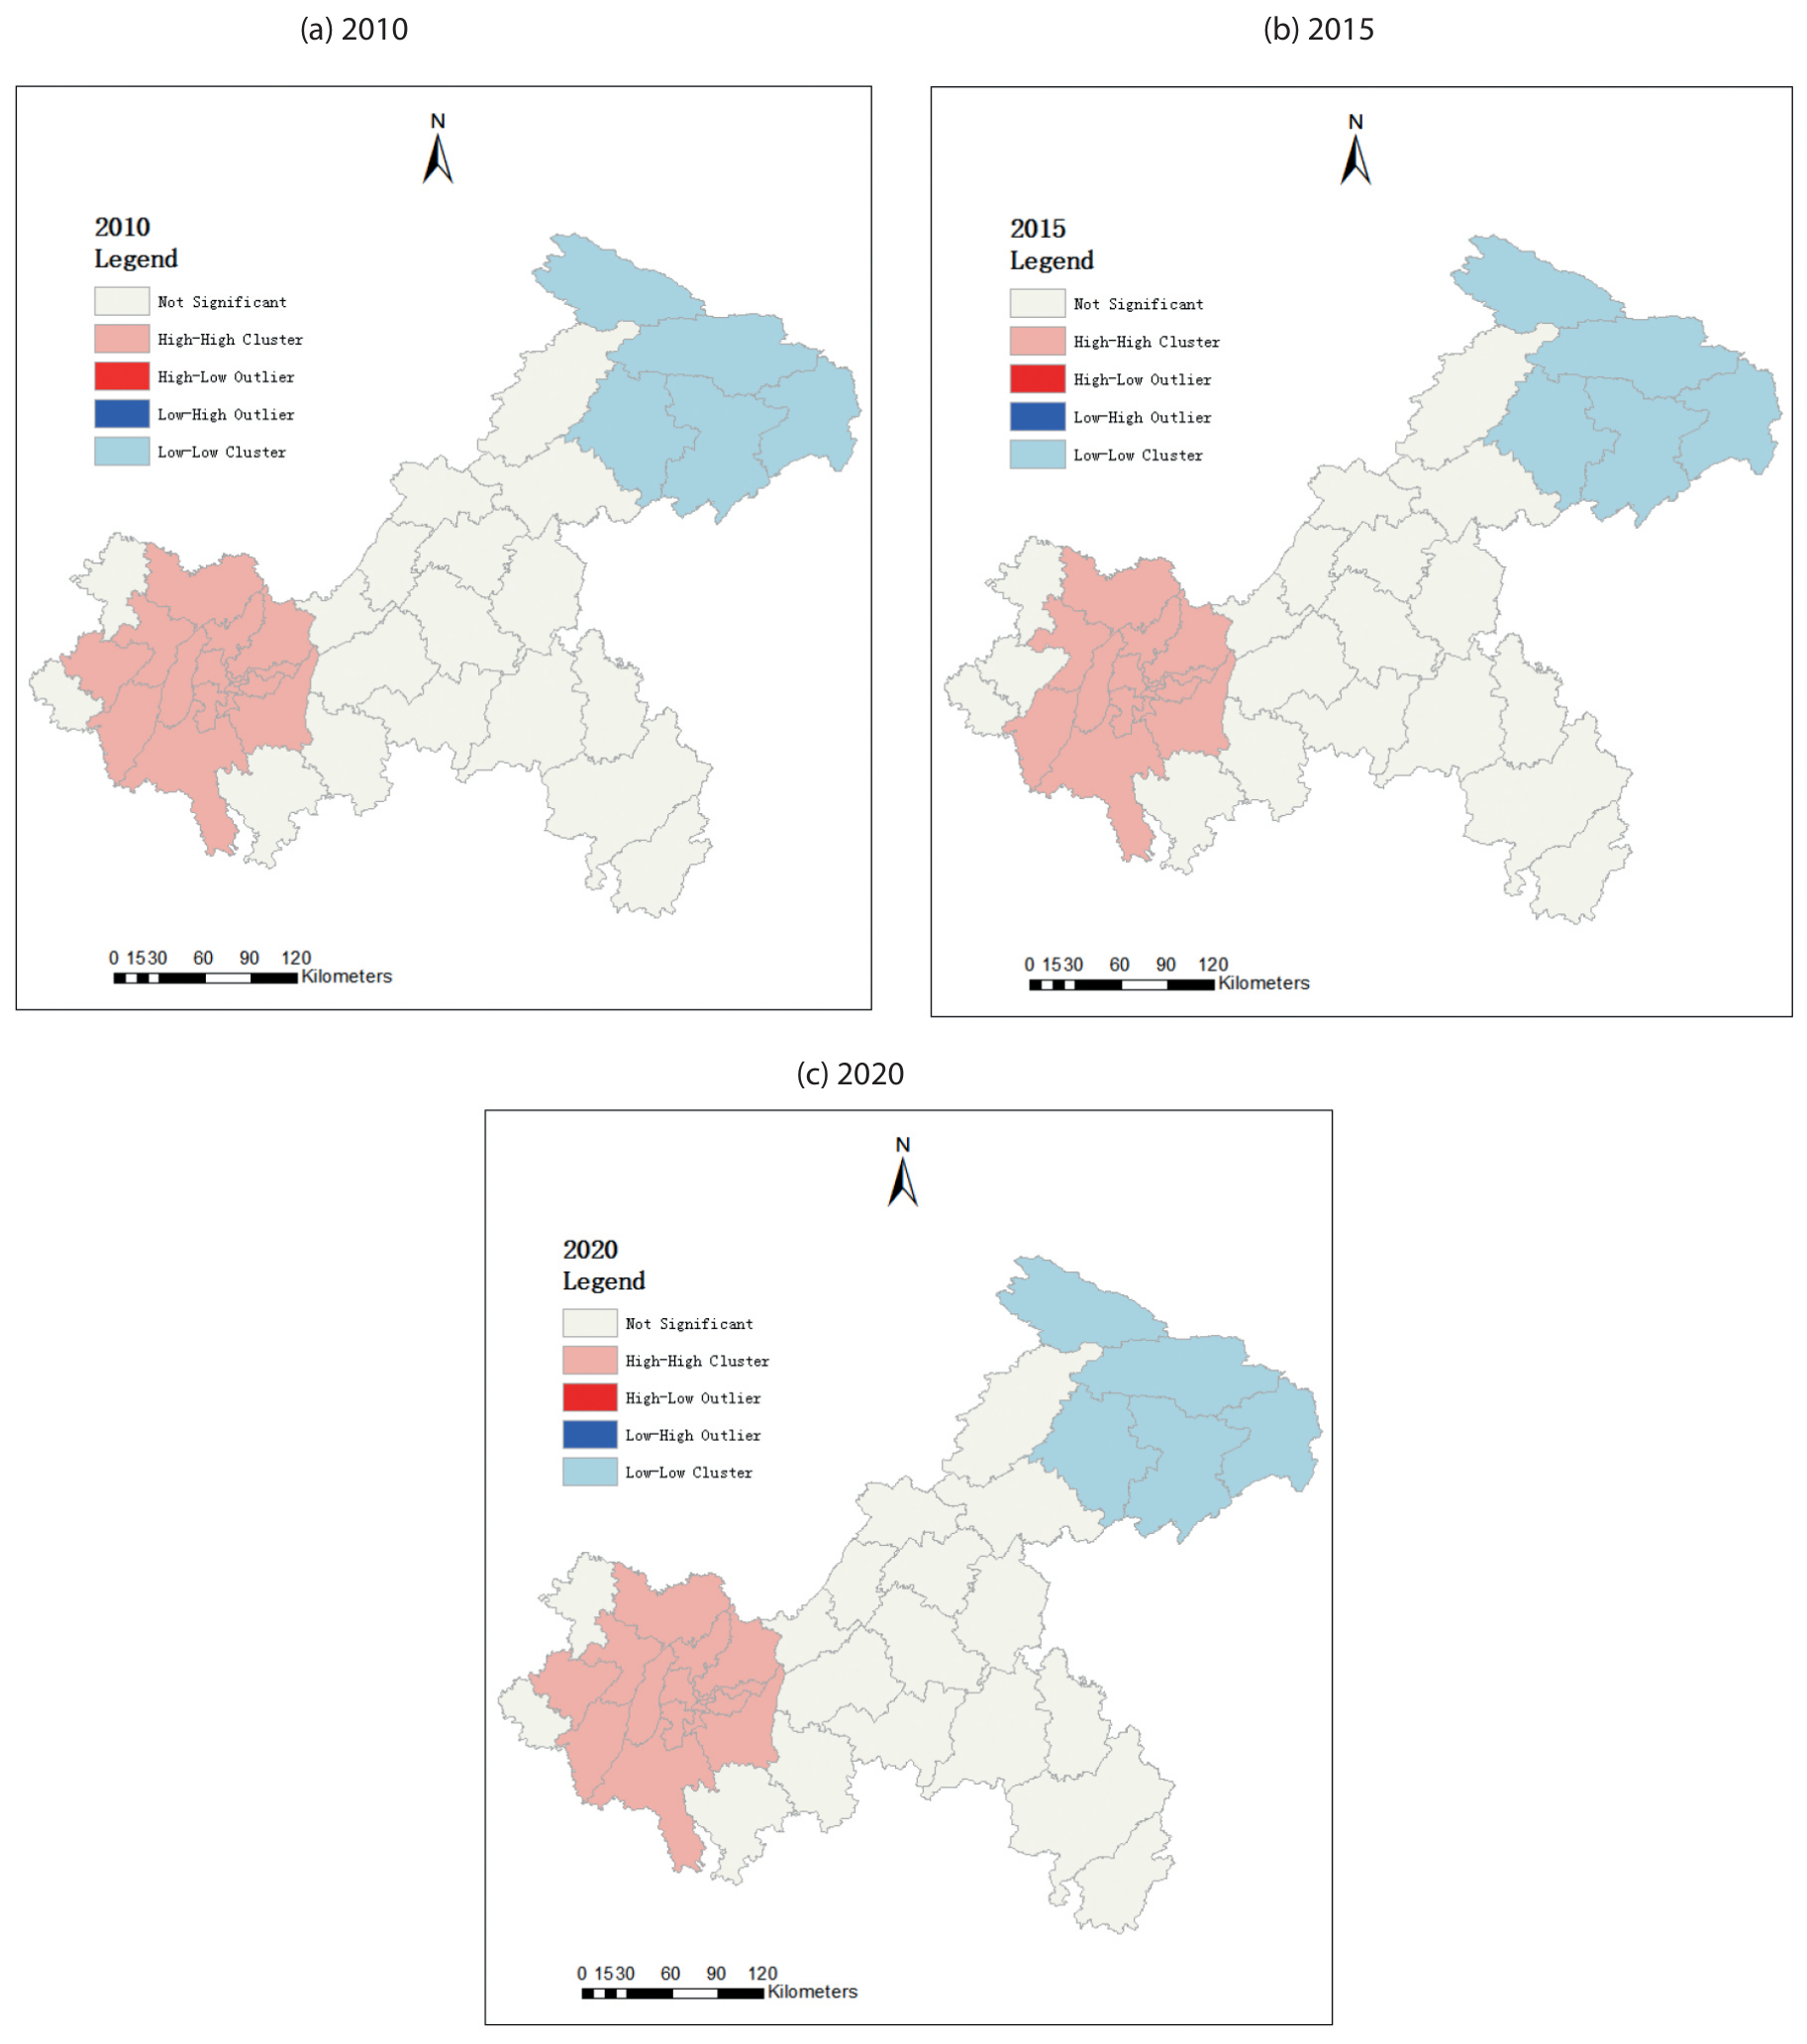
The Local Moran Index (LMI) was calculated using the 2010–2020 Ecological Vulnerability Index (EVI), and the LMI was clustered to further analyze the spatial aggregation patterns of ecological vulnerability. Through the LISA clustering map of ecological vulnerability in Chongqing (Fig. 3), it can be seen that the clustering characteristics are stable but spatial heterogeneity exists. The counties in the northeast, such as Chengkou, Wuxi, Wushan, Fengjie, and Yunyang, all show a low-low aggregation pattern, indicating that the ecological vulnerability is relatively stable. Moreover, the low ecological vulnerability of the surrounding cities, are low-value aggregation areas. The ecological vulnerability of the cities in the west, such as Yuzhong District, Yubei District, Banan District, and Jiangjin District, is high. The surrounding cities are also at high values, which is a high-value agglomeration area, indicating that the county’s ecological vulnerability is high and insufficient ecological regulation. Furthermore, all of these areas are characterized by a scarcity of natural resources, overexploitation of construction land, and more serious soil erosion.
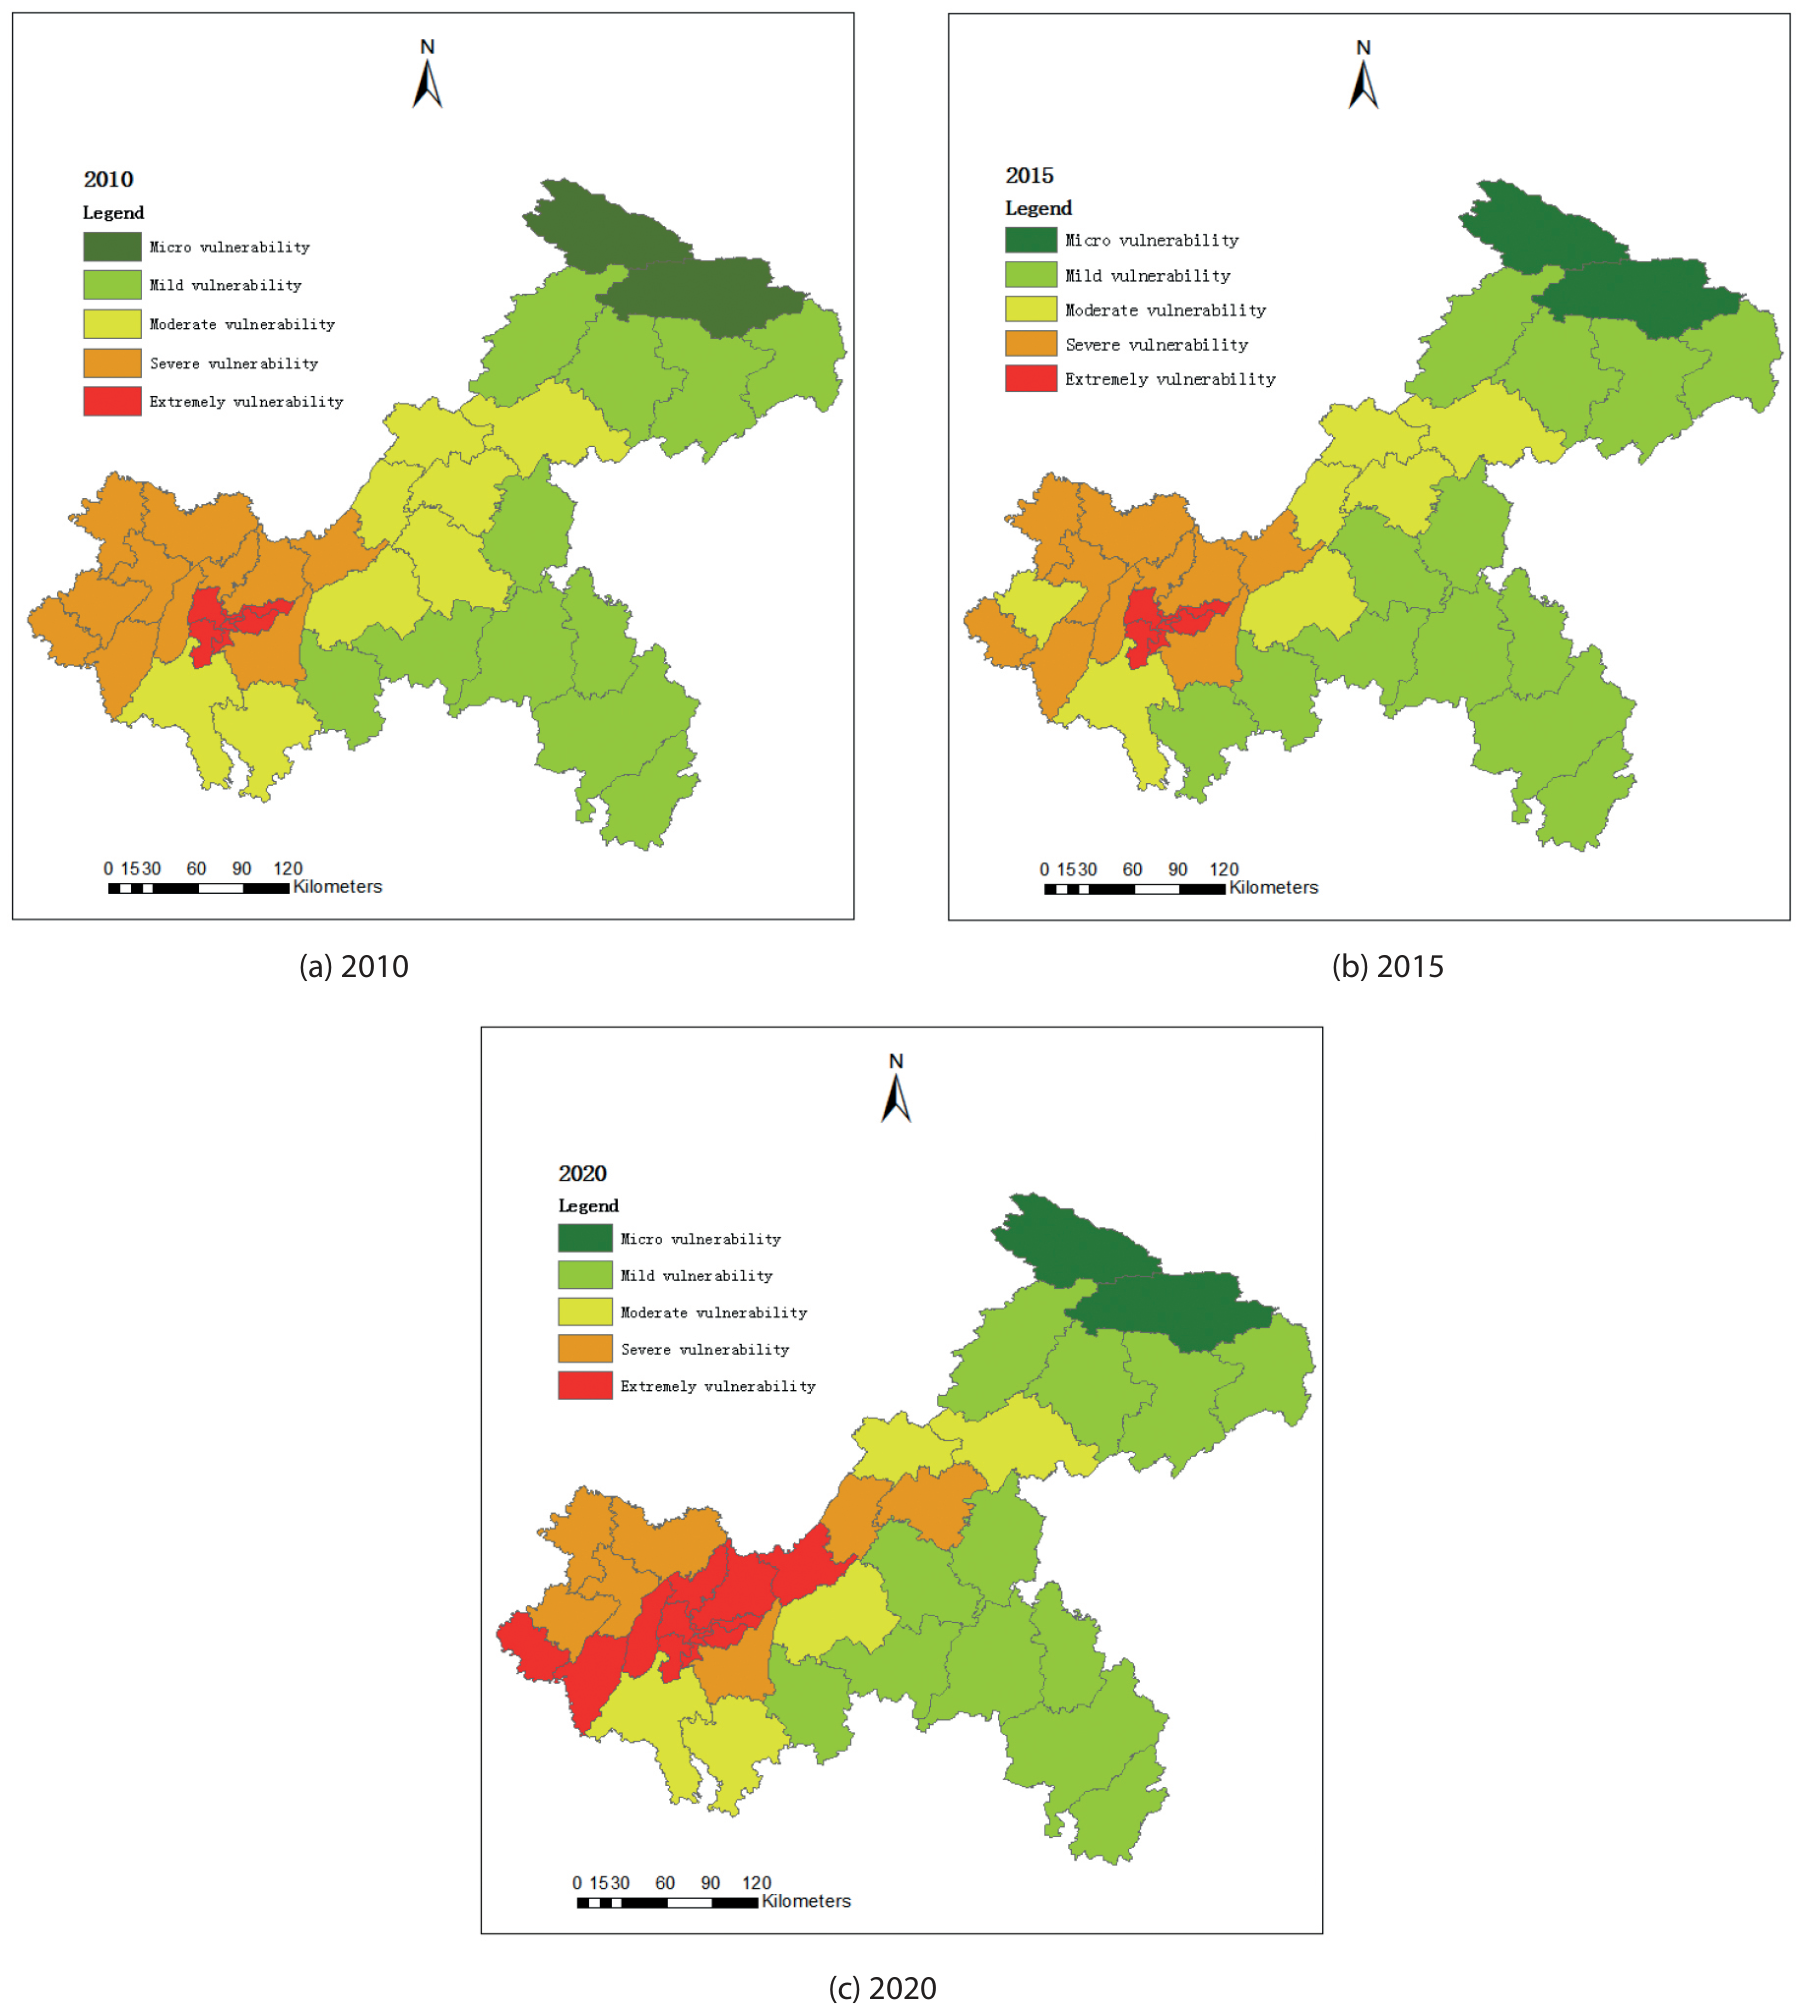
Table 7.
Changes in the area of ecological vulnerability in Chongqing.
Table 8.
Area transfer matrix for ecological vulnerability rating 2010–2015 (km2).
Table 9.
Area transfer matrix for ecological vulnerability rating 2015–2020 (km2).
Ecological Vulnerability Prediction
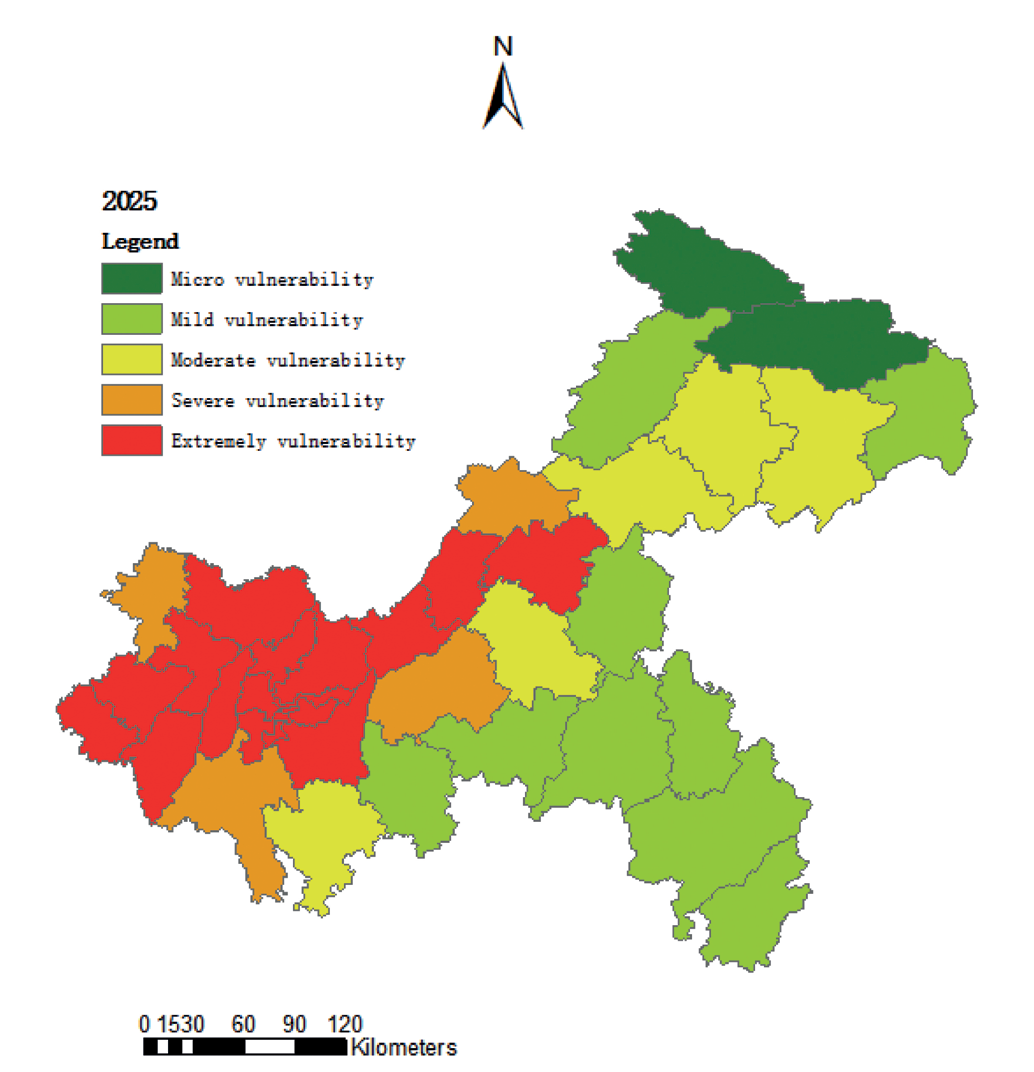
The ecological vulnerability prediction of Chongqing Municipality meets the requirements of the gray prediction model. The relative residuals μ<0.01, variance ratios C < 0.35 of 38 counties, and model fit grades reached level 1 (excellent), indicating that the prediction model had a high level of accuracy, and the results are reliable. Therefore, it is suitable for the prediction and simulation of the ecological vulnerability of Chongqing Municipality in 2025. Using the data from 2010, 2015, and 2020, the ecological vulnerability of Chongqing Municipality in 2025 can be predicted (Fig. 4). As a whole, in 2025, moderate vulnerability will have a spatial expansion trend in the northeastern part of Chongqing Municipality, and extreme vulnerability will have a tendency to spread to the periphery and the east. Specifically, in the northeast, moderate vulnerability areas will expand from Wanzhou District to surrounding areas, and mild vulnerability will decrease significantly. In the west, the Yuzhong, Yubei, and Yongchuan districts as the centers, the area of moderate vulnerability turned into severe and extreme vulnerability increased significantly. The above phenomena are caused by the following reasons: Chongqing Municipality had a large gap in infrastructure needs during the epidemic and was under extreme pressure. Chongqing Municipality experienced a “retaliatory” increase in production and consumption in the aftermath of the epidemic. Chongqing Municipality has an urgent need for economic recovery and development, and its human activities, such as irrational reclamation and rough management, have a greater impact on the surrounding ecology, leading to a more serious ecological vulnerability of the region.
Table 10.
Geodetector explanatory factor q-value statistics.
Discussion on Evaluation of Ecological Vulnerability
This study combines a large number of methodological models and indicators to evaluate, spatially analyze, and predict the ecological vulnerability of Chongqing Municipality. The results of this study can provide a theoretical basis and decision support for land use optimization decision-making, ecological risk prevention, and regional ecosystem sustainable management in Chongqing. However, the evaluation of regional ecological vulnerability has not formed a unified evaluation standard, and further research is still needed on the method of selecting indicator parameters. In addition, there is a clear trend of increasing ecological vulnerability in Chongqing. Government departments need to balance the relationship between ecological restoration and economic growth and strengthen systematic planning for ecological restoration. For micro and mild vulnerability areas, the protection of existing vegetation and ecological diversity needs to be further strengthened to achieve green and ecological development in agriculture and animal husbandry on the basis of small areas in counties. For moderate vulnerability areas, it is necessary to actively do a good job of returning farmland to forests and grasslands, insisting on comprehensive conservation and efficient use of resources, and constructing a guarantee for green development. In heavily and extremely vulnerable areas, government departments should focus on the development of green industries, such as energy-saving and environmental protection industries and eco-environmental industries. At the same time, it is necessary to do a good job of ecological early-warning monitoring and public opinion campaigns and to strengthen the education of the public on ecological protection awareness.
Conclusions
Taking the 38 counties of Chongqing Municipality as the research object, the ecological vulnerability of Chongqing Municipality has been evaluated, spatially analyzed, and predicted using remote sensing data, meteorological data, and socio-economic data. By calculating the EVI for 2010– 2020 and projecting the EVI for 2025, the authors draw the following main conclusions:
1) Ecological vulnerability studies in small areas of Chongqing County reflect specific differences within the region, with a general trend of “overall stability but local enhancement”. There is less variation in ecological vulnerability in the eastern low-value agglomerations, while the western high-value agglomerations are expanding outward.
2) From the analysis of the driving forces of ecological vulnerability evolution in Chongqing, the effects of all indicators are significant, with socio-economic and vegetation factors playing a dominant role in the region, especially those of population density, land use, PM2.5, vegetation index, GDP per capita, and elevation.
3) From 2020 to 2025, the area of light and slight vulnerability turning into medium vulnerability is 10,629 km2, and the area of more than medium vulnerability turning into heavy and extreme vulnerability is 17,349 km2, with a clear upward trend of ecological vulnerability. Human beings should further reduce the intervention of economic activities, actively restore vegetation cover, and reduce the level of irrational land exploitation and utilization in order to achieve sustainable development of the regional economy.

