

Introduction
Water constitutes the fundamental basis for the existence of the Earth’s organisms. Water resources play a crucial role in maintaining the planet’s ecological environment and are essential for the sustainable development of the global environment. The water resources encompass surface water and groundwater, and these water resources can be utilized for irrigation, power generation, water supply, shipping, aquaculture, and other purposes. The surface water bodies include rivers, lakes, wells, springs, tides, and reservoirs. Wherein reservoirs are a unique artificial construction that functions as water storage, electric power generation, tourism, and aquaculture. With rapid urbanization, industrialization, and agricultural development, the demands for clean and safe water resources have escalated, leading to a global water shortage. Many countries prioritize the development of water conservation projects, investing heavily in the construction of reservoirs, embankments, and various water storage facilities to balance supply and demand. For example, China has constructed 97,264 reservoirs with a storage capacity of approximately 810.41 billion m3, and 756 new reservoirs are being built with a capacity of 12.190 billion m3 [1, 2].
Nowadays, reservoirs have increasingly served as drinking water sources for major cities, and they play a significant role in agricultural water use, hydropower generation, flood control and disaster prevention, and ecological preservation. However, reservoir construction also poses potential adverse effects, including geological disasters and ecological damage. For example, reservoirs may induce and increase the frequency of earthquakes in the reservoir’s area and surrounding regions [3]. Reservoir construction can lead to the gradual reduction of biological species, hindering biodiversity. Industrial and agricultural activities can release heavy metals into water bodies, resulting in their accumulation in reservoirs. Heavy metals are persistent pollutants characterized by bioaccumulation, environmental persistence, and toxicity. Even more, some certain heavy metals (e.g., Cd, Cr, As, and Pb) exhibit toxic effects even at low concentrations [4, 5].
Numerous studies have investigated conventional ions, isotopes, and heavy metals in various water bodies [6–8]. With rapid industrialization, heavy metal accumulation in these water bodies has escalated, posing significant threats to human health and the ecological environment [9]. Consequently, researchers have emphasized heavy metal pollution in different water bodies, including reservoirs [10]. Various heavy metal pollution assessment methods have been proposed, such as the single-factor pollution index method [11], the Nemerow pollution index method [12], the heavy metal pollution index method (HPI) [13], the heavy metal evaluation index method, and the potential ecological risk index method [14]. Ecological risk assessment of heavy metals can be conducted using the United States Environmental Protection Agency’s (USEPA) health risk assessment model (AHP model) [15]. Principal component analysis (PCA) [16], correlation analysis, positive matrix factorization (PMF) [17], cluster analysis, unmix analysis, and weighted alternating least squares (MCR-WALS) are commonly used to identify heavy metal sources in water bodies.
Extensive research has been conducted on rivers, lakes, subsidence pools, shallow groundwater, and deep groundwater in Northern Anhui Province, China, and this research has focused on investigating their hydrochemical characteristics, heavy metal pollution, and isotope features [18–21]. However, studies on reservoirs remain relatively limited. Therefore, the objectives of this study aim to 1) characterize the concentrations and their variation of heavy metals (Mn, Zn, Co, As, Mo, Cu, Cr, and Ni), 2) evaluate heavy metal pollution using the Nemerow composite pollution index and the HPI, 3) assess health risks to adults and children using the AHP model, and 4) identify the heavy metal sources through correlation and principal component analyses.
Materials and Methods
Research Area
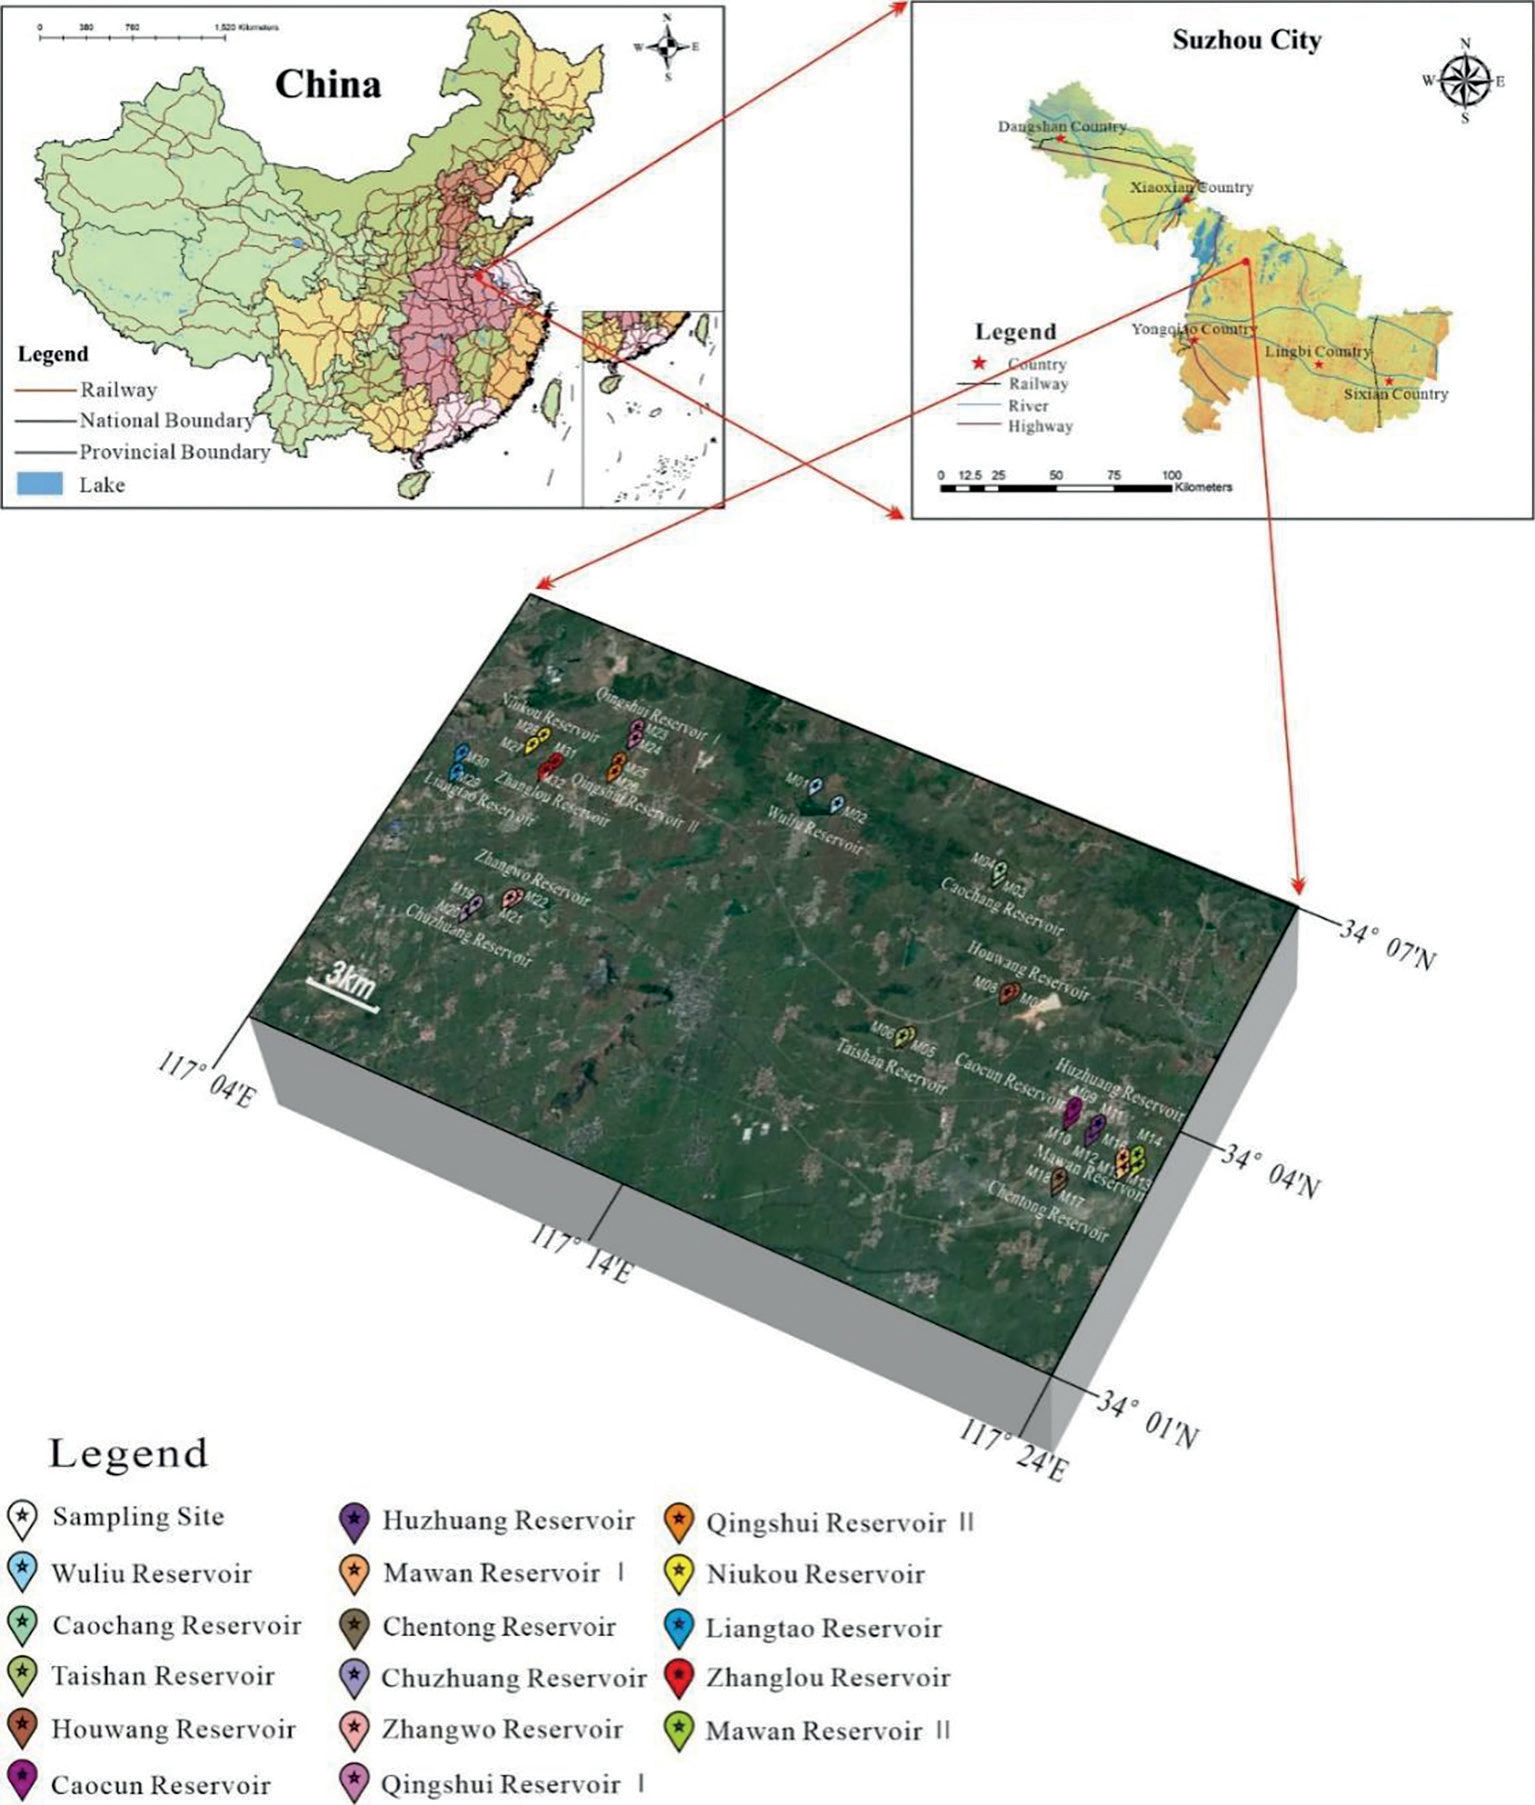
The study area is located in the Jiagou Region, Suzhou City, Northern Anhui Province, China (117°3’34’’E, 33°53’27’’N), covering an area of 178 square kilometers. Suzhou City comprises Yongqiao District, Dangshan County, Xiaoxian County, Lingbi County, and Sixian County, and the study area is situated within Yongqiao District, which can be seen in Fig. 1. The region experiences a warm temperate monsoon climate, with an average annual precipitation of 1200 mm, primarily concentrated between June and August. Annual sunshine hours range from 250 to 2500. The study area lies in the center of the Huaibei Plain, characterized by diverse geomorphological features, including hills, terraces, and plains; the Jiagou district is located in the plain area. Agriculture, small-scale industry, and tourism constitute the primary industries in the region. Commonly, the loose strata develop three aquifers and two aquicludes; the upper confined aquifer is the primary water supply source among these three aquifers. Plenty of reservoirs have been constructed for irrigation, domestic living, shipping, and local aquaculture.
Sample Collection and Testing
A total of 32 water samples were collected from both sides of 16 reservoirs in the Jiagou region. During sampling, GPS positioning was used to determine the coordinates of each sampling point. Additional information was recorded, including in-situ conditions (e.g., temperature, pH, traffic conditions, topography, crops, and industrial facilities). The sampling locations are depicted in Fig. 1. At each sampling point, the sampling bottle was triple-rinsed with the original water. The water sample was then collected in a 500-ml polyethylene bottle, sealed, and then transported to the Key Laboratory of Mine Water Resource Utilization of Anhui Higher Education Institutes, Suzhou City, Anhui Province. In the laboratory, the water sample was filtered through a 0.22-μm microporous water filtration membrane and acidified with 5% concentrated nitric acid, guaranteeing a pH below 2. The acidified sample with 97 g, the concentrated nitric acid with 2 g, and the 500 ppb Rh internal standard with 1 g were added together to a 100-ml volumetric flask. Finally, inductively coupled plasma mass spectrometry (ICP/MS) was employed to measure the concentrations of Co, Cu, Zn, Mo, As, Cr, Mn, and Ni. Finally, only thirty-one samples with testing precision of less than 10% were considered for further analysis, which can offer the original data for studying the concentrations and variation characteristics, pollution assessment, and the source apportionment of the heavy metals.
Analysis Methods
Descriptive Statistical Method
Descriptive statistics provide a statistical summary of relevant data collected during a survey. Complex datasets can be described by using a few representative indices, allowing for an intuitive understanding of data variations. In this study, descriptive statistics were used to analyze the minimum value, maximum value, mean value, coefficient of variation (C.V.), and standard deviation of the data. These indices can also be employed to assess the extent to which human activities influence heavy metal enrichment in different water bodies [22].
The Heavy Metal Pollution Index Method (HPI)
The heavy metal pollution index method (HPI) is assessed based on weighted arithmetic mean. It evaluates the pollution degree of various heavy metals, and the calculation involves the following steps [23].
Wi is the ith heavy metal indicator weight and k is the constant of proportionality; usually, it is 1. Si is the recommended standard for the ith parameter.
Qi is the quality grade index of the ith heavy metal index. Ci is the tested concentration of the ith water sample’s heavy metal element.
The acceptable contamination value is 100, and more than 100 is considered serious pollution.
The Nemerow Composite Pollution Index
The Nemerrow composite pollution index, which highlights the effect of heavy metal pollutants on water quality, is calculated by using the average and maximum values of the single-factor pollution index, and the calculation formula is as follows:
In the formula, PI is synthesized as a comprehensive pollution index, Pa is the average of individual pollution indexes of the single pollution index, and Pimax is the largest value of the single pollution index. The evaluation indicators are defined as follows: PI < 1.0 indicates no pollution; 1.0 ≤ PI < 2.0 suggests slight pollution; 2.0 ≤ PI < 3.0 implies moderate pollution; PI ≥ 3.0 represents heavy pollution [24].
The Health Risk Assessment (AHP Model)
Numerous studies have demonstrated that the primary routes of heavy metal exposure in humans are through drinking water ingestion and skin contact. Excessive exposure to heavy metals can increase the risk of cancer [25]. In this study, the health risk assessment model recommended by the USEPA is employed to evaluate health risks for adults (male and female) and children. Heavy metals in the reservoir can be classified into two categories: chemical non-carcinogenic elements (Mn, Co, Ni, Cu, Zn, and Mo) and chemical carcinogenic elements (Cr and As). The calculation methods for each category vary based on the exposure route:
For drinking water pathway:
Ric is the annual carcinogenic risk caused by drinking water. The calculation formula is as follows:
Di represents the average daily exposure dose per unit weight of drinking water route. The calculation formula is as follows:
Rin is the annual non-carcinogenic risk caused by drinking water. The calculation formula is as follows:
For skin infiltration pathway:
Rip represents the annual risk of carcinogens caused by the skin pathway, which can be determined according to formula (8).
Rif represents the annual risk of non-carcinogenics caused by the skin pathway. It can be determined according to formula (9):
CDI is the daily dose of heavy metal element d per unit of body weight, and its unit is mg/(kg*d), which can be formulated as formula (10).
I is the adsorption amount of heavy metal element per unit area of each bath, and its unit is mg/(cm2*times). It can be determined according to formula (11).
The relevant parameter values of the above formulas are detailed in Table 1 [26], and the non-carcinogenic reference dose and carcinogenic intensity coefficient are shown in Table 2 [27–29]. The maximum acceptable risk level and negligible risk level recommended by relevant research institutions can be obtained in Table 3 [30]. In accordance with Table 3, it can be concluded that the maximum acceptable risk level of some institutions is between 1×10⁻⁶ and 1×10⁻⁴.
Table 1.
The practical significance, reference values, and units of each symbol in the formula.
Table 2.
Contaminant carcinogenic slope factor SF and non-carcinogen reference RfD.
| Component | SF/(kg*d)/mg | RfD/mg/(kg*d) |
|---|---|---|
| As | 15 | - |
| Cr | 41 | - |
| Ni | - | 0.02 |
| Mn | - | 1.4 |
| Co | - | 0.0003 |
| Cu | - | 0.005 |
| Zn | - | 0.3 |
| Mo | - | 0.005 |
Table 3.
The maximum acceptable risk level and negligible risk level are recommended by some relevant research institutions.
Correlation Analysis
Correlation analysis is a statistical technique that can be used to assess the relationship between two or more correlated variables. By eliminating the influence of extraneous factors, this method retains objective and reliable information. It is commonly employed in source apportionment studies of water samples. The strength of the correlation is indicated by the correlation coefficient, which ranges from -1 to +1. A correlation coefficient between 0.6 and 8.0 indicates a positive correlation, while a correlation coefficient greater than 0.8 suggests a strong positive correlation, indicating these two elements may have originated from the same parent material. Conversely, a negative correlation coefficient indicates an inverse relationship between the variables, suggesting that these two elements are derived from different parent materials [30].
Principal Component Analysis
PCA is a multivariate statistical technique that reduces a large number of correlated variables into a smaller set of uncorrelated variables, known as principal components. These components capture most of the variance in the original data. PCA is commonly used with SPSS software to transform multiple indicators into a few comprehensive indicators or to identify major pollution sources from multiple pollution sources. Based on the contribution rate of each principal component, the main factors can be identified, providing insights into the primary sources of the original elements [26].
In this study, the descriptive statistics using SPSS 17.0 are employed in delineating the concentration and variation characteristics; the HPI and the Nemerrow composite pollution index are used for evaluating the pollution status; the health risk assessment (AHP model) are conducted for assessing the health risks for adults (male and female) and children through drinking water ingestion and skin contact; and finally, the correlation analysis and the principal component analysis by using SPSS 17.0 are utilized for the source apportionment of the heavy metals.
Results and Discussion
Descriptive Statistics
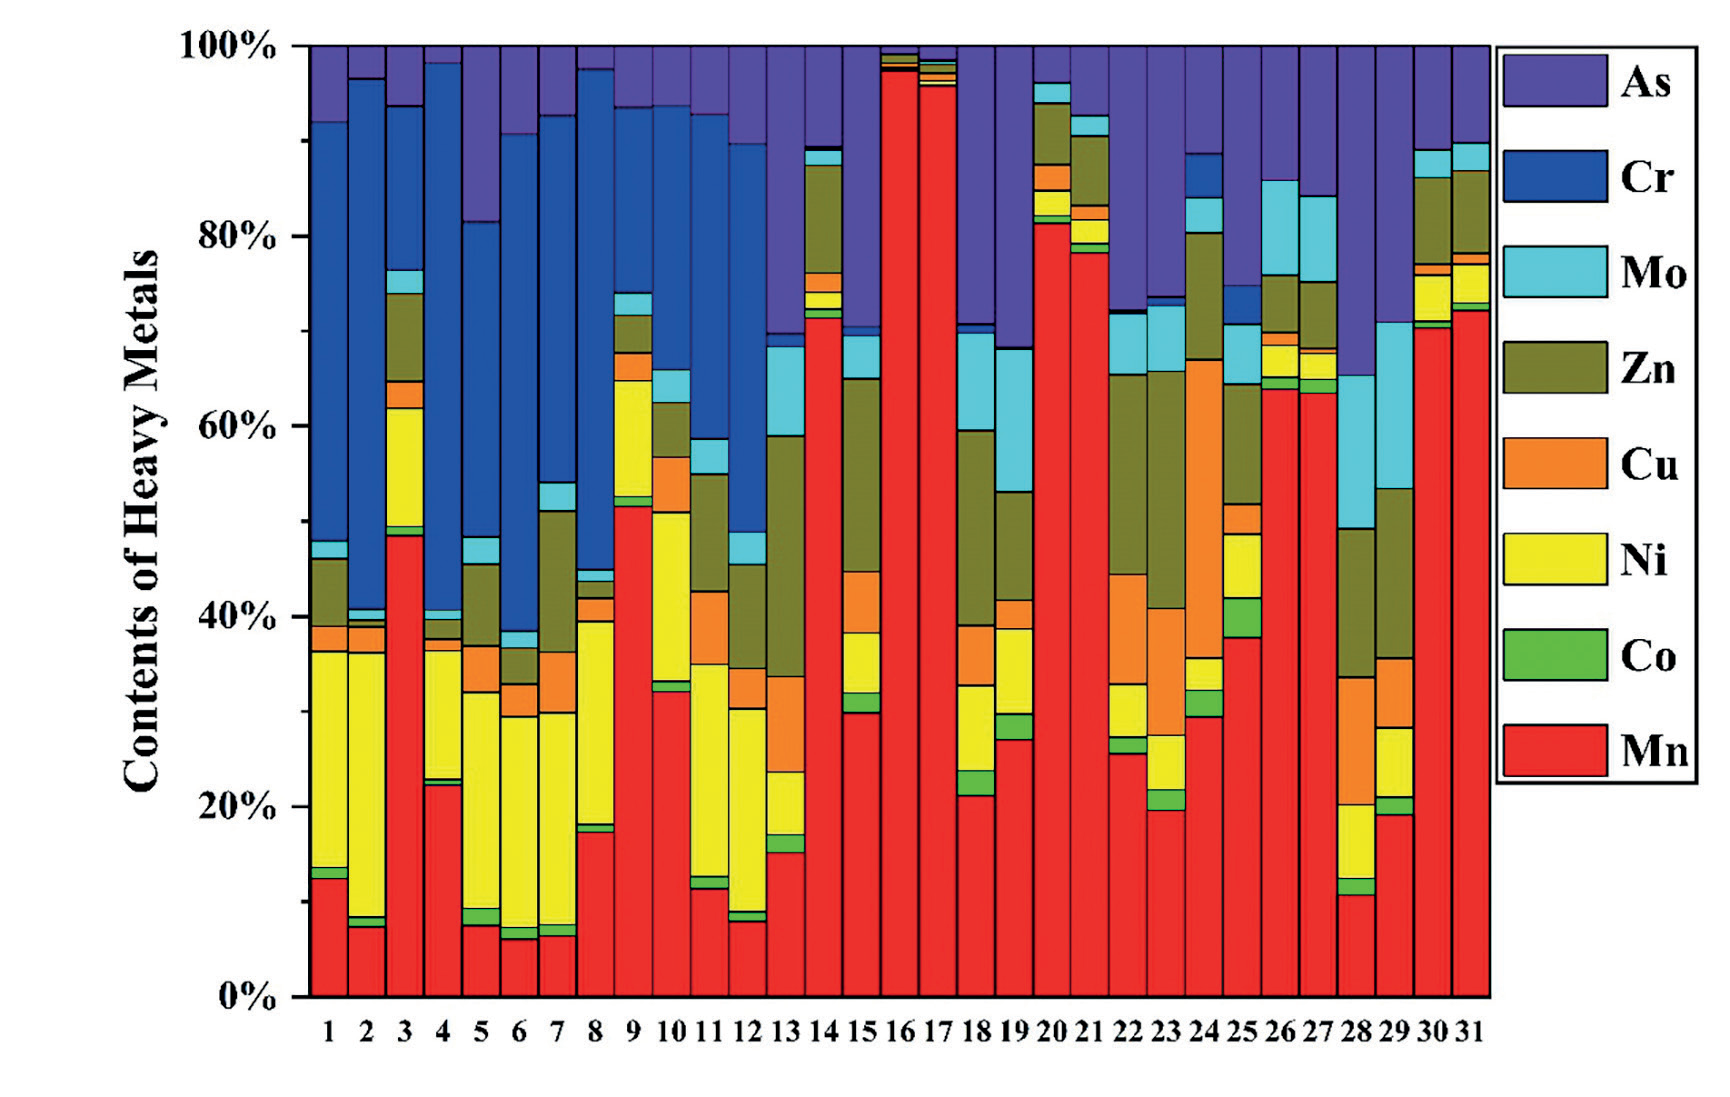
The concentrations in 8 heavy metals (Co, Cu, Zn, Mo, As, Cr, Mn, and Ni) of 31 samples from 16 reservoirs are listed in Table 4. The descending order of average concentrations are: Mn (20.08 μg·L-1) > Cr (7.75 μg·L-1) > Ni (3.57 μg·L-1) > As (2.34 μg·L-1) > Zn (1.82 μg·L-1) > Cu (0.94 μg·L-1) > Mo (0.87 μg·L-1) > Co (0.29 μg·L-1). Among these heavy metals, the element of Mn is within the widest concentration range. The average values of Mn, Mo, Co, and Ni are below the standard limits; the maximum values of Mn and Ni exceed the limits for drinking water. The average values of Cu, Zn, and As do not exceed Class I of the environmental quality standard for surface water [31, 32], but the average Cr concentration reaches Class V. Fig. 2 illustrates the percentage contribution of each heavy metal at different sampling points. As can be seen from Fig. 2, Cr and Ni have significantly higher contributions in sites 1–12 compared with other sites.
The coefficient of variation (C.V.) reflects the dispersion of heavy metal concentrations; higher C.V. values indicate greater dispersion [33, 34]. Based on previous studies [34], variability can be classified as follows: Low variability: C.V.≤ 20%, moderate variability: 20% < C.V. ≤ 50%, and high variability: C.V. > 50%. As and Zn exhibit moderate variability, while Mn, Co, Ni, Cu, Mo, and Cr show high variability. This suggests a significant spatial variation in heavy metal concentrations, which is potentially influenced by pollution sources.
Pollution Assessment
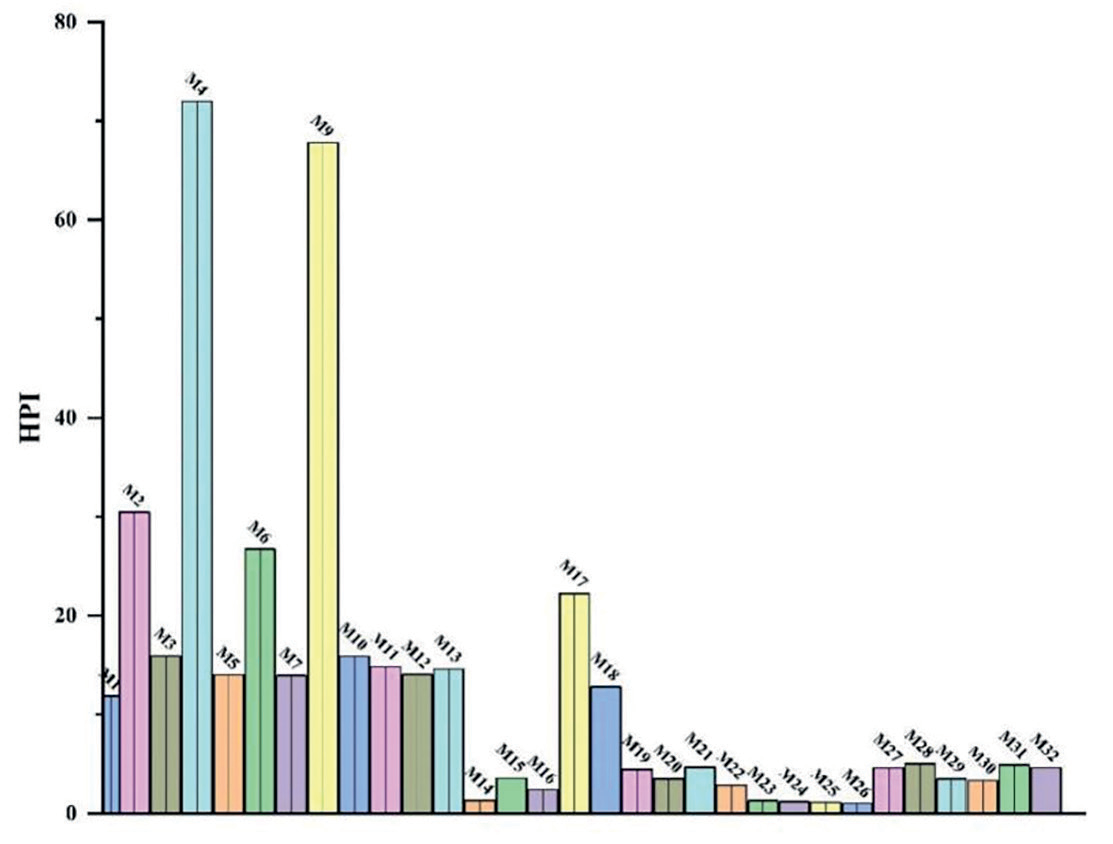
Fig. 3 presents the HPI values for each sampling point. As shown in Fig. 3, all values were below 100, indicating that these samples are within acceptable levels of heavy metal pollution in the 16 reservoirs [35]. All of the samples are below the national standard limit, and these samples can be classified as acceptable levels. However, among these samples, M4 and M19 have a trend of relatively elevated HPI values, which may be related to pesticide use in the study region.
Table 4.
Analysis and statistics of heavy metal concentration in Jiagou Reservoir.
Simultaneously, the results of the Nemerow comprehensive pollution assessment are shown in Fig. 4. The descending order of the Nemerow comprehensive pollution index is: M17 > M4 > M18 > M9 > M2 > M6 > M21 > M3 > M11 > M10 > M12 > M13 > M7 > M5 > M15 > M28 > M32 > M31 > M27 > M22 > M19 > M29 > M20 > M30 > M16 > M14 > M23 > M24 > M25 > M26. M4 and M17 are classified as slightly polluted categories, while the remaining points belong to the non-polluted categories. Compared with the results of other related research on groundwater [24], the reservoirs’ samples and the groundwater samples are both within a good water quality environment. Meanwhile, these results are consistent with the results of the HPI, suggesting the results of these two pollution evaluation methods can be mutually corroborated and credible.
Health Risk Assessment
According to different water acquisition routes, the USEPA health risk assessment model commonly considers selecting different parameters. In this study, this model is employed to calculate the range and the average of annual health risks posed by heavy metals in water bodies through skin contact and drinking water, which are presented in Tables 5 and 6, respectively. Table 5 and Fig. 5(a) summarize the calculated health risks for males, females, and children via skin contact. Except for Mn, children exhibit slightly lower carcinogenic and noncarcinogenic risks compared with females. The average annual non-carcinogenic health risks for adults associated with the six non-carcinogenic heavy metals (Mo, Ni, Mn, Co, Cu, and Zn) are all below the negligible risk level of 1×10⁻⁷ recommended by the Royal Society. Therefore, the health risks posed by these six heavy metals for adults can be considered negligible.
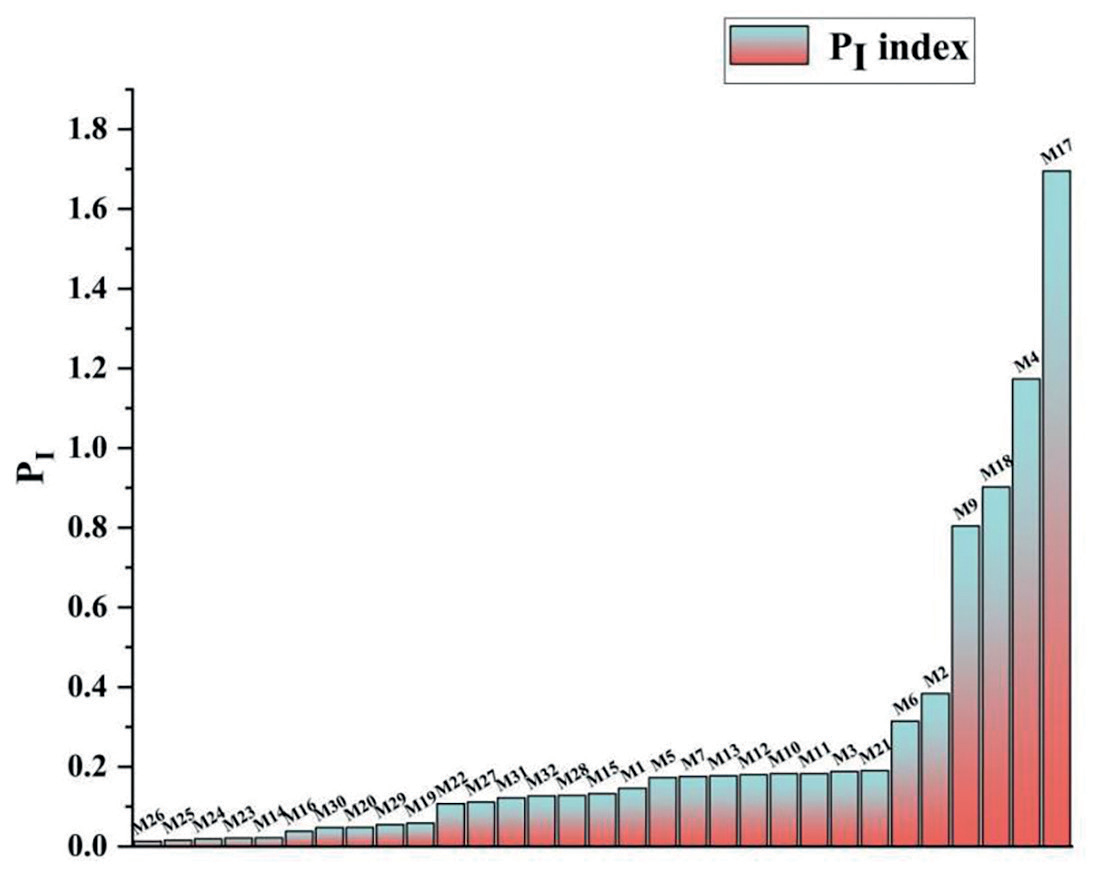
Table 5.
The average annual health risk value of skin contact pathway.
Fig. 5.
The box plot of carcinogenic risk caused by the skin contact route (a) and the drinking water route (b).
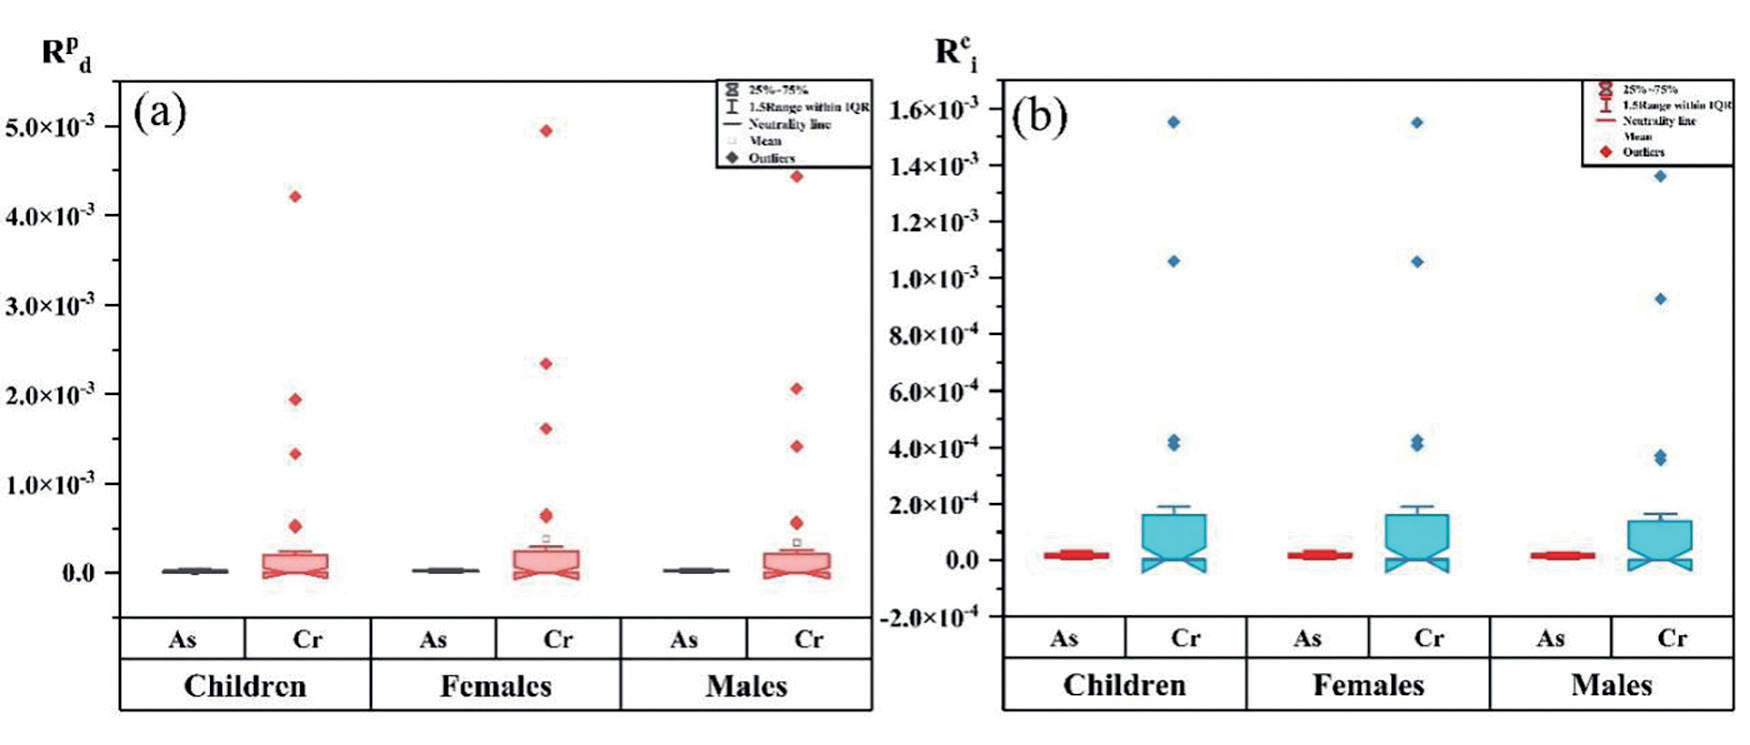
Table 6.
The average annual health risk value of drinking water pathway.
Regarding carcinogenic risks, the average annual health risk and range for As are lower than the acceptable risk level of 1×10⁻⁴ recommended by the USEPA. However, the health risks associated with heavy metal Cr are higher than those for As. Notably, the risk value for Cr exceeds 1×10⁻⁴ at some sampling sites, indicating that the carcinogenic risk posed by Cr requires further attention [36].
Table 6 and Fig. 5(b) present the calculated health risks for males, females, and children via drinking water. Children exhibit slightly higher carcinogenic and noncarcinogenic risks than adults through this route [37]. The average annual health risks associated with Cr exceed the maximum acceptable risk levels set by all relevant agencies, indicating its potential carcinogenic risk. The health risk value for As is lower than the maximum acceptable risk level recommended by the USEPA but higher than the limits established by the Swedish Environmental Protection Agency, the Dutch Ministry of Construction and Environment, and the Royal Society. By contrast, the health risk values for Ni, Mn, Co, Cu, Zn, and Mo are significantly below the maximum acceptable risk levels set by relevant agencies, which means that their health risks are negligible.
Overall, the descending order of health risks to humans posed by the eight heavy metals was Cr > As > Co > Cu > Ni > Mo > Mn > Zn. Owing to Cr being higher than the maximum acceptable risk levels recommended by certain agencies, the reservoirs in the study area are not suitable as drinking water resources. The health risks associated with heavy metal exposure via skin contact were higher than those via drinking water [38]. Notably, the health risk values for Cr and As exceeded the maximum acceptable risk level at certain sampling points; these points may be related to human activities, such as the application of chemical fertilizers and pesticides in surrounding agricultural areas.
Correlation Analysis
The correlation analysis of heavy metal concentrations can be implied to reveal the relationship between two elements. When they have a strong positive correlation coefficient, this indicates that these two elements have homology; on the contrary, a strong negative correlation coefficient between two elements shows a non-homology. As shown in Table 7, there are strong positive correlations between Ni and Cr (0.943), Co and Ni (0.887), and Cr and Co (0.858). Mo and As show a moderately positive correlation coefficient of 0.721, suggesting that these elements may have originated from similar and/or the same sources. Conversely, negative correlation coefficients are observed between Mn and Ni (-0.079), Mn and Mo (-0.169), Mn and Cr (-0.03), and Mn and As (-0.066). These negative correlation coefficients indicate that these elements may originate from different sources.
Principal Component Analysis
In this study, the principal component analysis (PCA) is applied to reveal the source of these heavy metals. As can be seen from Table 8, with rotation and an eigenvalue greater than 1, three principal components can be summarized. Principal component 1 (PC1) accounts for 43.05% of the variance, and the high loadings on Co, Ni, Cu, and Cr indicate a strong positive correlation among these heavy metals. PC2 accounting for 23.15% of the variance exhibits a high loading on Mo and As, with a moderate correlation with Zn, which suggests a relatively strong positive correlation. PC3 accounting for 13.39% shows a strong correlation with Mn. Combining related research results from the surrounding research regions and the recording information during the sampling [39, 40], PC1 may represent the influence of human activities such as pesticide and fertilizer use, PC2 may be associated with coal combustion, and PC3 may be related to local pesticide applications.
Table 7.
Correlation analysis of heavy metals.
Table 8.
Principal component analysis of heavy metals.
Conclusions
In this study, 31 surface water samples were collected from 16 reservoirs for studying the pollution evaluation, health risk assessment, and source apportionment of the reservoirs’ samples. The key findings are summarized as follows:
(1) The descending order of average concentrations are: Mn > Cr > Ni > As > Zn > Cu > Mo> Co. Mn, Co, Ni, Cu, Mo, and Cr show a high variability; this suggests that there is a significant spatial variation in heavy metal concentrations, potentially influenced by pollution sources.
(2) The heavy metal pollution index (HPI) values for all samples were below 100, indicating acceptable heavy metal pollution levels. The Nemerow comprehensive pollution assessment indicates that M4 and M17 are classified as slightly polluted categories, while the remaining points belong to the non-polluted categories.
(3) Health risk assessment reveals that Cr is higher than the maximum acceptable risk levels recommended by certain agencies; the reservoirs’ samples are not suitable as drinking water resources.
(4) Correlation analysis and the principal component analysis both identify three principal components: PC1 may represent the influence of human activities such as pesticide and fertilizer use, PC2 may be associated with coal combustion, and PC3 may be related to local pesticide applications.
(5) Regular water quality monitoring, attention to primary pollution sources, and identification of the source apportionment need to be engaged to guarantee the water quality of reservoirs.

