

Introduction
Drought stress poses a significant challenge to global food production and agricultural sustainability [1, 2]. As a consequence of climate change and erratic rainfall patterns, the frequency and severity of drought events have increased in many regions worldwide [3]. Bread wheat (Triticum aestivum L.) is a staple crop that provides a substantial proportion of the world’s dietary calories [4, 5]. However, its productivity is highly vulnerable to water scarcity, particularly during critical growth stages such as flowering [6] and grain filling [7- 9]. The adverse effects of drought stress on bread wheat include reduced photosynthetic activity [10], impaired water use efficiency, increased oxidative stress, and decreased grain yield [10, 11].
To ensure food security and mitigate the impact of climate change on crop productivity, it is imperative to develop bread wheat genotypes that exhibit enhanced adaptation to drought stress [12]. The characterization of genotypes for their drought stress response plays a crucial role in identifying the underlying physiological and agronomic mechanisms that contribute to drought tolerance [13, 14]. This knowledge can facilitate the development of improved cultivars through breeding programs and the implementation of appropriate management practices.
Drought tolerance is a complex trait influenced by various genetic [15], physiological [16], and environmental factors [16]. Bread wheat genotypes have shown considerable genetic diversity for drought stress adaptation, indicating the potential for targeted breeding efforts to improve drought tolerance [17]. Understanding the genetic basis of drought tolerance is essential for the identification and utilization of valuable genetic resources in breeding programs [18]. Additionally, elucidating the physiological and agronomic traits associated with drought stress adaptation can provide valuable insights into the mechanisms that confer tolerance and guide selection strategies [19, 20].
Drought has a profound impact on various agronomic traits in bread wheat, including plant height [17], number of tillers , thousand grain weight, and spike length [21]. Drought-induced water scarcity results in shorter plant stature, reduced tillering, lighter grains, and shorter spikes [22, 23]. These effects collectively contribute to decreased grain yield and quality, emphasizing the vulnerability of bread wheat to water stress. Strategies for drought mitigation and adaptation are crucial to ensure the productivity and resilience of wheat crops in water-limited environments [24].
Breeding for improved drought tolerance focuses on breeding cultivars with higher yields under water stress conditions and assumes that such cultivars provide a yield advantage under suboptimal conditions [25]. Root characteristics, such as root length, density, and depth, are known to influence the acquisition of water and nutrients from the soil, thus affecting plant performance under drought stress [26, 27]. Additionally, biomass accumulation, grain yield, and yield components, such as grain number and weight, are critical agronomic traits indicative of a genotype’s ability to maintain productivity under limited water availability [28].
Characterization of bread wheat lines and predicting drought tolerance are essential parts of the breeding process. Thus, many drought indices have been proposed for screening drought tolerant genotypes based on yield in stressed and non-stressed environments, aimed at assisting the identification of stable, high-yielding, drought tolerant genotypes [29]. The best indices are those that have a high correlation with grain yield in both conditions and would be able to identify potential high-yielding and drought tolerant genotypes [30, 31].
The objectives of this study were twofold. Firstly, to evaluate a diverse collection of bread wheat genotypes for their performance under controlled drought stress conditions, and secondly, to identify key agronomic traits associated with drought stress adaptation. By accomplishing these objectives, this research aims to contribute to the selection of superior genotypes with enhanced drought tolerance and the development of bread wheat cultivars resilient to drought stress, ultimately ensuring food security in the face of climate change
Materials and Methods
Plant Material and Experimental Design
A collection of 20 bread wheat genotypes (Table 1), representing diverse genetic backgrounds, was selected for the study. The experiment was conducted in the field, and rain shelters were used for rain protection during the Rabi season in 2022-23. The different genotypes were planted in pots containing 4 litters of compost media weighing 2.84 kg. The genotypes were arranged in a randomized complete block design (RCBD) under factorial arrangement with three replications. Each replication consisted of a well-watered control and a drought stress treatment (50% field capacity).
Salient Features of the Selected Genotypes
Genotypes MARKAZ, BORLAUG-16, and AAS- 2002 are high-yielding varieties bred for improved productivity. LASANI-08 and DILKASH-21 possess early maturity traits, helping avoid terminal heat stress. Genotypes NARC-11, UJALLA-16, and FSD-2008 have shown drought tolerance in previous studies. NARC- 11 exhibits efficient water use, while FSD-2008 has vigorous root systems. BLUE SILVER is a popular commercial cultivar adapted to rain-fed conditions. Genotypes ZINCOL-16 and SUBHANI-21 produce good grain quality parameters like high protein content or gluten strength. ANAJ-17 and JOHAR-16 carry heat tolerance traits, helping cope with rising temperatures. The germplasm line 16104 and the advanced line PAK-13 represent diverse genetic backgrounds, incorporated into breeding programs for widening the crop gene pool.
Table 1.
Genotypes evaluated in the experiment.
Drought Stress Imposition and Data Collection
Drought stress was imposed by withholding irrigation water at the reproductive stage. The water deficit (50% field capacity) was maintained until a predetermined soil moisture threshold was reached. The control plants received optimal watering throughout the experiment with a 7-day interval. No inorganic fertilizer was applied at any stage of crop growth.
Data were collected from three guarded plants based on various agronomic traits.
Plant Height (PH)
Plant height was measured in centimeters (cm) from the soil surface to the tip of the spike, excluding the awns. In each replication, three representative plants per genotype were used for measurements on the main tiller at physiological maturity.
Number of Tillers (NT)
The number of fertile tillers producing spikes was counted manually for each plant just before harvest. Counts were made on 3 tagged plants per genotype in each replication.
Spike Length (SL)
On three randomly selected spikes, the length of the spikes was measured in centimeters, measuring from the base to the tip. The awns were left off. After plants achieved maturity, measurements were made on spikes that were obtained from distinct plants for each genotype in each replication.
Anthesis (ANT)
Days to anthesis were recorded by counting the number of days from seedling emergence until 50% of the spikelets/florets on 50% of the spikes had extruded anthers. Observations were made visually on the main tillers of 3 plants per genotype in each replication.
Flag Leaf Area (FLA)
Leaf area was measured in cm2 using an electronic Leaf Area Meter (Model LI-3100C) on the flag leaves of 3 plants per genotype per replication at 7 days after anthesis.
Spikelet/Spike (SLPS)
By manually counting the number of spikelets on three randomly chosen spikes that were harvested from different plants of each genotype in each replication following physiological maturity, the number of spikelets per spike was ascertained.
Grains per Spike (GPS)
The grain number per spike was determined by manually counting the grains on 3 randomly selected spikes harvested from different plants of each genotype per replication.
Thousand Grain Weight (TGW)
The thousand grain weight was estimated by counting 100 grains randomly sampled from the grain lot harvested from each genotype per replication using an electric seed counter. Next, an electronic balance was used to weigh the 100 grains, yielding a reading of 0.001 grams. The 1000 grain weight was calculated by multiplying the weight by 10.
Days to 50% Flowering (DFF)
Days to 50% flowering were determined by counting the days from seedling emergence until 50% of the spikelets per floret had extruded anthers on 50% of the spikes per plant. Dates were recorded when the specified threshold was reached on the main tillers of 3 representative plants per genotype per replication.
Days to Maturity (DTM)
The number of days from seedling emergence until 50% of the spikes entirely became yellow or brown, signifying physiological maturity, was recorded as the “days to maturity.” Dates were noted when the predefined threshold was reached, based on visual observation of the major tillers on three sample plants per genotype in each replication.
Table 2.
Mean square values for various morpho-physiological and phenological traits of the bread wheat (Triticum aestivum L.).
Data Analysis
The collected data were subjected to analysis of variance (Steel et al., 1997) to determine significant differences among the genotypes under drought stress. Post-hoc multiple comparisons, i.e., the least significant difference (LSD) of the mean (Dewey and Lu, 1959), and correlation (Genotypic and Phenotypic) analyses were performed to identify genotypes with superior drought tolerance and traits associated with drought stress adaptation. The statistical analyses were conducted using different software tools. ANOVA and LSD tests were performed using “Statistix version 12.0” software; correlation and cluster analyses were conducted using R software (Version 3.4.2); and PCA analysis was carried out using Minitab software (version 20.4).
Results
Estimation of ANOVA and Mean Comparison Test
The results indicated significant variations among the bread wheat genotypes in response to drought stress. The measured traits include anthesis (ANT), days to 50% flowering (DFF), days to maturity (DTM), grains per spike (GPS), flag leaf area (FLA), number of tillers (NT), plant height (PH), spike length (SL), spikelet per spike (SLPS), thousand grain weight (TGW) and grain yield per plant (GYP). Significant differences were observed due to irrigation regimes and cultivars for all the traits under study. Irrigations × cultivars interaction was significant for all the measured traits except days to maturity and spike length. Statistical analyses identified specific genotypes with superior drought tolerance and key traits associated with their adaptation to drought stress.
The mean comparison test presents the mean values of different agronomic traits for various treatments in the study (Table 3). The treatments are categorized by Genotype (1 to 20) and Irrigation Level (normal, drought stress with 50% field capacity). The mean values provide insights into the performance of different genotypes and the impact of irrigation levels on each trait. In terms of genotype performance, Genotype MARKAZ had the highest values for anthesis (93.67 days), while Dilkash-21 had the minimum (88 days) anthesis days and the maximum spikelet per spike (19.83). Lasani-08 had maximum grains per spike (53.33g) and thousand grain weight (35.50g), whereas NARC-11 had maximum mean values for DFF and leaf area. Fakhr-e-Bhakkar had the longest spike (12cm) under stress conditions. Genotypes Blue Silver followed by Subhani-21, had maximum mean values for spikelet per spike (9.83 and 9.33) and yield per plant (15.4 and 12.5 grams), respectively. Regarding the effect of irrigation levels, irrigation level 1 (normal) generally shows higher mean values for most traits compared to irrigation level 2 (drought stress). This suggests that the higher irrigation level contributes to better performance in terms of anthesis, days to 50% flowering, days to maturity, grains per spike, leaf area,, number of tillers, plant height, spike length, spikelet per spike, thousand grain weight, and yield per plant.
Table 3.
Mean comparison (LSD test) of yield and yield related attributes of wheat genotypes under irrigated and drought stress conditions.
These findings are crucial for understanding the performance and response of different genotypes and irrigation levels to the studied agronomic traits. The results highlight the potential of specific genotypes and the importance of irrigation management in achieving optimal performance and yield in wheat cultivation. This information can contribute to decision-making in crop breeding, the selection of appropriate genotypes, and irrigation strategies for maximizing wheat productivity.
Correlation Analysis
The correlation (Phenotypic and Genotypic) matrix for wheat genotypes is given in Table 4. The correlation matrix presented provides insights into the relationships between grain yield per plant (GYP) and various agro-morphological traits under drought stress. Table 4 displays the correlation coefficients between different traits, ranging from -1 to 1.
In the phenotypic correlation, there is a strong positive correlation between days to 50% flowering and days to anthesis (r = 0.735*) and anthesis with thousand grain weight (r = 0.291*). There is a positive correlation between anthesis and spikelet per spike (0.3248*), while a significant negative correlation was found between plant height and thousand grain weight (-0.3462). There is a positive correlation between spike length and DTM (r = 0.2802*), number of tillers and yield (r = 0.7906**), DTM and days to 50% flowering (r = 0.3029*), and grain per spike with thousand grain weight (r = 0.2984*) while strongly correlated with yield per plant (r = 0.6772**). Although not statistically significant, this suggests that higher grain numbers per spike may have a slight negative impact on yield under drought stress. There is a weak negative yet non-significant correlation between yield with plant height (r = -0.1117), days to anthesis (r = -0.2306), leaf area (r = -0.0712), and spikelet per spike, suggesting that there is a slight tendency for higher values of plant height, days to anthesis, leaf area, and spikelet per spike to be associated with a slightly lower yield, although the correlation is not statistically significant.
The genotypic correlation (Table 4, below diagonals) showed a matrix between different traits, including yield. This indicates that leaf area may not strongly influence yield under drought stress conditions. Longer spike length may not be strongly associated with yield under drought stress. There is a moderately positive correlation between TGW and yield (r = 0.2294). This suggests that a higher grain weight per thousand grains may lead to a higher yield under drought stress conditions. Among the examined agro-morphological traits, a highly significant and positive genotypic correlation with yield under drought stress is observed for grains per spike (0.8909**) and number of tillers (0.6161**). Additionally, days to 50% flowering (DFF) also exhibit positive and significant correlations with and anthesis (0.8302**) while there are positive but non-significant correlations between spike length (0.1738), days of maturity (0.0253), and thousand grain weight (0.2294) with yield per plant, these correlations are not statistically significant. The number of tillers shows a significant negative correlation with leaf area (-0.4474). It is important to note that some correlations are not statistically significant, suggesting that the observed relationships could be due to chance. Further investigation, including larger sample sizes and additional analyses, would be beneficial to confirm and strengthen the relationships between these parameters and yield under drought stress.
Principal Component Analysis (PCA)
The principal component analysis (PCA) was conducted on 20 wheat genotypes sown under drought with 50% field capacity (Table 5) and normal conditions (Table 6). Both tables provide the loadings of each variable on the first four principal components (PC1, PC2, PC3, and PC4), as well as the eigenvalues, proportions of variance explained, and cumulative proportions. The loadings represent the correlations between the original variables and the principal components (PCs). Higher absolute values of loadings indicate stronger associations with the respective PC.
The PCs are linear combinations of the original variables that capture the maximum amount of variation in the dataset. Each PC represents a different pattern of variation. Under drought conditions, PC1 had high loadings for plant height, spikelet per spike, number of tillers, grains per spike, thousand grain weight, days to 50% flowering, and a strong negative loading for yield per plant. This component captures variation related to plant height, spike characteristics, number of tillers, grain yield, and other traits. PC2 had high loadings for anthesis, leaf area, thousand grain weight, days to 50% flowering, and a moderately positive loading for yield per plant. This component captures variation related to anthesis, leaf area, thousand grain weight, flowering time, and yield. PC3 had high loadings for plant height, spike length, number of tillers per plant, days to maturity, and a moderately negative loading for leaf area. This component captures variation related to plant height, spike length, number of tillers, days to maturity, and leaf area, while PC4 had high loadings for plant height, leaf area, spikelet per spike, and a moderately negative loading for days to maturity. Eigenvalues represent the amount of variance explained by each PC. Higher eigenvalues indicate greater importance in explaining the overall variation in the dataset. The proportion of variance explains the percentage of total variance accounted for by each principal component. It indicates how much information each component retains. In this case, PC1 explains the highest proportion of variance (23.5%), followed by PC2 (20.1%), PC3 (15.1%), and PC4 (12.5%). The cumulative proportions indicate that the first four PCs together explain approximately 71.2% of the total variance in the dataset. PCA helps in reducing the dimensionality of the dataset and identifying patterns of variation among the wheat genotypes under drought conditions.
Table 4.
Phenotypic (above diagonals) and genotypic (below diagonals) correlation among the yield and related traits under drought stress.
Table 5.
Principal component analysis for various traits of bread wheat genotypes under drought stress.
Similar to the previous analysis under drought stress, the PCA aimed to identify major patterns of variation in traits among the 20 wheat genotypes grown under normal (Table 6), fully irrigated conditions. The PC1 accounted for 25.2% of the total variance and had high positive loadings for plant height, grains per spike, and yield per plant. Like before, this component represents variation related to plant size and yield components. The second principal component (PC2) explained 21.2% of the variance and had high loadings for traits related to crop phenology and development like anthesis, leaf area, and days to flowering. PC2 captures differences in developmental traits among the genotypes. The third and fourth principal components (PC3 and PC4) accounted for smaller proportions of the variance (17.3% and 11.3% respectively) but highlighted relationships between traits like spike length, number of tillers, and leaf area. In total, the first four PCs explained 75.0% of the variance in the data. The PCA successfully identified major sources of variation in the agro-morphological traits of bread wheat grown under optimal irrigation. The patterns of trait relationships and variation captured by the PCs provide an overview of the differences among the 20 genotypes when grown under normal conditions.
Table 6.
Principal component analysis for various traits of bread wheat genotypes under normal conditions.
Biplot
A PC biplot visually represents variables as vectors or lines, showing their contribution to the overall variance. This allows for more informed decision-making based on the characteristics of each variable. A positive correlation between two variables is indicated by an angle smaller than 90 degrees between their vectors, while a 90-degree angle suggests no correlation. In this analysis, a biplot was used to explore the relationships between multiple attributes in the experimental data presented below. The PC biplot of wheat genotypes for drought stress (50% field capacity) is shown in Fig. 1. The yield per plant exhibited the highest variability, as indicated by the longest vector length compared to other parameters. Among the genotypes, Genotype 20 (BLUE SILVER) has the maximum variability, with its vector length being longer compared to other genotypes. For the parameter of thousand grain weight, Genotypes 6 (AAS 2002), 3 (Borlaug-16), and 14 (NARC Super) demonstrated the maximum variability, with their vectors being longer compared to other genotypes. Regarding the leaf area, anthesis, and days to 50% flowering parameters under drought stress, Genotype 10 (NARC 11) displayed the highest values among the genotypes. These observations were made through the analysis of the vectors in the PC biplot, which allows for the visualization of relationships and variability among different parameters and genotypes.
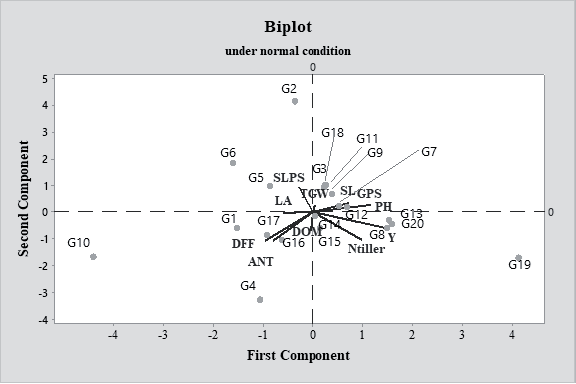
The biplot analysis in Fig. 2 visually represented the relationships between the agro-morphological traits and wheat genotypes grown under optimal irrigation. Yield per plant showed the highest variability as it had the longest vector length compared to the other traits. Among the genotypes, Genotype 19 (BLUE SILVERR) exhibited the maximum value for yield per plant, number of tillers, and plant height. In contrast, Genotype 12 (Fakhr-e-Bakhar) displayed the highest spike length but had only moderate plant height (110 cm). For thousand grain weight, Genotypes 7 (LASANI 08), 2 (DILKASH-21), and 5 (ANAJ-17) showed the greatest variability, with longer vector lengths than other genotypes. Regarding developmental traits under normal conditions, Genotype 10 (NARC 11), followed by Genotypes 4 (UJALLA-16) and 1 (MARKAZ), had the highest values for anthesis and days to 50% flowering. The biplot visualization enabled the observation of differences among the 20 wheat genotypes for key agro-morphological traits when grown with optimal irrigation
Cluster Analysis
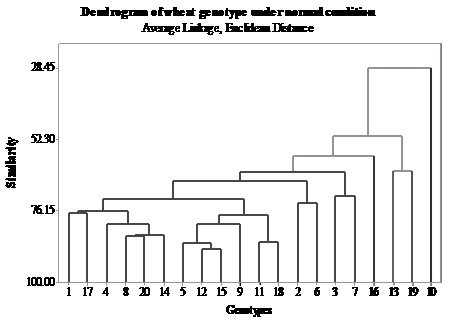
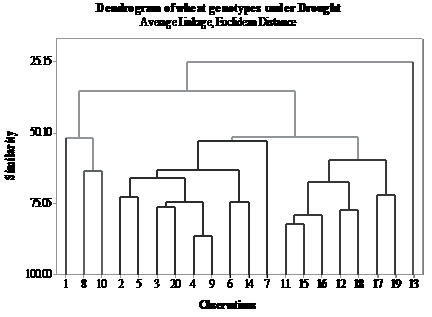
The hierarchical cluster analysis is graphically represented by a dendrogram. It depicts the combination of smaller clusters into larger ones until the final clusters are created. The horizontal axis of a dendrogram shows the individual observations or clusters, and the vertical axis the similarity or distance between clusters. The Euclidean distance and average linkage methods were utilized for the cluster analysis. The similarity or separation at which two clusters were fused is shown by the height of each fusion (joining) in the dendrogram. The groups were more different before they merged if the vertical line was longer.
Fig. 1.
Principal component biplot of 20 wheat genotypes under drought stress (50% field capacity). PH (Plant Height), ANT (Anthesis), FLA (Flag Leaf Area), SL (Spike Length), SLPS (Spikelet per Spike), NOTIL (Number of Tillers), DOM (Days to Maturity), GPS (Grain per Spike), TGW (Thousand Grain Weight), DFF (Days to Flowering), Y (Yield per Plant).
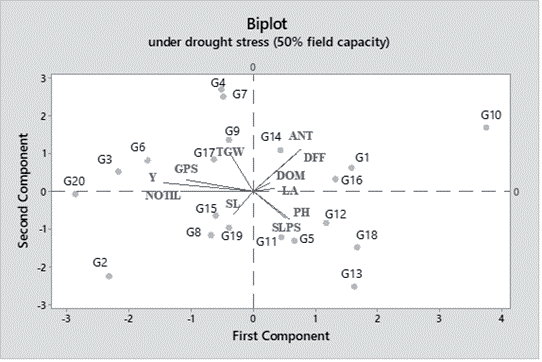
Fig. 2.
Principal component biplot of 20 wheat genotypes under normal (control) condition. PH (Plant Height), ANT (Anthesis), LA (Leaf Area), SL (Spike Length), SLPS (Spikelet per Spike), Ntiller (Number of Tillers), DOM (Days to Maturity), GPS (Grain per Spike), TGW (Thousand Grain Weight), DFF (Days to Flowering), Y (Yield per Plant).
Under normal conditions (Fig. 3), the cluster analysis revealed that most genotypes were similar, with the exception of genotypes 10 (NARC 11), 13 (M.H 12), 16 (S.A 12), and 19 (BLUE SILVER), which clustered separately. Under drought stress conditions (Fig. 4), genotypes 8 (FSD 2008) and 10 (NARC 11) were found to be similar and clustered together. Genotypes 2 (DILKASH-21), 5 (ANAJ 17), 3 (BORLAUG-16), 20 (SUBHANI 21), 4 (UJALLA 16), 9 (16104), 6 (AAS 2002), and 7 (LASANI 08) also clustered within the same group, indicating similarity. Genotypes 13 (M.H 12) and 1 (MARKAZ) exhibited dissimilar performance compared to other genotypes, as each formed distinct, individual clusters. The cluster analysis grouped most wheat genotypes together under normal conditions, while greater variability in response was observed under drought stress, with certain genotypes responding differently than the majority. The findings provide insights into similarities and differences in traits among the wheat genotypes under both normal and drought conditions.
Discussion
As drought is one of the major threats to sustainable wheat production [38], the characterization of bread wheat genotypes for drought stress adaptation is crucial for developing climate-resilient varieties. The identified genotypes with enhanced drought tolerance and associated traits can serve as valuable genetic resources for breeding programs. Agronomic traits, such as biomass accumulation, root characteristics, and grain yield, also play important roles in drought stress adaptation [32]. Combining these desirable traits through breeding approaches can contribute to the development of drought-tolerant bread wheat varieties, ensuring sustainable crop production in drought-prone regions [33]. This information is crucial for the selection of superior and drought-resilient bread wheat cultivars, which is essential for ensuring food security.
The analysis of variance (ANOVA) results revealed significant variation among the bread wheat genotypes in response to drought stress. This indicates that different genotypes exhibited varying levels of tolerance and response to drought conditions. The measured traits and cultivars were influenced by both irrigation regimes. These results emphasize the importance of considering both genotype selection and irrigation management strategies in order to optimize wheat productivity under drought stress.
The mean values provide insights into the performance of different genotypes and the impact of irrigation levels on each trait. Regarding the effect of irrigation levels, Irrigation Level 1 (normal) generally shows higher mean values for most traits compared to Irrigation Level 2 (drought stress). This implies that adequate water supply contributes to better performance in terms of various agronomic traits, including anthesis, days to 50% flowering, days to maturity, grains per spike, leaf area, number of tillers, plant height, spike length, spikelet per spike, thousand grain weight, and yield per plant. These findings highlight the importance of effective irrigation management in maximizing wheat productivity, particularly in drought stress conditions.
Previous studies have also emphasized the importance of characterizing wheat genotypes for drought stress adaptation and identifying key traits associated with drought tolerance. For instance, a study conducted by [35] evaluated different wheat genotypes under drought stress conditions and found significant variation in their performance. The researchers identified traits such as days to flowering, days to maturity, plant height, and grain yield as important indicators of drought tolerance in wheat. These findings align with the present study’s focus on these traits and their correlation with yield under drought stress. Furthermore, a study investigated the impact of drought stress on wheat genotypes and identified key traits related to drought tolerance [31]. The researchers found that genotypes with higher grain yield under drought stress exhibited traits such as reduced days to flowering, increased plant height, and improved water use efficiency.
The correlation analysis presented in Table 4 provides valuable insights into the relationships between various agro-morphological traits and yield under drought stress conditions in wheat genotypes. The analysis includes both phenotypic and genotypic correlations. During the phenotypic correlation, several significant correlations were observed. There was a strong positive correlation between days to 50% flowering and days to anthesis, indicating that genotypes with earlier flowering also tended to reach anthesis earlier. Anthesis showed a positive correlation with thousand grain weight, suggesting that genotypes with a longer duration from anthesis to maturity may exhibit higher grain weights. There was also a positive correlation between anthesis and spikelets per spike, indicating that genotypes with more spikelets per spike tended to have a later anthesis. A significant negative correlation was found between plant height and thousand grain weight, suggesting that taller plants may have slightly lower grain weights under drought stress.
The genotypic correlation matrix provided further insights. Leaf area did not show a strong influence on yield under drought stress, indicating that variations in leaf area may not be directly related to yield potential in these conditions. Spike length also did not show a strong correlation with yield, suggesting that longer spikes may not necessarily result in higher yields under drought stress. However, the thousand grain weight was positively correlated with yield, suggesting that it is an important factor in determining yield under drought stress [34].
The PC biplot is a powerful tool that can be used to visualize and analyze multivariate data. The biplot presented in the current study provides a useful overview of the relationships between multiple attributes in the experimental data. The biplot shows that yield per plant had the highest variability, as indicated by the longest vector length. This suggests that this trait is the most important variable in differentiating between the wheat genotypes under drought stress. The number of tillers and thousand grain weight also had relatively high variability, while plant height and spikelet per spike had relatively low variability.
The importance of developmental traits like days to anthesis and flowering time highlighted by PCA is consistent with the findings of [36]. The distinct clustering of genotypes NARC 11, M.H 12, S.A 12, and BLUE SILVER under normal conditions indicates their divergence from other genotypes in the studied traits even without drought stress. This early segregation of drought-susceptible varieties was similarly noted by [37] and attributed to inherent genetic differences. Overall, the cluster analysis results demonstrate the ability of water stress to induce greater morphological variability across wheat genotypes compared to optimal conditions, likely due to genotype-specific drought tolerance mechanisms mediated through stress-adaptive traits. Further multi-environmental studies to elucidate the genetic basis of drought response clustering among varieties would assist breeding efforts to improve wheat performance under water limitations.
Conclusion
The study successfully characterized diverse bread wheat genotypes for drought stress adaptation to drought stress imposed during the sensitive reproductive stage and identified key agronomic traits associated with drought tolerance. The multivariate analyses identified genotypes BLUE SILVER, AAS 2002, NARC 11, BORLAUG-16, and NARC SUPER as good performers under drought stress, as evidenced by their maintenance of growth and yield attributes compared to other genotypes under stress. Therefore, selecting these traits could contribute to improved performance under drought stress. Additionally, earlier flowering was related to drought adaptation, suggesting this could be a useful trait for breeders to consider. These findings demonstrated the significance of targeted field-based screening of genetically diverse germplasm under managed drought stress for identifying sources of tolerance. The traits delineated in this study serve as practical selection criteria for assembling complex stress adaptive traits in high-yielding genetic backgrounds attuned to future climate scenarios. Stress-resilient, faster developing varieties with improved productivity will have immense value for sustaining wheat production and stability in drought-prone areas. The current research thus makes a timely contribution towards enhancing food security amidst climate change challenges through strategic genetic improvement of this vital cereal crop.

