

Introduction
Soil serves as a crucial carrier and regulator in soil-water relation studies, with hydraulic properties reflecting the diverse pore structures [1]. Thus, the movement of water in the soil, along with its water-holding and hydraulic conducting properties, is a key consideration. Precise soil pore identification is required. It is difficult to obtain parameters characterizing micropores due to technical limitations [2]. Traditional methods, such as Direct, Oil film, and Slice methods, destroy the original pore structure and lack precision [3-5]. X-ray computed tomography has advanced the detailed imaging of soil pore structures [6-8]. X-ray computed tomography has yielded significant insights into soil pore analysis [9-11]. Consequently, this study aims to elucidate the pore structure of alpine meadow soil, assessing its water-holding capacity and hydraulic conductivity.
A reasonable identification of the soil water-holding capacity and hydraulic conductivity requires us to model and characterize it objectively. There are many formulae to calculate soil water-holding capacity and hydraulic conductivity. The calculation of soil water-holding capacity and hydraulic conductivity primarily relies on three equations: Brooks-Corey [12], Van Genuchten [13], and Campbell [14]. Earlier works studied how these three equations were able to describe/predict the hydric properties of soil. Research has covered parameter meanings [15], determination methods [16-18], formula functions [19], derivation processes [20-21], and applicable scenarios [22-23]. The Brooks-Corey and Van Genuchten equations offer precise soil parameter estimates for surface and hydrological models [24]. The Van Genuchten formula was used to map global high-resolution soil hydraulic characteristics [25]. Combining the Campbell formula with visible light-near infrared spectroscopy enhances soil water retention prediction [26]. These three formulas have been widely used in soil-water relationship studies.
However, before using the formula, it is important to consider its application scenario and soil texture parameters [27]. The soils collected for this study consisted mainly of sandy loam with soil water potential mainly around – 103 Pa. Considering the mechanical composition of alpine meadow soil and soil water potential, the Van Genuchten and Campbell equations outperform the Brooks-Corey equation in calculating soil water-holding capacity and hydraulic conductivity. However, there are more empirical constants in Van Genuchten’s formula [28] and less combination with soil pore, but the pore structure of alpine meadow soil is complex, prone to distortion. The Campbell equation accounts for soil pore size distribution’s importance during theoretical derivation, linking empirical constants to soil pore parameters quantitatively [14, 29]. Despite its advantages, the Campbell equation’s empirical constants are generalized, and some parameters lack physical meaning [15, 30-31]. Past improvements in the equation have focused more on parameter significance than on application scenarios and research subjects [16-17]. In this study, we will focus on analyzing the mechanistic relationship between alpine meadow soil and soil water-holding capacity and hydraulic conductivity, and constructing a formula suitable for the regional characteristics of alpine meadows.
Research methods include: 1) Analyzing pore characteristics by quantity, morphology, and distribution.
2) Developing equations based on the correlation between pore and hydraulic parameters. 3) Defining the relationship between soil pores and water dynamics.
4) Assessing the spatial and temporal dynamics of water properties based on these relationships.
Materials and Methods
Calculation Process
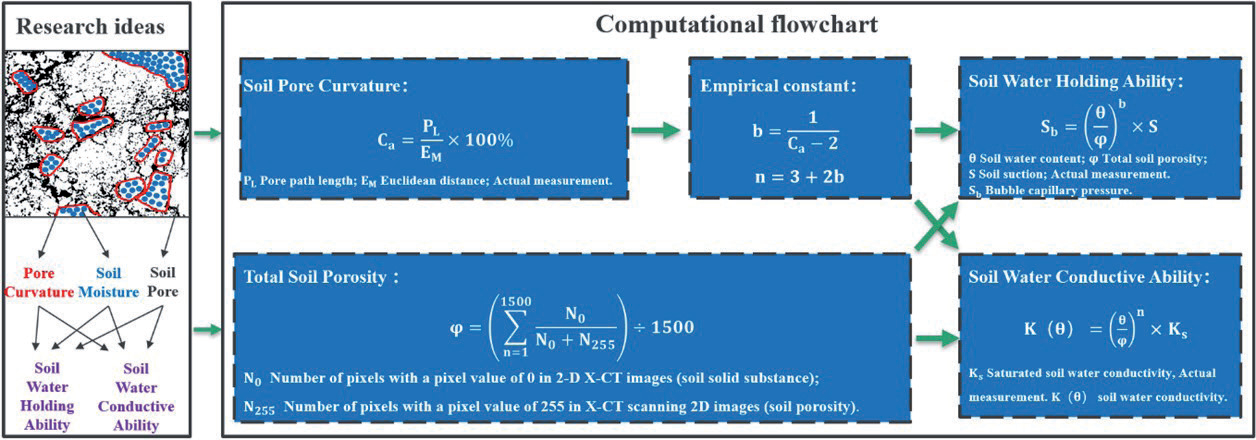
The research idea and calculation flow of this paper are shown in Fig. 1. The scientific hypothesis of this paper is that soil moisture exists in soil pores, which are affected by pore curvature and change the movement and distribution of soil moisture. We calculated the pore curvature by measuring the pore path length and Euclidean distance [32]. The empirical constants b and n were further calculated. For the soil porosity, we calculate the number of pixels in the two-dimensional X-CT images. Finally, the water-holding capacity and hydraulic conductivity of the soil samples were derived.
Field Experiment and Laboratory Analysis
Sampling Points
Sampling points are situated in the Qinghai-Tibet Plateau’s central region, characterized by a sub-cold monsoon and semi-humid climate, with minimal seasonal variation and significant diurnal temperature fluctuations (Fig. 2). Point 1 is at 31°3′51″N, 91°41′33″E (4500m elevation), and Point 2 is at 32°33′16″N, 91°49′26″E (5000m elevation). The average annual temperature is -0.6ºC, and the average daily difference in temperature is 16.5ºC [33]. Soil samples were collected from alpine meadow soils during their growing season for this experiment. According to the World Reference Base for Soil Resources (WRB), alpine meadow soils can be classified into one of several categories, with the most relevant classifications likely being “Leptosols” (shallow soils), “Phaeozems” (dark soils), or “Umbrisols” (humus-rich soils), depending on specific features such as the content of organic matter, soil depth, and stone content. Alpine meadow soils have a diverse parent material, including weathered rock, glacial remnants, and mountain sediments. Particle size distribution varies from coarse sand to fine clay, determined by the specific parent material and climatic conditions of the region. These soils typically contain a high level of organic matter, with a significant organic carbon content, attributed to the slow decomposition rates of plant residues under cold climate conditions, facilitating the accumulation of organic matter. The bulk density of alpine meadow soils is relatively low, a consequence of the high organic matter content and loose soil structure, which supports root growth and water retention.
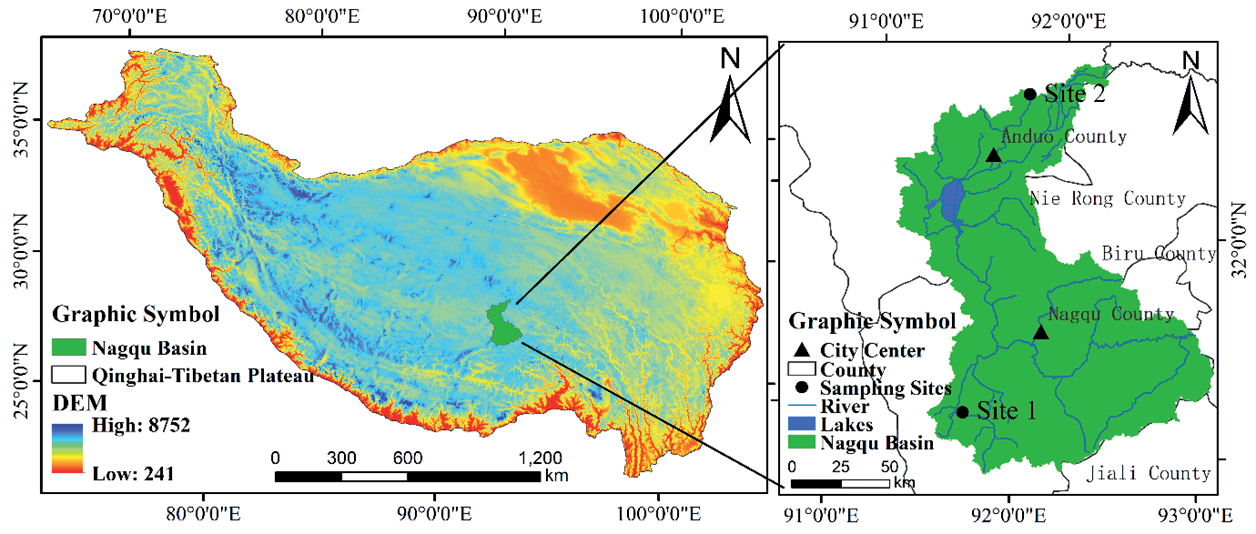
Sampling sites were chosen at the Xiangmao Township experimental site and Xiaotanggula Mountain experimental site within the Naqu basin. Soil types at both sampling sites were dominated by alpine meadow soil. They are located in the upper and lower reaches of the Naqu watershed, respectively. The surface of the sampling site in Xiangmao Township was covered with vegetation, while the sampling site in Xiaotanggula Mountain was bare soil. The natural environment of the two places is similar. The Xiaotanggula Mountain sampling site was used as a replication of the Xiangmao Township sampling site. Observations were conducted over two consecutive growing seasons at the experimental sites. As much as possible, we made sure that the changes we observed were caused by changes in time, temperature, and humidity, and not random changes. Over the years, we have been deploying monitoring equipment at two experimental sites, and we have obtained a large amount of soil temperature and moisture data to support this research.
Sample Collection
Field samples were taken in 2021 and 2022 during the regreening and wilting periods at the Xiangmao Town and Xiaotanggula Mountain test sites established by the China Institute of Water Resources and Hydropower Research (IWHR). Before sampling, we removed vegetation and debris from the site’s surface. Using a 1-meter-long auger with a 5-centimeter internal diameter, the auger was slowly advanced vertically over the top of each soil layer to collect the undisturbed soil column from each layer. Then slowly push it into a 5 cm high PVC transparent tube with an inner diameter of 5 cm and wrap it carefully in plastic wrap. The sampling depth was 0-50 cm. Five soil layers (5 cm, 10 cm, 20 cm, 35 cm, 50 cm) were collected. A total of 40 soil samples were collected from the two experimental sites. After each sampling, the soil samples were stored in ice bags and sent to the Nanjing Institute of Soil Sciences of the Chinese Academy of Sciences to obtain soil pore parameters. Soil moisture and soil temperature data acquisition equipment is embedded near the sampling point. The buried depths of the equipment are 5cm, 10cm, 20cm, 35cm, and 50cm. Soil moisture, water potential, and temperature are collected every 1 hour. After continuous soil monitoring, we obtained soil moisture and soil temperature data of different soil layers at the experimental sites during the regreening and wilting periods [33] A double-ring infiltration experiment was carried out near the sampling point. The saturated soil water conductivity of sampled soils was obtained by long-term (4 h) observation [33].
Sample Testing and Image Processing
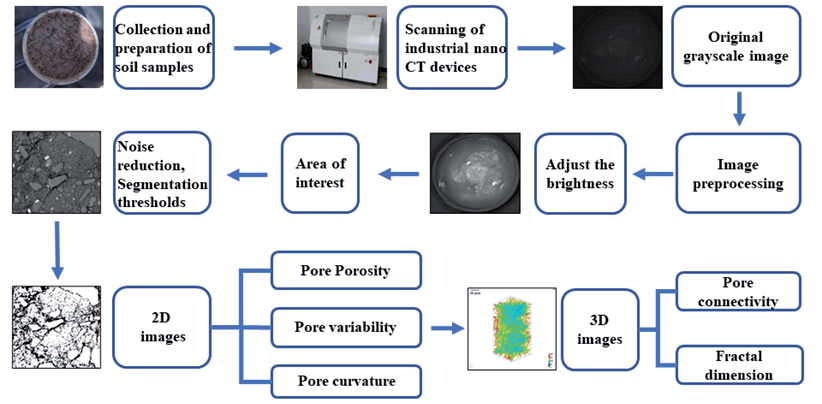
The undisturbed soil columns were subject to X-ray computed tomography (ZX _ 2014) at the Nanjing Institute of Soil Research, Chinese Academy of Sciences (the Nanotom S model produced by Phoenix, voltage 180kV, power 15W). The device could observe the three-dimensional appearance and internal structure of the undisturbed soil column without destroying its integrity. Meanwhile, pore volume, surface area, length, connectivity, and fractal dimension could be calculated. These scanned images were in TIFF format with a resolution of 25 μm/pixel. In order to improve the precision and eliminate the edge error, the cuboid of 2.5 cm, 2.5 cm, and 5 cm in the center of the soil column was studied. (The cuboid is an undisturbed clod.) Three-dimensional structure images and two-dimensional continuous slice images of soil pores were obtained by using ImageJ software (Fig. 3).
Calculation of Soil Pore Characteristic Parameters
Soil Porosity
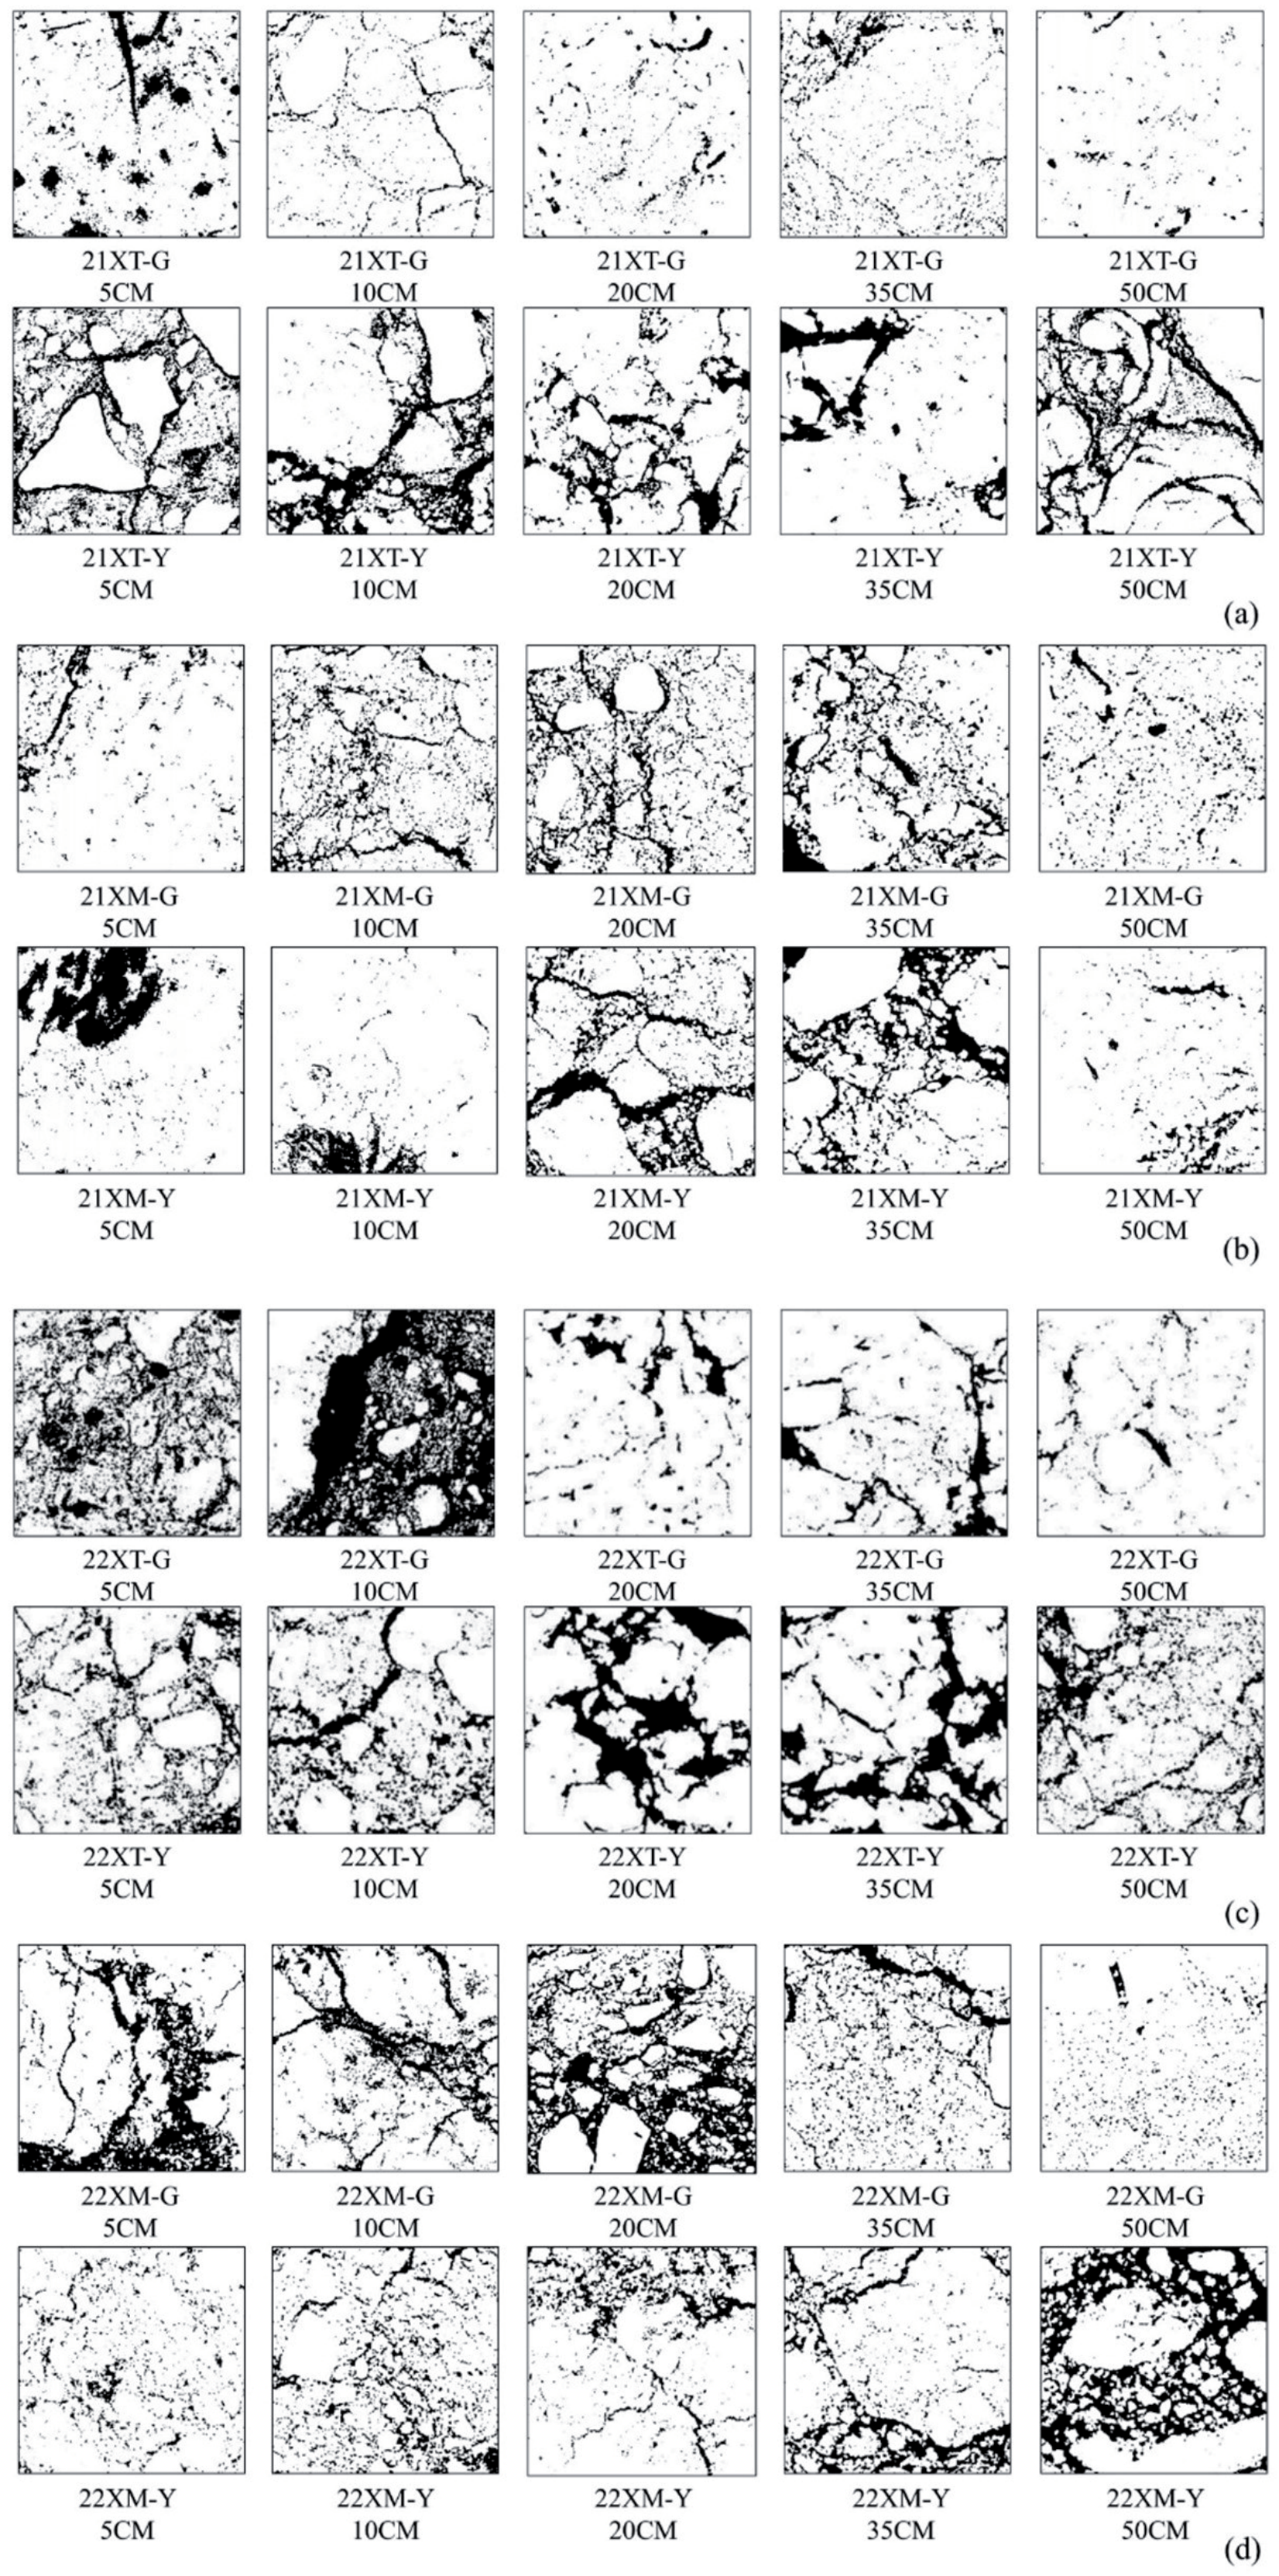
2D image is transformed into a digital matrix by Image J software. The pixel value 0 represents the solid substance in the soil (the white part in Fig. 4). The pixel value 255 represents the pore in the soil (the black part in Fig. 4). For each soil sample, the ratio of the number of 255 pixels to the number of all pixels in each 2D image was calculated. Repeat this calculation for 1500 images and take the average value, the porosity of this soil sample was obtained.
Where η is the porosity of undisturbed soil blocks; n is the number of images; N0 refers to the number of pixels with a pixel value of 0; and N255 is the number of pixels with a pixel value of 255.
Pore Variability
Pore variability is used to describe the difference in soil porosity between adjacent soil layers. The higher the pore variability, the stronger the soil spatial variability [34]. Which is not conducive to vegetation growth.
Where E is the pore variability; ηu refers to the porosity of the upper soil; and ηu corresponds to the porosity of the lower soil.
Pore Connectivity
The ratio of the largest pore volume in each sample to the total volume of the soil sample [35].
Where Rp is the connectivity of pores; VPAMAX refers to the volume of the largest pore in the undisturbed soil blocks; and V is the total volume of the undisturbed soil blocks.
Fractal Dimension
Soil pore complexity can be quantitatively evaluated by the relationship between pore surface area and pore circumference [36].
Where D is the pore fractal dimensions; P refers to the pore circumference; and A corresponds to the pore surface area. The larger the fractal dimension, the higher the soil pore complexity.
Pore Curvature
The curvature of soil pores can be quantitatively evaluated by the relationship between the length of the pore path and the Euclidean distance [37-39]. It was computed assuming the geodesic reconstruction algorithm implemented by Roque [32].
Where Ca is the mean soil pore curvature, as follows; PL refers to the length of the pore path; and EM refers to the Euclidean distance. The higher the curvature of the pore, the stronger the hygroscopic ability.
Formula Derivation and Accuracy Verification
Calculate Soil Water-holding Capacity and Hydraulic Conductivity
The Campbell formula has been widely used in soil moisture research since its appearance in 1974 and has achieved fruitful results [36, 40-41]. In the Campbell formula, the empirical constant b is used to describe the complexity of the soil pore distribution. There is a functional relationship between the empirical constant n and b. The fractal dimension D, indicating complex shape irregularity, characterizes soil pore distribution complexity. As a result, Tyler SW first introduced the fractal dimension into the Campbell formula in 1990, which greatly contributed to the study of soil water retention and hydraulic conductivity [42]. They found that the Campbell formula still holds true for parameters
Fig. 4.
Two-dimensional images illustrate the spatial distribution of soil pores in the Little Tanggula Mountains (Figs. a and c) and Xiangmao Township (Figs. b and d). Note: 21XT-G and 21XT-Y in (a) and (b) denote soil samples collected from Xiaotanggula Mountain in 2021 during the regreening and wilting periods respectively, while 21XM-G and 21XM-Y denote soil samples collected from Xiangmao Township in 2021 during the regreening and wilting periods respectively. The black part of the image shows soil pore and the white part shows other solid-phase materials in the soil. 5 cm denotes sampling depth of 5 cm. (c) and (d) are soil samples in 2022, and other representations are consistent with (a) and (b), as follows.
Where θ is the soil volumetric water content; η refers to the soil porosity; Sb corresponds to the bubble capillary pressure; S is the soil suction; D refers to the fractal dimension; K(θ) corresponds to the soil water conductivity; Ks is the soil saturation conductivity; as follows.
In the original Campbell formula, the soil porosity was calculated using the ring knife method. The method is time-consuming, the sample cannot be reused, and it is easy to miss the aerated pore, which affects the accuracy. Therefore, the soil porosity was calculated from the two-dimensional X-CT images. The specific method has been described in the previous section, and will not be repeated here. This method is short-lived and the sample can be reused to measure other parameters. The 25 μm resolution of the test instrument is sufficient to guarantee the test accuracy. In summary, the adjusted Campbell formula includes the water-suction curve (Eq. (8)) and the water-conductivity curve (Eq. (9)). On this basis, the soil water-holding capacity (Eq. (10)) and soil hydraulic conductivity (Eq. (11)) of different soil layers are obtained.
Accuracy Verification
The resistance of soil water movement in soil pores is mainly the bubble capillary pressure. The higher the capillary pressure, the slower the soil water flow. Therefore, the soil suction Ssat corresponding to the saturated water content is usually equated with the bubble capillary pressure Sb. The more similar the two, the higher the accuracy [44]. Using this principle, the accuracy of the adjusted Campbell formula is verified. Using the Clapp-Hornberger equation (moisture-suction curve):
Where Ssat is the soil suction corresponding to the saturated moisture content (hereafter referred to as Ssat); θs refers to the saturated moisture content; b is the Clapp-Hornberger constant [45].
To further validate the accuracy of the adjusted Campbell formula, we cite data such as saturated water content and saturated hydraulic conductivity used by Deng [33]. in their study. Since they did their study in the same area at a similar time, the relevant data can be quoted. The validation method was to calculate K(θ) using Campbell formula based on pore curvature (Eq. (11)) and fractal dimension (Eq. (13)), respectively, and compare the correlation with an RMSE with the measured data K(θ) from Deng [33].
Results
Analysis of Soil Pore Characteristics
Frequent sampling in alpine meadows, being integral ecosystems, can damage the experimental field’s ecosystem, thereby affecting research result accuracy. Consequently, we compared pore characteristics, including number, morphology, and distribution, at the regreening and wilting stages of the growing season to analyze alpine meadow soil.
Quantitative Characterization of Soil Pore
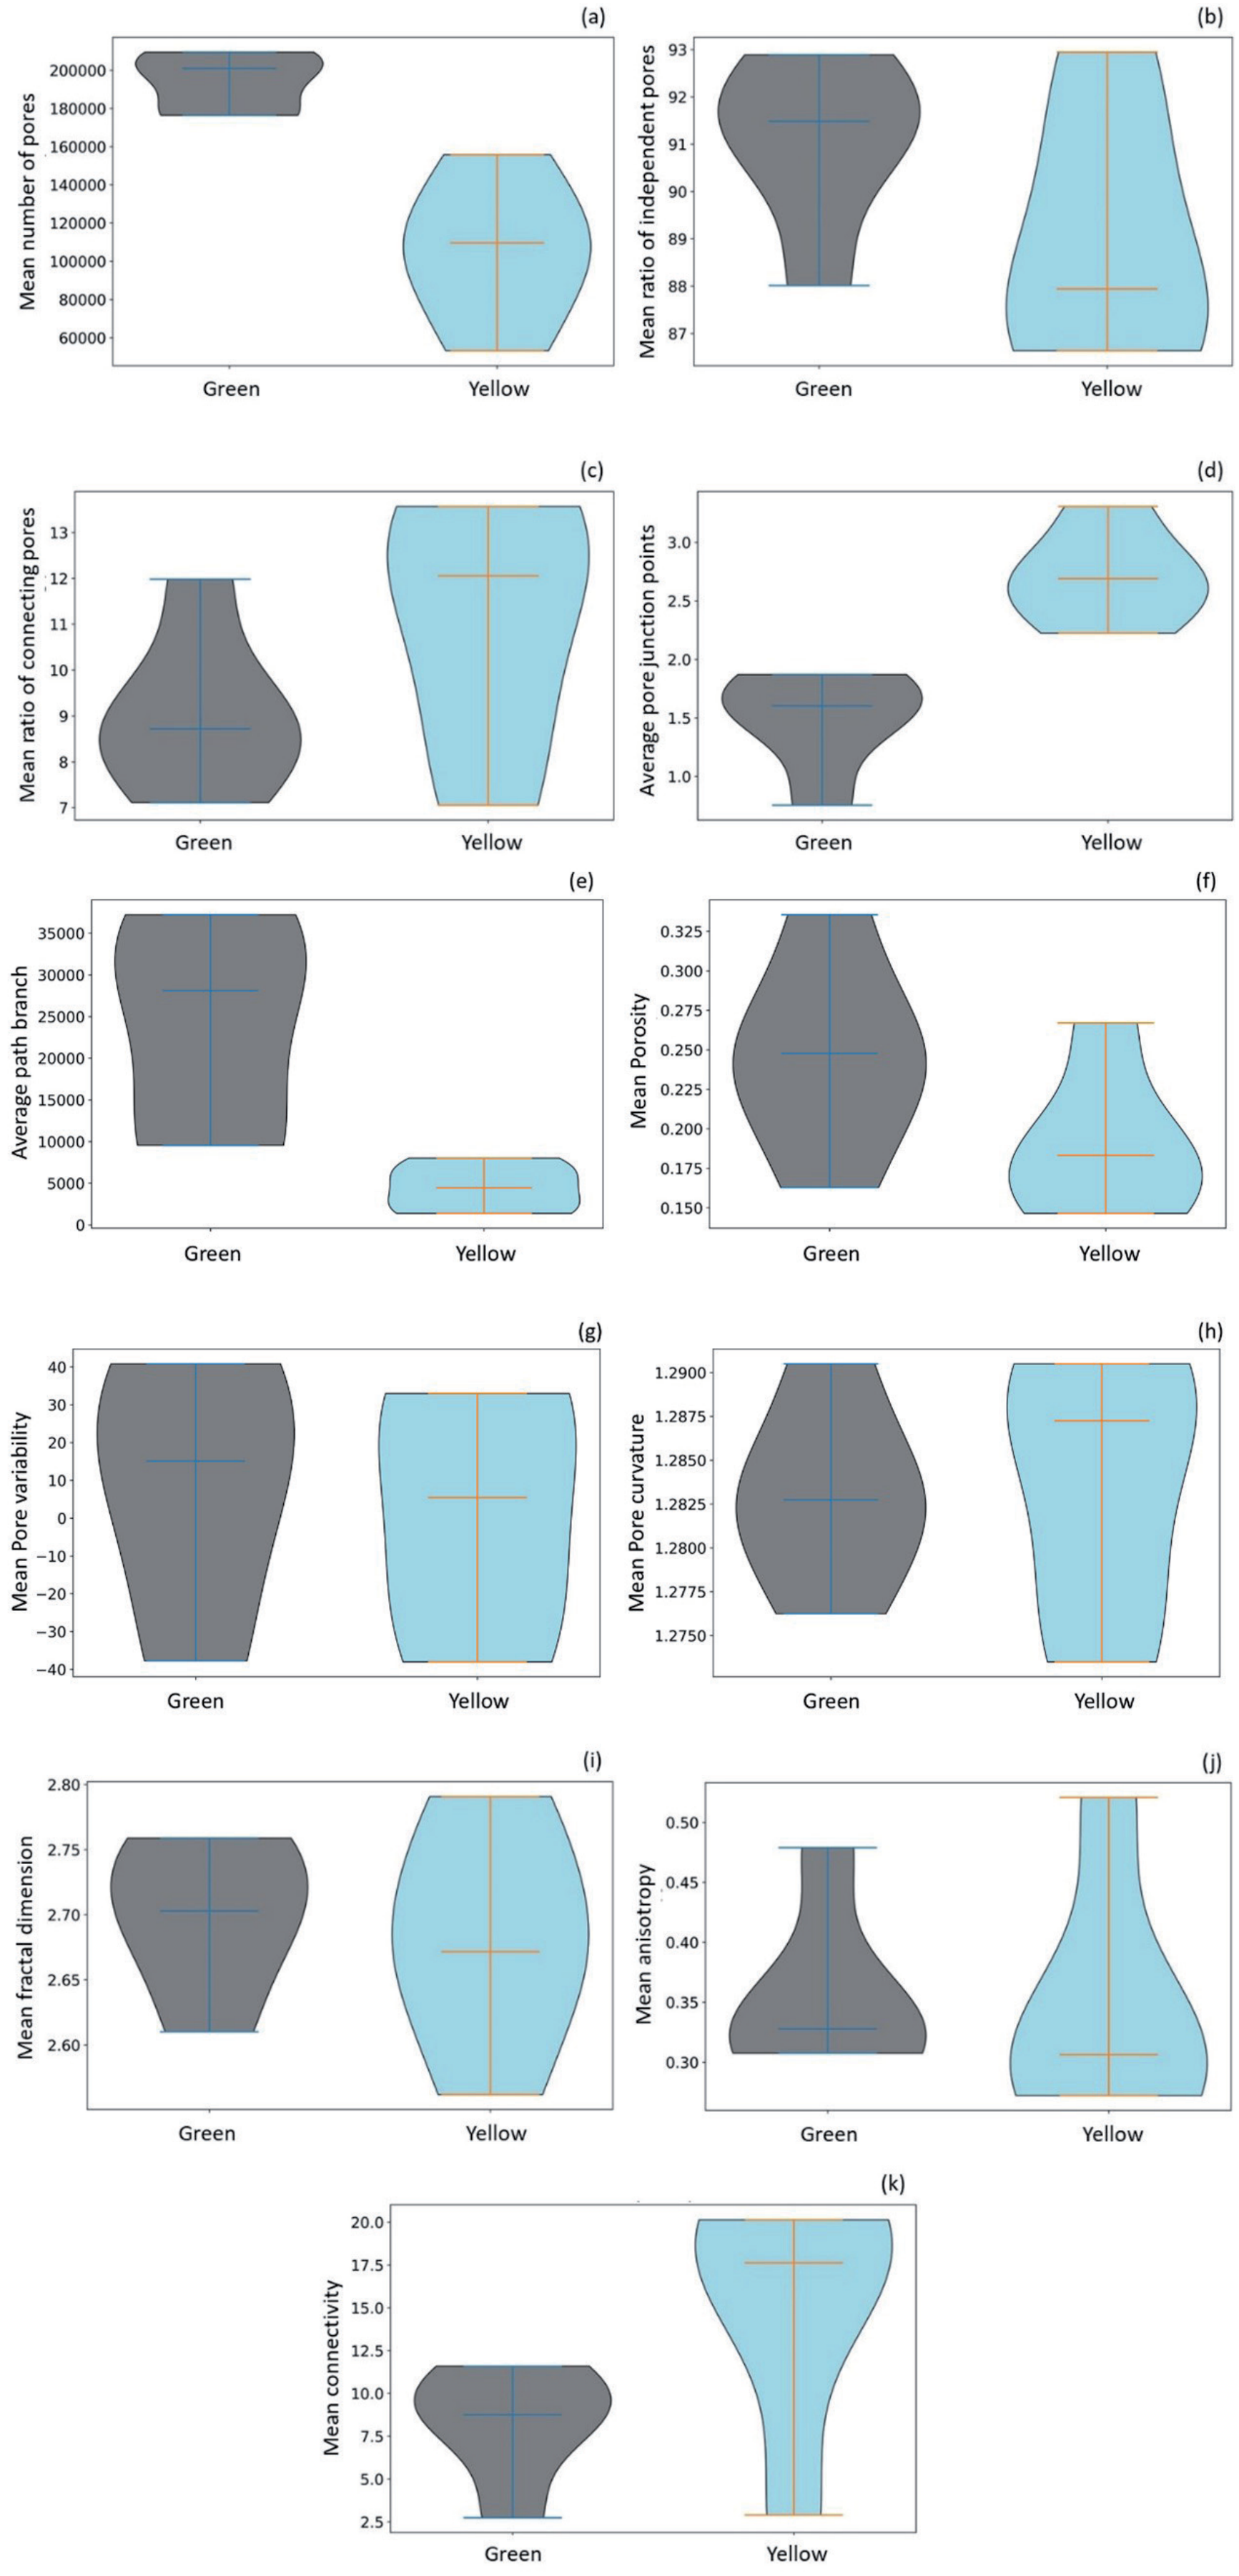
Soil pore numerical characteristics encompass pore number (Fig. 5(a)), ratios of independent (Fig. 5(b)) and connected pores (Fig. 5(c)), average pore junction (Fig. 5(d)), and path branch (Fig. 5(e)). Soil pores can be divided into two types according to their connectivity, independent pores and connected pores [46-48]. Independent pores are dominated by small pores and connected pores by large pores [49]. The mean number of pores in different soil layers decreased in different degrees during the growth period (Fig. 5(a)). Pore numbers significantly vary across soil layers. The pore type is mainly independent pores (Fig. 5(b)). As shown in Table 1 of the appendices, from the regreen to the wilting stage, Xiaotangula Mountain soils showed changes: independent pore ratios decreased from 92.66% to 89.88%, connected pore ratios increased from 7.33% to 10.11%, average pore junctions rose from 1.16 to 3.14, and path branches fell from 42986.5 to 23531.5. In Xiangmao Township, soil layers experienced a decrease in independent pore ratios from 88.95% to 87.10%, an increase in connected pore ratios from 11.04% to 12.89%, pore junctions from 1.84 to 2.27, and path branches from 4091.1 to 4423.2.
In summary, the shift in alpine meadow soil pore characteristics primarily reflects a decrease in independent pores and an increase in connected pores (Fig. 5(b), Fig. 5(c)). However, the number of independent pores still dominates in all soil layers (Fig. 5(b)). During the growing season, we noted a marked decrease in pore path branching and an increase in pore junctions (Fig. 5(d), Fig. 5(e)). This is caused by the change of small pores to large pores in alpine meadow soil. This change was particularly notable in the Xiaotanggula Mountains. We thus infer that soil connectivity will increase. This may be related to the development of root systems in alpine meadows. The development of the root system breaks down the gaps in the separate pores and connects the small pores into large ones.
Fig. 5.
Violin plots illustrating soil pore characteristics. Note: Green denotes the regreening period and Yellow denotes the wilting period, as follows. (a) indicates the mean number of pores, (b) denotes the mean ratio of independent pores, (c) indicates the mean ratio of connecting pores, (d) denotes the average pore junction points, (e) indicates the average path branch, (f) denotes the mean porosity, (g) indicates the mean pore variability, (h) denotes the mean pore curvature, (i) indicates the mean fractal dimension, (j) denotes the mean anisotropy and (k) indicates the mean connectivity.
Morphological Characteristics of Soil Pore
Soil pore morphology parameters comprise porosity (Fig. 5(f)), variability (Fig. 5(g)), curvature (Fig. 5(h)), surface area (Fig. 6(a)), volume (Fig. 6(b)), length (Fig. 6(c)), and sphericity (Fig. 6(d)) [50-52]. As shown in Table 2 of the appendix, the changes in soil pore morphology characteristics from the regreen stage to the wilting stage as follows: soil porosity decreased from 25.02% to 19.10% in Xiaotanggula Mountain and from 24.13% to 18.66% in Xiangmao Township. The mean of pore variability of each soil layer decreased from 10.91% to 4.16% in Xiaotanggula Mountain and from 5.73% to -1.26% in Xiangmao Township. Pore curvature decreased by 3.00% in Xiaotanggula Mountain and by 1.04% in Xiangmao Township. Surface area increased from 0.20 to 0.73 in Xiaotanggula Mountain and from 0.60 to 0.79 in Xiangmao Township. Volume increased from 0.01 to 0.04 in Xiaotanggula Mountain and from 0.04 to 0.05 in Xiangmao Township. Sphericity changed from 62.87±9.96 to 63.66±10.34 in Xiaotanggula Mountain, but decreased from 61.83±10.32 to 60.49±9.83 in Xiangmao Township. Length increased from 0.14±0.19 to 0.15±0.21 in Xiaotanggula Mountain and from 0.15±0.19 to 0.17±0.25 in Xiangmao Township.
Soil porosity in alpine meadow soil decreased during the growing season. Significant decreases in pore variability during the growing seasons suggest stabilization of soil pore development. This stabilization relates to the slowing, stopping, or dying of alpine meadow root systems during wilting periods. Soil pore curvature showed a decreasing trend (Fig. 6(h)). Changes in pore sphericity and pore length were not significant (Fig. 6(c), Fig. 6(d)). This is not conducive to the vertical development of root systems in alpine meadows. We can see that the increase in soil pore surface area was much larger than the increase in pore volume in both experimental sites (Fig. 6(a), Fig. 6(b)). This suggests that horizontal development dominated pore formation [53]. It is inferred that the alpine meadow soil has a strong water-holding capacity.
Spatial Distribution Characterization of Soil Pore
Parameters for pore space distribution are fractal dimension (Fig. 5(i)), anisotropy (Fig. 5(j)), and connectivity (Fig. 5(k)) [54-56]. Fractal dimension and anisotropy quantify the space distribution characteristics of soil pores in the soil structure. As shown in Table 3 of the appendix, the average fractal dimension of pores across Xiaotanggula Mountain’s soil layers remained stable at approximately 2.67 during the growing seasons. Anisotropy in Xiaotanggula Mountain’s soil layers decreased from 0.39 to 0.31 during the growing seasons. Connectivity in each soil layer increased from 4.45% to 16.43% during the growing seasons. In Xiangmao Township, the average fractal dimension slightly decreased during the growing seasons, with no significant change. However, pore anisotropy in each soil layer increased from 0.32 to 0.38, and connectivity from 12.23% to 14.62%.
In summary, the soil pore space distribution characteristics of alpine meadow soil in the growing season were mainly characterized by a complex overall distribution (Fig. 5(i)), reduced anisotropy (Fig. 5(j)), and increased connectivity (Fig. 5(k)). Both soil pore quantity and morphological porosity characterizations indicated a decrease in pore numbers during the growing season. The decrease in pore numbers, alongside the distribution characteristics, is attributed to increased connectivity. The enhanced pore connectivity is manifested in the pore morphology characterized by the appearance of large pores with high surface area and low volume (Fig. 6(a), Fig. 6(b)). Such macropores hinder vertical movement and distribution of soil moisture. Anisotropy’s impact on root characteristics within pore spaces remains unclear. The fractal dimension can reflect the variation in the proportion of clay, silt, and sand in soil texture [36]. A higher fractal dimension means higher clay content. This also hinders the flow of soil moisture. Therefore, it is believed that alpine meadow soil possesses greater water-holding capacity than hydraulic conductivity.
Relationship Between Soil Pore Characteristics and Hydraulic Parameters
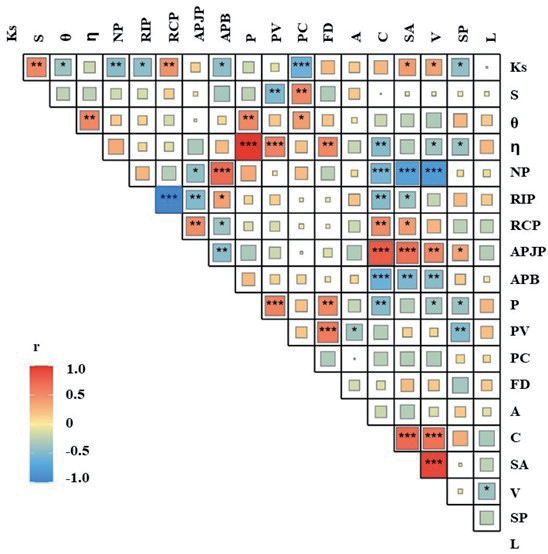
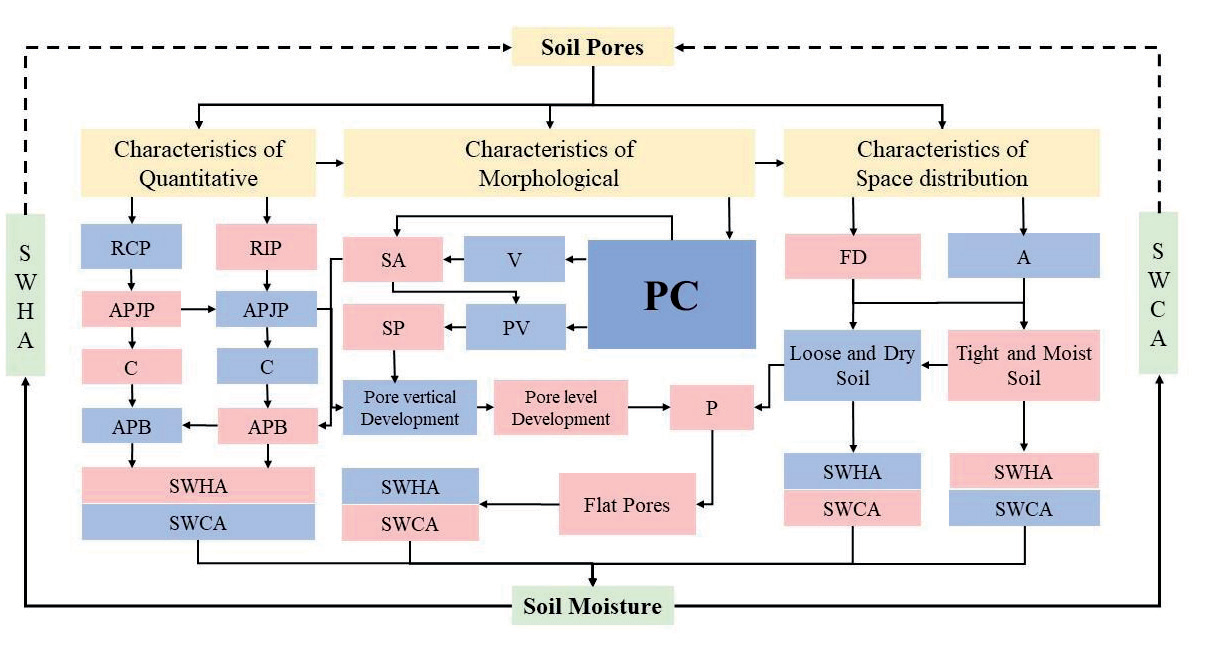
After calculating the quantitative, morphological, and spatial distribution parameters of soil pore, we analyzed the relationship between the saturated hydraulic conductivity and soil suction and the above soil pore parameters (Fig. 7). We found a strong negative correlation between pore curvature and saturated hydraulic conductivity, whereas soil suction showed a significant positive correlation. This indicates that a decrease in pore curvature leads to an increase in soil hydraulic conductivity and a decrease in soil suction. This is the reason why we chose pore curvature to improve the Campbell formula. There was a significant negative correlation between soil suction and pore curvature. This suggests that the decrease in soil water-holding capacity during the wilting periods is related to the stabilization of pore development. Pore numbers showed a significant correlation with connectivity, surface area, and volume. This indicates that the quantitative characteristics of the pores are strongly influenced by the morphological characteristics. The high correlation between the ratio of independent pores and the ratio of connected pores proves our previous point. From the regreening periods to the wilting periods, the independent pores shifted to the connected pores. This is the main characteristic of the change in soil pore number. A strong positive correlation between average pore junctions, connectivity, and surface area suggests the horizontal orientation of pores. This highlights the primary morphological change in soil pores. The significant correlation between fractal dimension and pore variability indicated that the pore spatial distribution characteristics were related to morphological changes. By the wilting periods, when the pore variability stabilized, the spatial distribution of pores was also basically determined. We created a mechanism diagram to detail the interaction between soil pores and water, illustrating how pore parameters affect water-holding capacity and hydraulic conductivity (Fig. 8).
Fig. 6.
Multivariate analysis plots highlight the characteristics of soil pore morphology. Note: (a) calculated by the surface area, (b) calculated by the volume, (c) calculated by the length and (d) calculated by the sphericity.
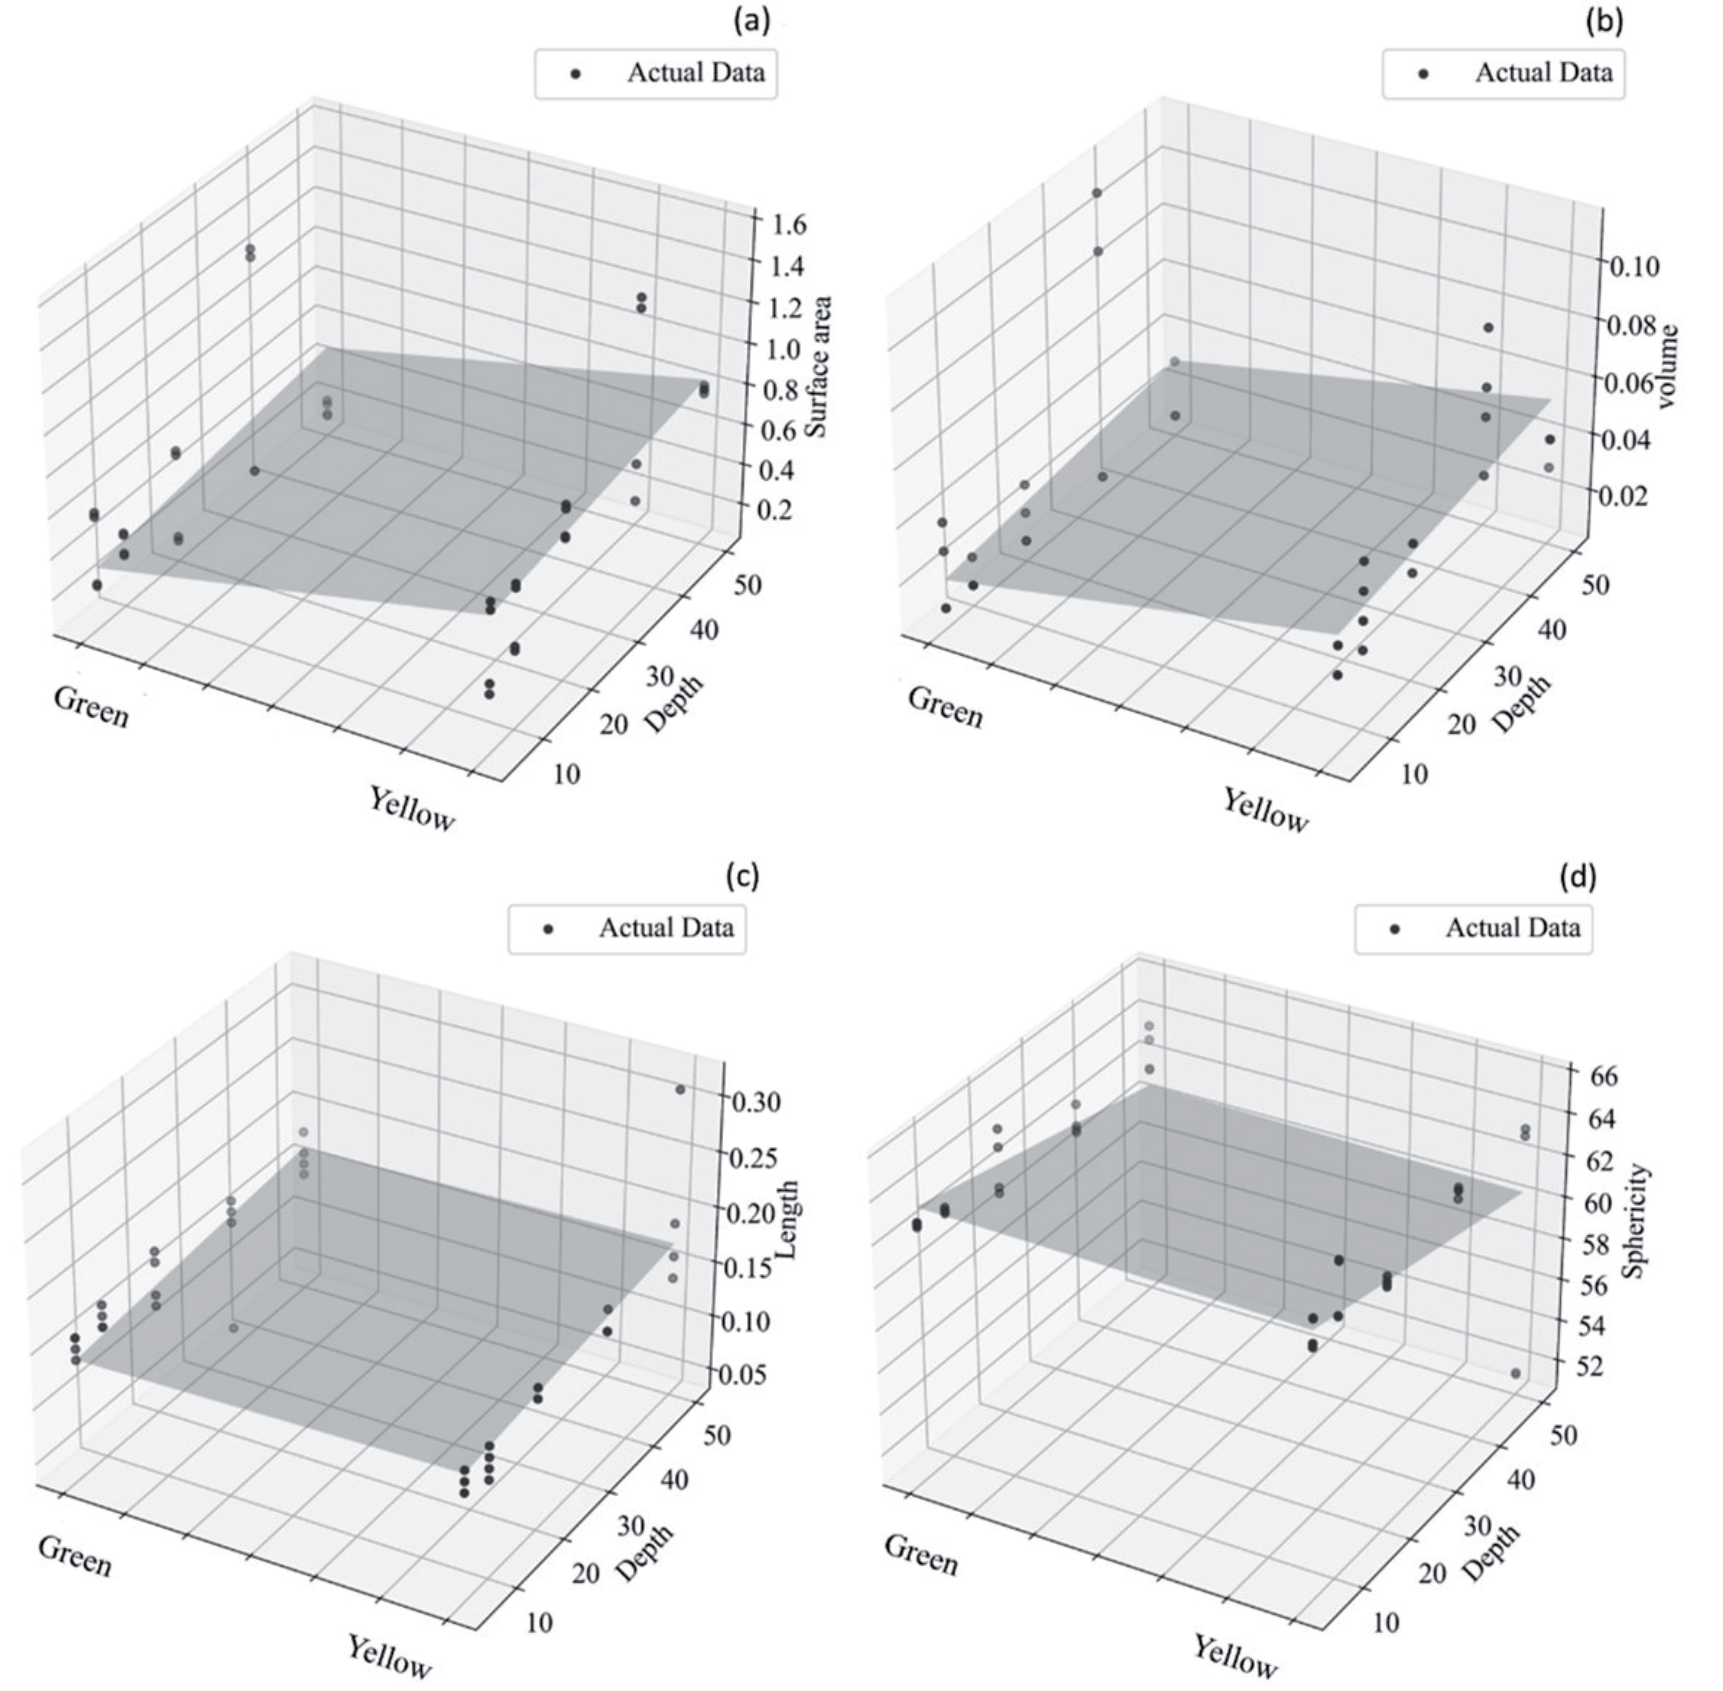
Fig. 7.
Heat map showing the relationship among soil pore characteristics, saturated hydraulic conductivity, and soil suction. Note: For abbreviation definitions, refer to Table 6 in the Supporting Materials. Larger squares and more stars in the graph indicate a stronger correlation.
Analysis of Soil Hydraulic Characteristics Based on the Adjusted Campbell Formula
Verifying the Accuracy of The Soil Water-Holding Capacity and Hydraulic Conductivity
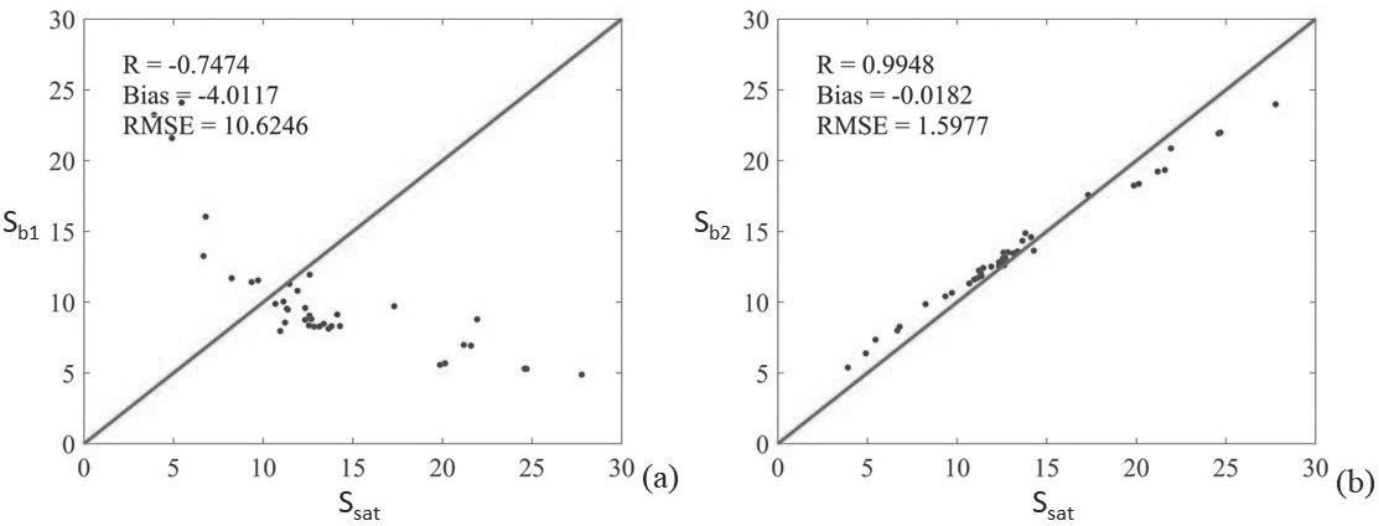
Prior to assessing alpine meadow soil’s water-holding capacity and hydraulic conductivity, we verified the adjusted Campbell formula’s outcomes using equations in section 2.4.2. The calculation results are detailed in Table 4 in the appendix. Eq. (12) was used to verify soil water-holding capacity, and Eq. (13) for soil hydraulic conductivity. Soil water-holding capacity and hydraulic conductivity were verified using measured data and data from Deng [33], respectively. Results indicated that for the growing season, Sb1 (soil water-holding capacity), derived from the Campbell formula using fractal dimension, had a correlation (R) of -0.7474 with Ssat, while Sb2 (soil hydraulic conductivity), based on pore curvature, had an R of 0.9948 with Ssat. Fig. 9 shows the scatter plot we plotted. From the Fig. 9, we can see that Sb2 fits better than Sb1 with Ssat. For the soil hydraulic conductivity, we verified the accuracy by calculating the Bias and RMSE of the simulated and measured data. According to Table 1 and Table 5 in the appendices, K2(θ) soil hydraulic conductivity, derived from the Campbell formula using pore curvature, had a Bias of -0.0112 and RMSE of 0.0148; K3(θ), using fractal dimension, had a Bias of 0.0782 and RMSE of 0.0784. In conclusion, Campbell formula based on pore curvature is more accurate than Campbell formula based on fractal dimension. We consider the new method to be reliable.
Spatiotemporal Variation Analysis of Soil Water-holding Capacity
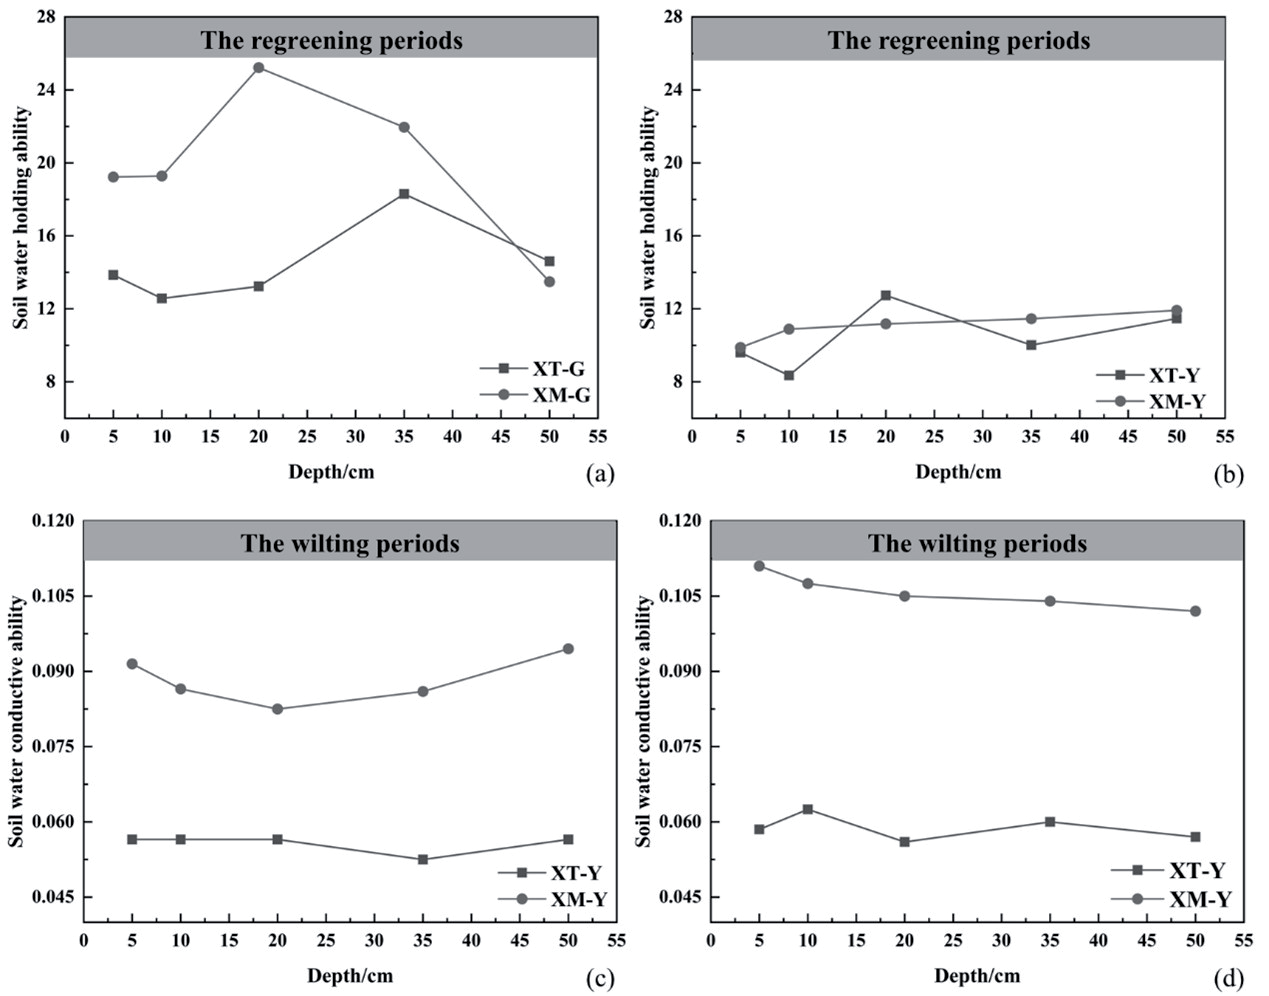
Using the Campbell formula adjusted for pore curvature (Eq. (10)), we calculated the water holding capacities across different soil horizons in Xiaotanggula Mountain and Xiangmao Township over two growing seasons. The violin plots of soil water-holding capacity of alpine meadow soil with superimposed box plots were drawn (Fig. 10(a)), and the dot-line map indicating the characteristics of temporal and spatial variations of water-holding capacity of alpine meadow soil was plotted (Fig. 11(a), Fig.11(b)). During the regreening periods, water holding capacities in each soil layer initially increased then decreased in both Xiaotanggula Mountain and Xiangmao Township. In the wilting periods, the spatial characteristics of the soil water-holding capacity in Xiaotanggula Mountain were more obvious, which was in the shape of “W”. By the wilting period, the soil water-holding capacity of both sampling sites showed a decrease. This was due to a decrease in independent pores (Fig. 5(b)) and an increase in connected pores (Fig. 5(c)), resulting in lower soil porosity (Fig. 5(f)) and higher pore connectivity (Fig. 5(k)). The decrease in pore variability indicates a stabilization of pore development (Fig. 5(g)). The morphological characteristics of high surface area and low volume of pores indicate that pore development is dominated by the horizontal direction (Fig. 6(a), Fig. 6(b)). Therefore, at the pore scale, the reduction in soil water-holding capacity during the growing season is attributed to the development of flattened, stabilized, and interconnected pores. However, a high fractal dimension indicates a high clay content in the soil. This leads to a decrease in the soil water-holding capacity of alpine meadow soil by the time of wilting, but it still has high water-holding capacity.
The decrease in water-holding capacity can promote the vertical movement and distribution of soil moisture. During the growing season, both sites exhibited high air bubble capillary pressure in the middle soil layers. This indicates that soil moisture in alpine meadow soil is concentrated in the middle of the soil layer. This is also the soil layer where alpine meadow roots are enriched. Enhanced soil water-holding capacity ensures ample moisture, benefiting root development. Additionally, the dense vegetation root system plays a crucial role in maintaining the soil’s high water-holding capacity.
Fig. 10.
A combined box-and-whisker and violin plot illustrates soil hydraulic characteristics. Note: (a) Represents soil water retention capacity, and (b) signifies soil water conductivity.
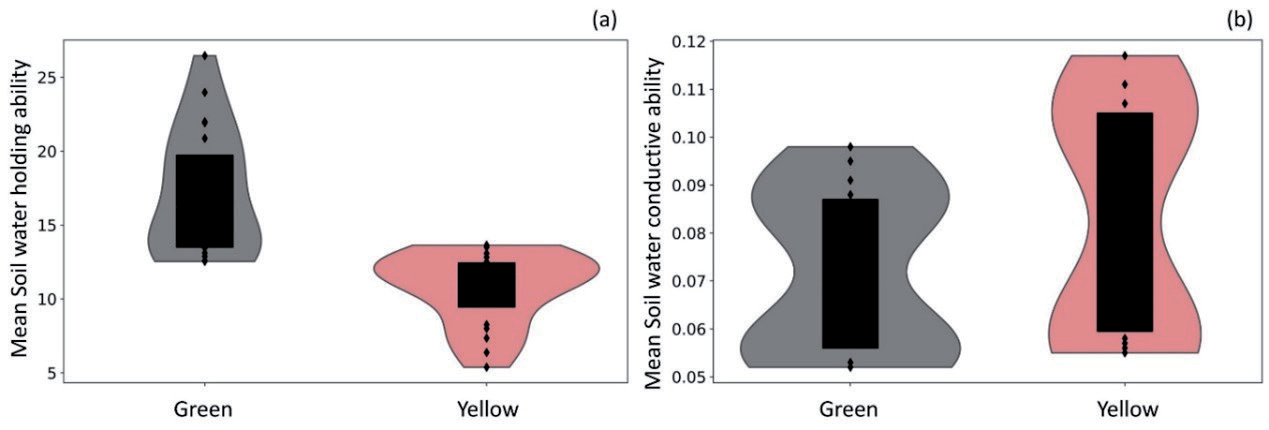
Fig. 11.
Line charts depict temporal and spatial variations in soil hydraulic properties. Note: (a) Details the distribution of soil water retention during the regreening period, while (b) does so for the wilting period. (c) Describes the distribution of soil water conductivity during the regreening period, and (d) during the wilting period.
Spatiotemporal Variation Analysis of Soil Hydraulic Conductivity
Using the Campbell formula adjusted for pore curvature (Eq. (11)), we calculated soil hydraulic conductivity across various soil layers in Xiaotanggula Mountain and Xiangmao Township over two growing seasons. We then illustrated these findings with violin plots superimposed with box plots (Fig. 10(b)) and dot-line maps showing spatial and temporal variations (Fig. 11(c), Fig. 11(d)). During the regreening period, soil hydraulic conductivity at both sites displayed a notable change at depths of 20-35 cm (Fig. 11(c)), with a decline in conductivity and an increase in water-holding capacity up to 35 cm. Beyond this depth, hydraulic conductivity rose, and water-holding capacity decreased. 0-35cm is the main soil layer for root development in alpine meadows. Therefore, the phenomenon of rising soil water-holding capacity and decreasing soil hydraulic conductivity in the regreening period may be related to root development in alpine meadows. Root development absorbs water and traps it at that location, leading to a reduction in soil hydraulic conductivity. At the pore scale during the regreening period, independent pores constituted over 87% of total pores (Fig. 5(b)), with an average pore intersection below 2.0 (Fig. 5(d)), indicating lower pore connectivity compared to the wilting period (Fig. 5(k)). During the wilting period, soil hydraulic conductivity in the Xiaotanggula Mountains exhibited an “M” shape (Fig. 11(d)). This mirrors the earlier-described “W” shape of soil water-holding capacity in the Xiaotanggula Mountains during the wilting period (see Section 3.2.2). This suggests that in soil layers with high water-holding capacity, soil hydraulic conductivity weakens correspondingly.
Notably, from the regreening to the wilting period, both sampling sites exhibited increased soil hydraulic conductivity and decreased water-holding capacity in the alpine meadow soil layers. Based on the improved Campbell formula, the highly significant negative correlation between soil pore curvature and saturated hydraulic conductivity, and the significant positive correlation between soil suction, we concluded that it was the decrease in soil pore curvature that caused the decrease in soil water-holding capacity and the increase in soil hydraulic conductivity.
Discussion
Pore Curvature is Fitting Better Than Fractal Dimension in Alpine Meadow Regions
Research based on the soil as a porous medium indicates its pore structure exhibits self-similarity [57]. After the study of soil pores was expanded from two dimensions to three dimensions, scholars adapted the Campbell formula accordingly. They contended the original Campbell formula was suited for two-dimensional analysis [36, 57] and suggested modifying the fractal dimension for three-dimensional applications [58-59]. Concurrently, the fractal dimension’s role shifted from quantifying soil particle size to pore size distribution [40, 60]. In the original Campbell formula, the empirical constant
The Decrease of Soil Pore Curvature Causes the Decrease in Soil Water-Holding Capacity and the Increase in Soil Hydraulic Conductivity
Analysis of soil pore morphology and spatiotemporal variations in water-holding capacity and hydraulic conductivity revealed decreased water-holding capacity and increased hydraulic conductivity across sampling sites during growing seasons. Drawing on Eqs. (10) and (11) in section 2.4.1 and Fig. 7 in section 3.2, we infer that reductions in soil pore curvature decrease water-holding capacity and increase hydraulic conductivity. During the growing season, soil pore curvature decreased by 3.00%, water-holding capacity by 45.75%, and hydraulic conductivity increased by 5.22% on Xiaotangula Mountain. In contrast, Xiangmao Township saw decreases of 1.04% in pore curvature, 81.61% in water-holding capacity, and a 16.67% increase in hydraulic conductivity. The magnitude of variation in soil water-holding capacity and hydraulic conductivity in Xiangmao Township is higher than that of Xiaotanggula Mountain (Fig. 10(a), Fig. 10(b)). This may be due to the fact that the altitude of Xiangmao Township (4500 meters) is lower than that of Xiaotanggula Mountain (5000 meters). Xiangmao Township experiences an earlier growing season and a longer, more frequent, and intense freeze-thaw cycle compared to Xiaotangula Mountain [61]. This phenomenon is more pronounced in the main soil layers where the root system develops in alpine meadows. Fu posited that freeze-thaw cycles diminish soil’s water provisioning to vegetation [62]. Conversely, we propose that under a warming climate, accelerated freeze-thaw cycles reduce soil pore curvature, subsequently decreasing water-holding capacity and increasing hydraulic conductivity, thereby fostering alpine meadow development. Other studies have produced similar results. Liu and Rabot found that freeze-thaw cycling significantly alters the soil pore network, which enhances soil water retention [63, 64].
The Advantages and Disadvantages of the New Method
In order to enable the Campbell formula to analyze the water-holding capacity and hydraulic conductivity of soils with extremely complex pore structures under extreme hydrological conditions, we made two adjustments to the original formula. First, we revised the soil porosity calculation method. Instead of using ring-knife measurements [65, 66], this study calculates soil porosity from statistical analysis of pore pixel proportions in 2-D images from X-ray computed tomography. While this method may miss pores undetectable by the instrument, it reliably identifies water-holding pores. In addition, compared with the traditional ring-knife method, an important advantage of this method is that soil samples can be reused to obtain other soil pore characteristics. Second, we established a functional relationship between pore curvature and the empirical constants b and n in the Campbell formula, based on a quantitative description of soil pore curvature, leading to further adjustments to the formula. Soil pore curvature is the ratio of pore path length to pore Euclidean distance in pore scale, and it is a physical parameter. The addition of pore curvature increases the physical mechanism of the original Campbell formula, reduces distortion, increases accuracy, and further expands its applicability.
This study demonstrated the value of soil pore characterization parameters in studying the relationship between soil pore and soil hydraulic properties (Fig. 11). Through the quantitative analysis of soil pore characteristic parameters, the water-holding capacity and hydraulic conductivity of soil can be judged. At present, the research on the relationship between soil pores and soil hydraulic characteristics in the alpine meadow area mainly focuses on the macro field. The existing research results lack the microscopic description of the relationship between soil pores and soil hydraulic characteristics. The relationship between soil pore parameters, soil water-holding capacity, and hydraulic conductivity has not been established. The present study makes an effort to address these issues. This study successfully captured and quantitatively described the dynamic evolution of soil pore structure in the alpine meadow region. Many details of soil moisture movement during the growing season in the alpine meadow region were revealed.
However, this study still has some shortcomings and limitations. The study was limited to alpine meadow soils, and due to missing pore parameters for other soil types, applicability to other soils remains uncertain. It should be noted that X-ray computed tomography is not suitable for researchers conducting large-scale field sampling work. This study concentrates on the microscopic domain to investigate the relationship between soil pores and soil hydraulic properties. X-ray scanning inevitably causes some damage to soil samples [67], which affects the quality of the data. Pore connectivity may be underestimated due to the sample size requirements of the testing instrument (e.g. sample height should not exceed 6 cm [49]. A single formula may also have an impact on the results. Further research is needed to address these issues.
Conclusion
This study investigates the quantitative relationship between soil pore characteristics, water-holding capacity, and hydraulic conductivity in alpine meadows from a microcosmic perspective. It was found that the existing Campbell formula was inaccurate in calculating the soil water-holding capacity and hydraulic conductivity of alpine meadow soil. To solve this problem, we propose a new method to improve the Campbell formula based on pore curvature. The calculation results show that the new method is reliable. We further analyzed the spatial and temporal characterization of soil water-holding capacity and hydraulic conductivity in the alpine meadow region. It was concluded that soil water-holding capacity in the alpine meadow region tends to decrease during the growing season, while hydraulic conductivity increases. This was caused by the decrease in soil pore curvature. The number, morphology, and spatial distribution of soil pores changed during the growing season. Some of the individual pores gradually mutated into flattened connected pores between the regreening period and the wilting period. This phenomenon mainly occurs in the soil layer in which the root system of alpine meadows develops. The decrease in soil water-holding capacity and the increase in hydraulic conductivity help soil moisture circulate in the soil, which in turn promotes the development of alpine meadow root systems. This study suffers from a single sample type and technical limitations. However, the study of soil-water relationship in the microcosmic domain is very necessary. This research offers a scientific foundation for understanding soil-water relationships in alpine meadows. Finally, in response to the issues of a single sample type and technical limitations mentioned in this study, future research should expand the sample range and employ high-resolution imaging technologies and advanced soil analysis methods to achieve a more comprehensive and in-depth understanding.

