

Introduction
Ecological chemometrics is an interdisciplinary discipline that studies the relationship between the **e-mal: libinbin@mwr.gov.cn balance of multiple chemical element interactions and energy in ecosystems [1, 2]. Recent studies have shown that carbon (C), nitrogen (N), and phosphorus (P) are three important elements for biological activities in soils. C is the basis for the skeleton of organic matter and is essential for plant life, while N and P are important constituents of various proteins and genetic material [3]. The ecological stoichiometry of these elements reflects the structure and function of ecosystems [4, 5]. The study of soil and plant C, N, and P contents and stoichiometry can help reveal plant growth and development and nutrient uptake and utilization efficiency [6]. This better articulation of soil-plant nutrient dynamic balances and stoichiometric relationships is important for scientifically effective ecosystem restoration. Plants and soils are important components of the arsenic sandstone ecosystem, and the material cycle and energy flow processes between them play a key role in the stability of the ecosystem in the Pisha stone area. Soil is the carrier of plants, providing essential nutrients for plant growth, influencing the composition, stability, and succession of plant communities, and being the basis for plant growth. In turn, plants produce organic matter through photosynthesis and gradually return nutrients to the soil in the form of apoplastic matter [7]. Therefore, it is crucial to understand the plant-soil coupling relationship in the ecosystem and its influencing factors. The C, N, and P elements are the most important biogenic elements in organisms and participate in basic life processes such as plant energy transfer, information expression, and genetic variation [8]. C is an important substrate and energy substance for plant growth and participates in various physiological and biochemical processes in plants, while N and P are important nutrients for plants and key elements for cell composition and metabolism [9]. Plant C/N/P reflects the physiological metabolic status of plants and species competition at the community level, which in turn affects the balance of the ecosystem food chain structure. Ultimately, it affects the energy flow and material cycle of ecosystems [10].
The Pisha stone area is located in the junction zone of Shanxi-Shaanxi-Inner Mongolia in the northern part of the Loess Plateau, which has been subjected to multiple dynamic compound erosions for a long time and is a typical ecologically fragile area. Significant changes in the environment have resulted in corresponding adjustments in soil moisture dynamics and vegetation growth through complex land-atmosphere interactions. As a result, the process of evapotranspiration has been significantly affected [11]. Since the implementation of returning farmland to forest and grassland, vegetation coverage has increased, soil erosion has been significantly reduced, and the regional ecological environment has been significantly improved [12]. As one of the vegetation restoration measures on the Loess Plateau, the herbaceous plants grow rapidly and can increase the vegetation cover in a short time, effectively control soil erosion and soil loss, improve soil physical and chemical properties [13], and provide suitable high-nutrient forage for herders to improve their economic returns. In addition, the planting structure of the plant affects the horizontal distribution of water [14]. Alfalfa has been used as the main grass species for returning farmland to grass due to its high yield, high quality, strong resistance to drought and stress, and high protein content. The high-yielding period of alfalfa on the hilly loess plateau is from the 4th to the 5th year, and the suitable planting years are 10 years [15]. The alfalfa root system has strong nitrogen fixation. In semi-arid areas of China, alfalfa can fix about 270 kg·hm-2 of nitrogen in the soil in one year, which is equivalent to 825 kg of ammonium nitrate [16]. On the one hand, alfalfa rhizobia and a large number of fibrous roots effectively increase the input of soil surface apoplast and underground root residues and secretions, improve the physicochemical properties of the soil, and enhance soil fertility; on the other hand, good soil provides the material basis for the growth of surface vegetation. On the other hand, good soil provides the material basis for the growth of surface vegetation [17]. With the increase in planting years, the nutrient cycle interaction mechanisms between soil-vegetation nutrient distribution in the Pisha stone area have changed, which directly or indirectly affects the soil C, N, and P stoichiometric characteristics. It has been shown that Liu [18] determined and analyzed C, N, and P contents and their stoichiometric ratios in alfalfa leaves, stems, and soil at different ages (2 yr, 5 yr, and 7 yr). The results showed that alfalfa N/P showed an increasing trend with significant differences (P<0.05); 2 yr was P-limited, and 5 yr and 7 yr were N and P co-limited. Zhang [19] studied the ecological stoichiometric characteristics of Robinia pseudoacacia and Pinus tabulaeformis plantation ecosystems in a loess hilly region and concluded that there were different relationships between plant and soil nutrient characteristics at different levels. Wang [20] found that the contents of N and P in green leaves and dead leaves of alfalfa increased first and then decreased with the increase of the age of alfalfa, and the N/P decreased first and then increased with the increase of the age of alfalfa. Currently, studies on vegetation restoration in the Arsenic Sandstone Region mainly include the characteristics of vegetation restoration in different geomorphological zones and their influencing factors [21], the ecological stoichiometric characteristics of soil C, N, and P in different restoration years, and the ecological stoichiometric characteristics of plant C, N, and P in different planting years [18], whereas there are fewer studies on the characteristics and drivers of the ecological balance of plants and soil in the planting process of different soil horizons, which is detrimental to understanding vegetation restoration. This is not conducive to understanding the limiting factors of plant-soil nutrients and the driving mechanisms of ecosystem evolution during vegetation recovery. Therefore, in this study, we analyzed the differences and linkages between plant-soil C, N, and P contents and their stoichiometric characteristics in the arsenic sandstone area by setting alfalfa in different fallow years, and analyzed the correlation between plant C, N, and P contents and their stoichiometry with biomass and root-crown ratio by combining the redundancy analysis (RDA) method to reveal the coupling relationship between plant-soil C, N, and P ecological stoichiometry and its response mechanism to age, to further understand the balance mechanism of elemental cycling and energy flow in the ecosystem and the driving mechanism of ecosystem evolution, and provide support for regional ecological restoration.
Materials and Methods
Study Area
The study sites are located in the Erhuogou sub-basin (110°35′–110°37′E, 39°46′–39°48′N) within the Junger Banner, Inner Mongolia Autonomous Region. The area belongs to the mid-temperate continental monsoon climate, with an average annual temperature of about 8.8ºC, an average annual precipitation of about 400 mm, and a large average annual evaporation of about 2.7 times the average annual rainfall. The climate is characterized by long and cold winters, hot and short summers, and large temperature differences between day and night in spring and autumn. The annual rainfall is low and mostly concentrated from June to August. The study area belongs to the overburdened Pisha stone area; the overburden thickness is about 90 cm, and the main soil types are chestnut calcium soil, wind-sand soil, and yellow cotton soil. The main vegetation types are lemongrass, alfalfa, oil pine, sand willow, and so on [22, 23].
Experimental Design and Sampling
The sample sites were selected by reviewing alfalfa-related literature, visiting relevant departments, and speaking with local farmers to identify cultivated alfalfa fields with different growth years, taking into account the elevation, slope, and basic soil conditions that are relatively close to each other, and selecting suitable sample sites to ensure good comparability among the sample sites. Four alfalfa plots with different restoration years (2, 5, 8, and 10 yr) were selected, and the details of the plots are shown in Table 1. At the end of June 2021 (the first crop of alfalfa in full bloom), 10 sample squares (1 m × 1 m) were randomly selected in each sample plot using the S-shaped sampling method, mowed alfalfa in the sample squares, weighed, brought back to the laboratory, killed in an oven at 105ºC for 20 min, then baked at 65°C to a constant weight, and weighed the above-ground biomass. The roots in 0-180 cm of soil were also collected using a root auger (10 cm in diameter), and then the samples were brought back to the laboratory, washed with water, killed in an oven at 105ºC for 20 min, and then baked at 65ºC to a constant weight and weighed for belowground biomass. Aboveground biomass plus below-ground biomass was the total biomass, and the ratio of below-ground biomass to above-ground biomass was the root-to-crown ratio. The loess layer (LL) of 0~90 cm and the arsenic sandstone layer (PSL) of 90~180 cm were sampled in 20 cm layers, and 80~100 cm of soil was removed. All soil samples from each sample point of each layer were mixed into one mixed sample and transported back to the laboratory in soil sample bags, and the samples were naturally dried for soil physical and chemical property determination. Soil and plant C contents were determined by the H2SO4-KCr2O7 external heating method; soil and plant N content was determined by the semi-micro Kjeldahl method; soil total phosphorus (TP) content was determined by the sodium hydroxide fusion-molybdenum antimony anti-colorimetric method; and the content of plant P was determined by H2SO4-H2O2 solution digestion and the vanadium-molybdenum yellow colorimetric method. Soil PH was measured using a PH meter, and soil bulk weight was determined using the ring knife method.
Statistical Analysis
In this study, elemental mass content was used for soil-plant carbon, nitrogen, and phosphorus, and elemental mass ratios were used for C/N, C/P, and N/P. Basic descriptive statistics of soil-alfalfa C, N, P, and stoichiometry were performed using Excel 2020; one-way ANOVA, as well as the least significant test method, were used to test the differences between alfalfa and soil C, N, and P contents and their stoichiometric ratios in different restoration years using IBM SPSS Statistics 26 and the Pearson Correlation coefficient method for correlation analysis; redundancy analysis of the relationship between plant soil chemometric characteristics and plant biomass was performed using CANOCO 5.0; graphs were drawn using Origin 2021.
Results
Alfalfa Biomass
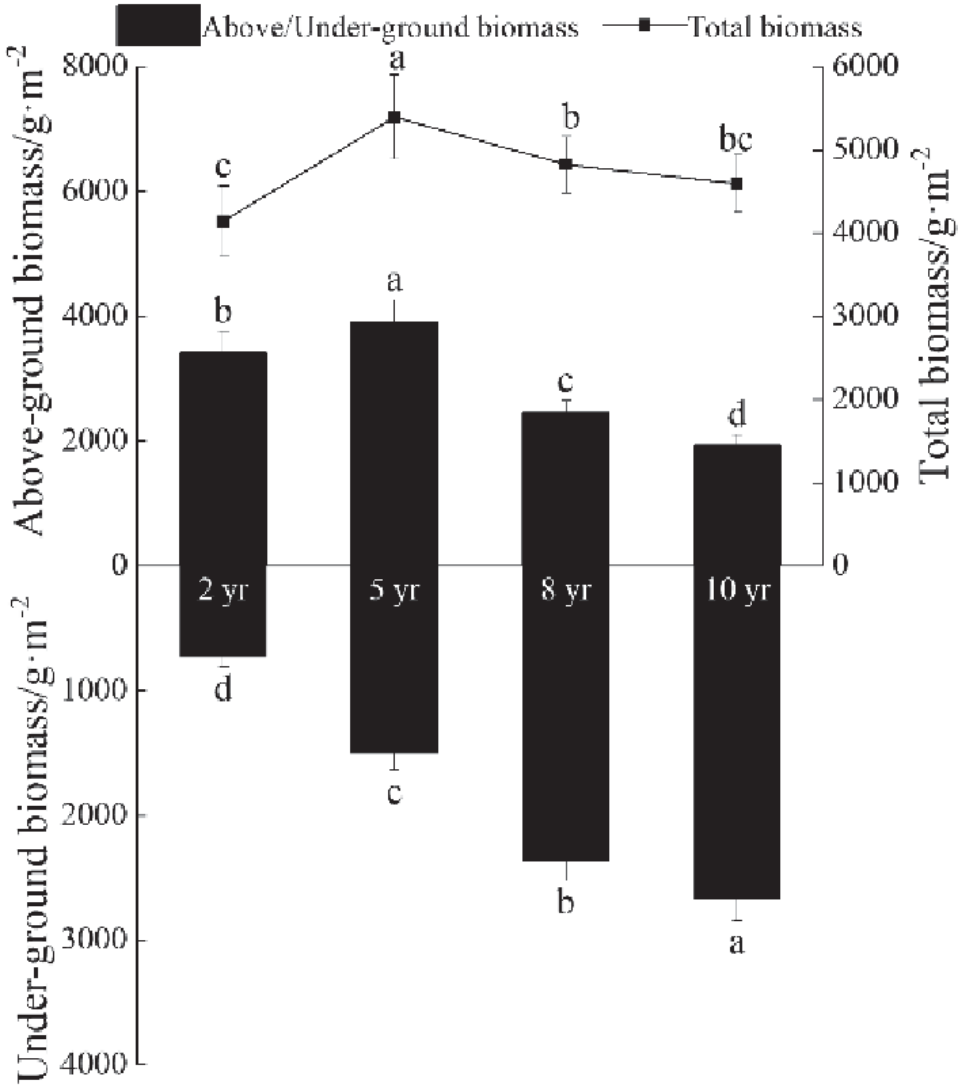
The total biomass of alfalfa increased and then decreased with increasing planting years, and the highest total biomass was 5395.74 g·m-2 at 5 yr of planting, with an increase of 30.25% at 5 yr of planting compared to 2 yr of planting (Fig. 1). Aboveground biomass and total biomass of alfalfa showed similar trends, with the highest at 3895.75 g·m-2 at planting 5 yr, and decreased by 36.94% and 50.63% at planting 8 yr and 10 yr, respectively, compared to planting 5 yr. The belowground biomass of alfalfa increased with increasing planting years, with planting 2 yr significantly lower than planting 5 yr, 8 yr, and 10 yr at 732 g·m-2, and increasing by 104.92%, 223.36%, and 264.75% in planting 5 yr, 8 yr, and 10 yr, respectively, compared to planting 2 yr.
Changes in Soil Nutrient Contents and Stoichiometric Ratios with Different Planting Years
The variability of soil nutrient contents and stoichiometric ratios in different soil layers varied with planting years (Fig. 2). In the LL, the trend of SOC and TN increased first and then decreased with the increase of planting years, reaching the maximum values of 2.61 g-kg-1 and 0.16 g-kg-1 at 5 yr, respectively. However, the trend of TP was the opposite, reaching the minimum value of 0.10 g-kg-1 at 8 yr. There were significant differences. C/N, C/P, and N/P showed increasing and then decreasing trends with the increase of planting years, and all reached the maximum value at 8 yr, 16.93, 26.10, and 1.54, respectively; C/N did not change significantly during the planting period, and C/P and N/P did not differ significantly at 5 yr and 8 yr, 2 a and 10 yr, respectively. In the PSL, SOC, and C/P showed an increasing trend with the increase in planting years, with no significant difference at 5 yr and 8 yr, and the maximum values were 2.01 g-kg-1 and 27.54, respectively. TN and N/P showed the same trend; both achieved the maximum value at 8 yr, with 0.08 g-kg-1 and 1.09, respectively, and no significant difference at 2 yr, 5 yr, and 10 yr. The trend of TP was the opposite of SOC, which achieved the maximum value at 2 yr, and there were no significant differences at 5 yr, 8 yr, or 10 yr. The trends of C/N and TP changes in the LL were similar. Compared with the PSL, the significant differences in soil nutrient contents and stoichiometric ratios were more obvious in the LL.
Table 1.
General status of sampling sites.
SOC, TN, and C/N, C/P, N/P in the LL showed a trend of increasing first and then decreasing with the increase of planting years, and there were significant differences, while SOC, TN, and C/P, N/P in the PSL showed a trend of increasing first and then decreasing or continuously increasing. This indicates that soil nutrients in different depth layers showed different changes with the increase of planting years.
Changes in Nutrient Content and Stoichiometric Ratios in Alfalfa Leaves with Different Planting Years
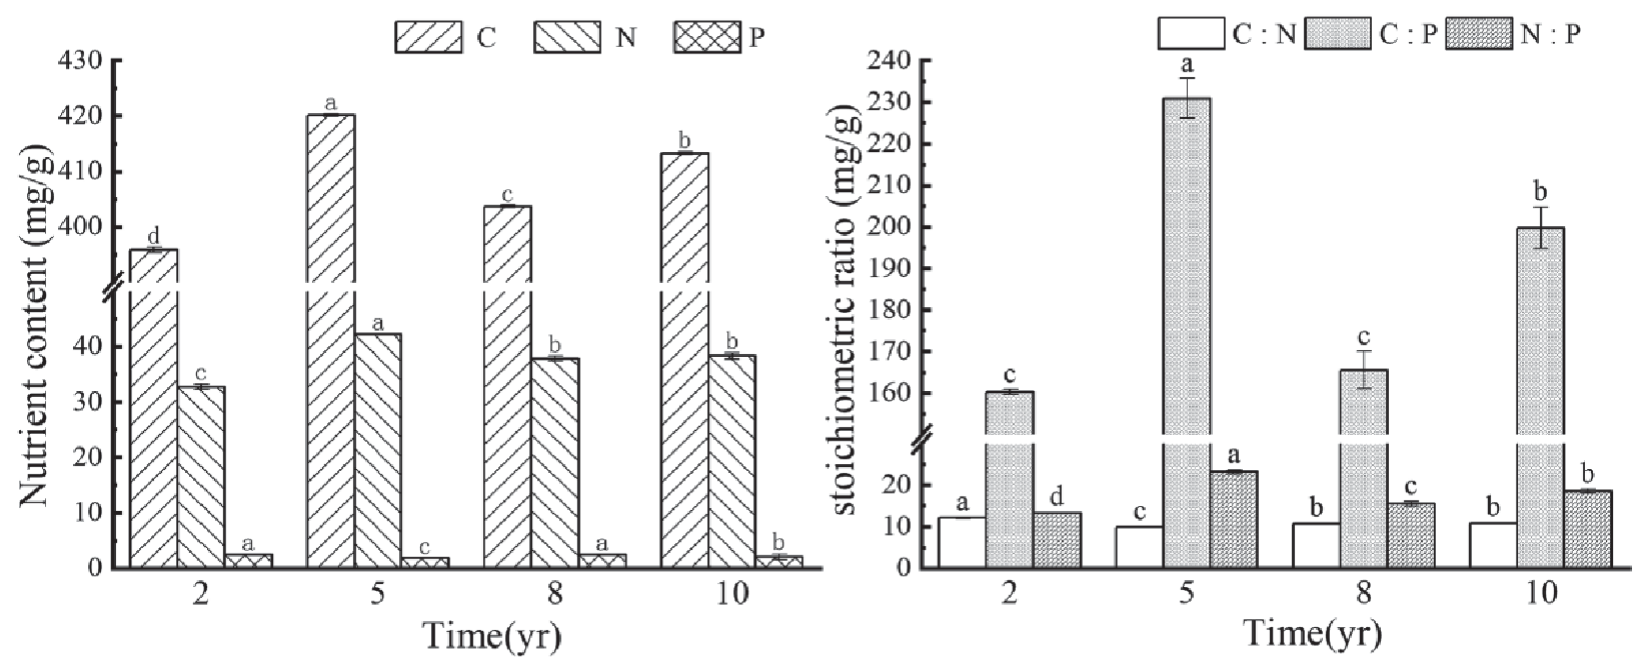
The changes in nutrient contents and stoichiometric ratios in alfalfa leaves with planting years are shown in Fig. 3. The results showed that the nutrient contents and stoichiometric ratios in alfalfa leaves showed different patterns of change with the increase in planting years. The trend of C and N content of alfalfa leaves fluctuated with the increase in planting years, and the contents were 395.85-420.18 g·kg-1 and 32.74-42.15 g·kg-1, respectively, with the maximum value at 5 yr. While the variation trend of P content was the opposite, ranging from 1.82 to 2.47 g·kg-1, which was attributed to the lack of additional C accumulation in alfalfa leaves due to mowing, as well as the large amount of soil nutrients consumed by alfalfa growth and development during the early planting period; except the N content of alfalfa leaves had no significant difference between 8 yr and 10 yr, and the P content, which had no significant difference between 2 yr and 8 yr, all others had significant differences. The trends of C/N in alfalfa leaves were the same as those of P, with a maximum value of 12.09 at 2 yr. The trends of C/P and N/P were the same as those of SOC and TN, achieving maximum values of 230.95 and 23.17 at 5 yr, both of which were significantly different.
Correlation of Alfalfa with Soil C, N, and P
The correlation analysis between alfalfa and soil C, N, and P at different years of planting is shown in Table 2. The results showed that: at 2 yr, only the LL SOC was significantly negatively correlated with alfalfa C (P<0.05); at 5 yr, the LL SOC and TN were significantly negatively correlated with alfalfa C and N (P<0.05) and significantly positively correlated with alfalfa P (P<0.05). When the planting period was 8 yr, the SOC and TN of PSL showed a highly significant positive correlation (P<0.01) with alfalfa C, and the TN showed a significant negative correlation (P<0.05) with alfalfa N. When the planting period was 10 yr, TN was significantly negatively correlated with alfalfa N in the PSL (P<0.05). Compared with the PSL, the correlation between soil and alfalfa C and N was higher in the LL at 2 yr and 5 yr, and the correlation between soil and alfalfa C and N was higher in the PSL at 8 yr and 10 yr.
Correlation between Alfalfa and Soil Stoichiometric Ratio
The correlation analysis between alfalfa and soil C/N, C/P, and N/P in different planting years is shown in Table 3. In the LL, alfalfa C/N was significantly and positively correlated with soil C/P and soil N/P (P<0.05), and alfalfa C/P and N/P were significantly and negatively correlated with soil C/P and soil N/P (P<0.05) at 5 yr. In the PSL, alfalfa C/N was significantly positively correlated with soil C/P and soil N/P at 8 yr (P<0.05) and highly significantly positively correlated with soil N/P (P<0.01), respectively; when the planting period was 10 yr, alfalfa C/N was significantly positively correlated with soil N/P (P<0.05).
Relationship between Stoichiometric Characteristics of Alfalfa and Soil Physical and Chemical Properties
Pearson correlation analysis showed (Fig. 4) that LL soil moisture was significantly negatively correlated with soil SOC, TN, C/N, C/P, and N/P (P<0.05) and significantly positively correlated with alfalfa N/P (P<0.05) when planted for 2 yr, and PSL soil moisture was significantly positively correlated with soil TP (P<0.05) and significantly negatively correlated with soil C/P (P<0.05). When planted for 5 yr, LL soil moisture was significantly (P<0.05) negatively correlated with soil TN, C/P, N/P, and alfalfa TP, C/N, and significantly (P<0.05) positively (P<0.05) correlated with soil TP and alfalfa SOC, TN, C/P, and N/P. PSL soil moisture was significantly (P<0.05) negatively (P<0.05) correlated with soil SOC, C/P. When the planting year was 8 yr, LL soil moisture was significantly negatively correlated (P<0.05) with soil C/P; PSL soil moisture was significantly negatively correlated (P<0.05) with soil TN; it was highly negatively correlated (P<0.01) with soil SOC; and it was significantly positively correlated (P<0.01) with alfalfa SOC. When the planting year was 10 yr, only PSL soil moisture was significantly positively correlated (P<0.05) with soil TP.
Fig. 2.
Stoichiometric characteristics of soil C, N, and P in different planting years (mean±SE). Different letters on the error bars indicate significant differences between different planting years soils at P<0.05 level. LL, loess layer; PSL, Pisha sandstone layer; SOC, soil organic carbon; TN, total nitrogen; TP, total phosphorus.
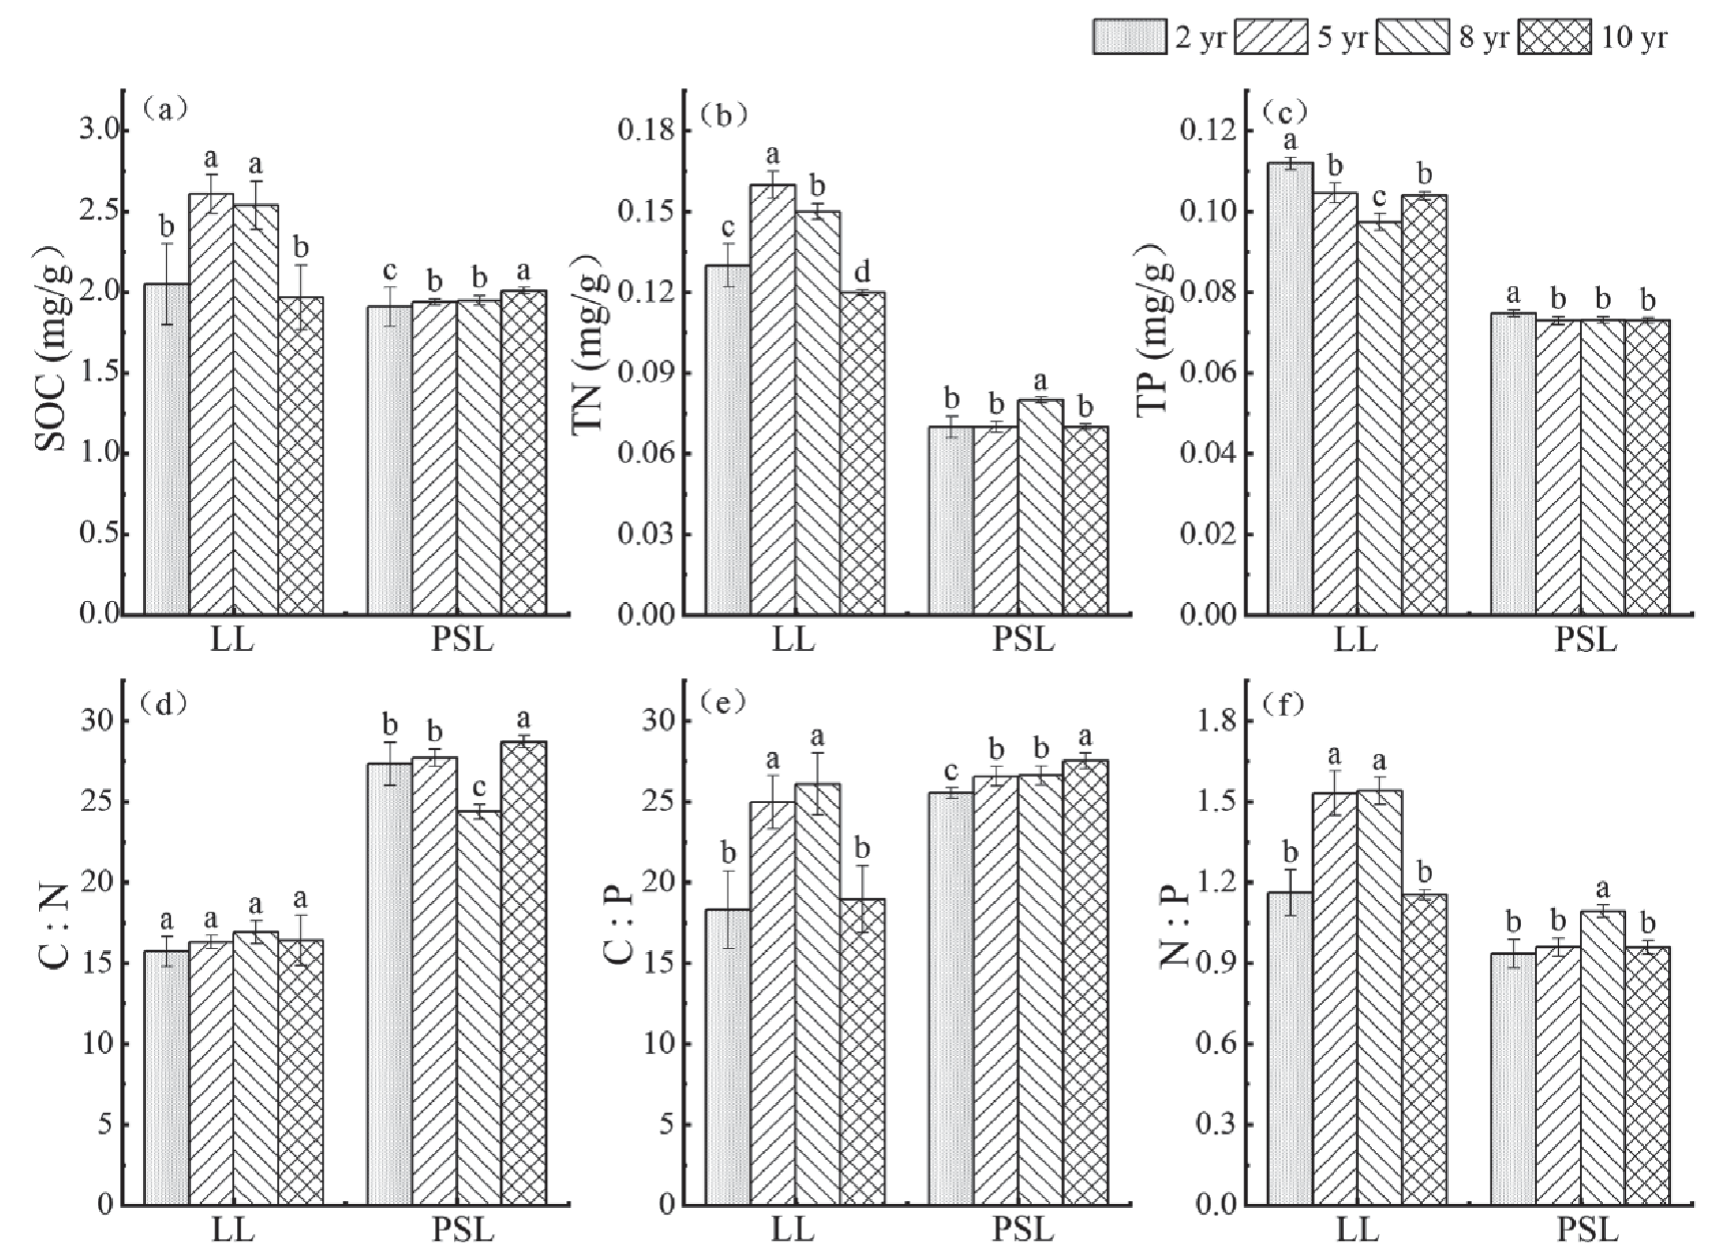
Fig. 3.
Stoichiometric characteristics of alfalfa's C, N, and P in different planting years (mean±SE). Different letters on the error bars indicate significant differences between different planting years soils at P<0.05 level.
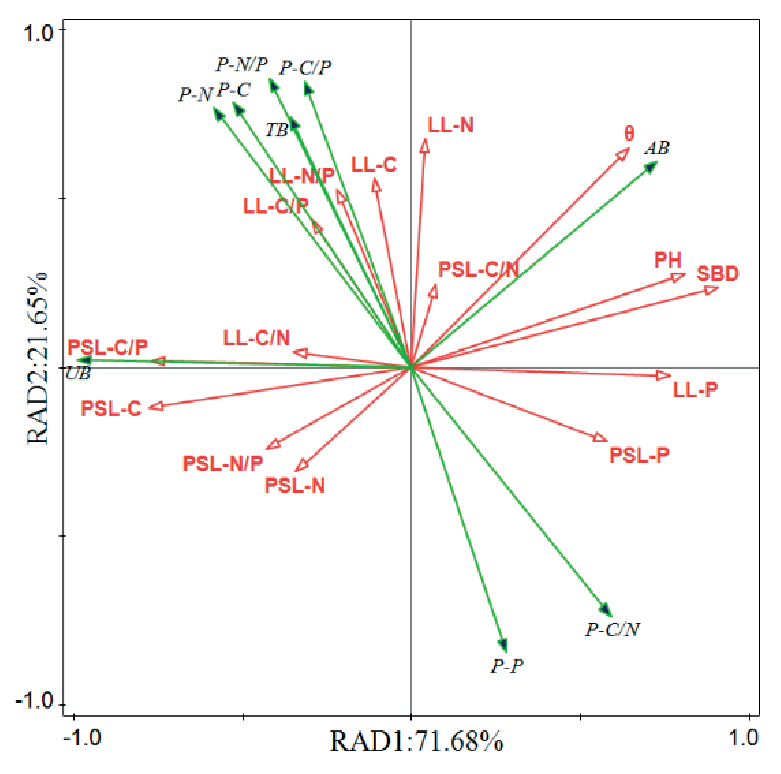
Redundancy analysis of soil and plant C, N, and P contents and stoichiometric characteristics with plant biomass was used to demonstrate their close association with 71.68% and 21.65% explained by axes 1 and 2, respectively (Fig 5). The analysis showed that the belowground biomass, total biomass, plant C, plant N, plant C/P, and plant N/P of alfalfa were significantly and positively correlated with loess layer C, loess layer N, loess layer C/P, loess layer N/P, loess layer C/N, and arsenic sandstone layer C/P, while they were significantly and negatively correlated with loess layer P and arsenic sandstone layer P. And plant P, plant C/N, and aboveground biomass had opposite results with them. Plant above-ground biomass was significantly and positively correlated with soil moisture, soil pH, and soil bulk density.
Discussion
C/N/P Characteristics of Soil and Alfalfa
Soil chemometric characteristics are important indicators for assessing soil quality and can predict trends in nutrient cycling in terrestrial ecosystems [24, 25]. Vegetation restoration can significantly improve soil quality and promote soil carbon, nitrogen, and phosphorus cycling [26]. The results of this study showed that the SOC of the LL tended to increase and then decrease with the increase in planting years and reached its highest level at 5 yr. The TN content of the LL had the same trend as the SOC content [27], and the slope and soil texture had a significant effect on the SOC and TN content. SOC content changes are mainly influenced by the accumulation, mineralization, decomposition, and transformation of vegetation litter [28]. Soil TN content is mainly affected by climate and moisture, as well as transformation processes such as mineralization decomposition and nitrogen fixation, nitrification, and denitrification of nitrogen [29]. Meanwhile, alfalfa has a low nitrogen fixation capacity at the early stage of growth and consumes a large number of nutrients for growth and development. With the increase in planting years, a large number of rhizobia were formed on the roots of alfalfa, and the efficiency of nitrogen fixation was enhanced. But with the increase in planting years, alfalfa grows slowly, the cover decreases, and the litter decreases, which is not conducive to the accumulation of soil nutrients [30, 31]. The N and P contents of the soil in the LL layer were significantly higher than those in the PSL because a large number of alfalfa roots were distributed in the LL, and most of the leached nutrients were returned to the LL by the residual roots of the new and old alfalfa root systems, humus and root nitrogen fixation, and decomposition of the aboveground apomictic material. The TP content of the LL soil was 0.10 g kg-1, significantly lower than the global average (2.8 g kg-1), which is consistent with the study that soil P content in China is lower than the global average [32]. Soil P is a sedimentary element, so the distribution of TP is relatively uniform throughout the soil space, which is the same pattern as previous studies [33, 34]. PSL soils without many roots in the early planting stage had a significant increase in SOC content, which is similar to Li [35]. The planting of grasses was able to affect the changes in SOC, TN, and TP content not only in the LL but also in the PSL. The results of this study are consistent with Wang [36]. C/N, C/P, and N/P stoichiometric ratios are important indicators of soil recovery [37]. The soil solid phase and soil nitrogen mineralization capacity are influenced by the balance between soil C and N, which is reflected in soil C/N. Soil nutrients are important sources of plant nutrients and affect plant growth [37, 38]. The results of this study showed that the C/N values of the LL and PSL are 16.35 and 27.04, respectively, which are greater than the global average value of 13.33, indicating that the decomposition rate of organic matter in the PSL was slower. Although there is a large spatial and temporal variability of soil C and N elements, the soil C/N values remain relatively stable, reflecting their close correlation as structural components [37]. Soil C/P is an important indicator of the potential of microbial mineralization of soil organic matter to release or sequester P from the environment, and lower C/P values indicate higher effectiveness of P elements [39, 40]. The lower the C/P value, the higher the P effectiveness. Soil C/P of alfalfa LL at different planting years showed a trend of 8 yr (26.10)>5 yr (24.98)>10 yr (18.95)>2 yr (18.33), while the C/P value of PSL soil (26.58) was less variable. This indicates that microbial decomposition is less restricted by P and soil P has higher effectiveness, and the effectiveness of soil P in the PSL is higher. Soil N/P is one of the important indicators to determine the current limiting effect of N and P and is used to determine the threshold of nutrient limitation [41]. In this study, the mean values of soil N/P in the LL and the PSL were 1.35 and 0.99, respectively, and the maximum values appeared at 8 yr, it is much lower than the global average level of soil N/P in different ecosystems (13) [42] and the national average level of soil N/P (9.3) [43]. Due to the ability of alfalfa roots to produce rhizobia for biological nitrogen fixation, the soil N content increased with planting years and during a certain growth period, while the soil P source was more homogeneous and evenly distributed in the soil, and the soil N/P value of alfalfa meadow was maximum at 8 yr.
Table 2.
Correlation analysis of soil and alfalfa for C, N, and P contents in different planting years.
Table 3.
Correlation analysis of soil and alfalfa for stoichiometric ratios in different planting years.
Fig. 4.
Correlation between soil-clover stoichiometric characteristics and soil water content. Note: W1: Loess layer; W2: PSL; θ: soil moisture content; SOC: soil organic carbon; TN: total nitrogen; TP: total phosphorus; ** indicates a highly significant correlation at the 0.01 level (bilateral); * shows a significant correlation at the 0.05 level (bilateral).
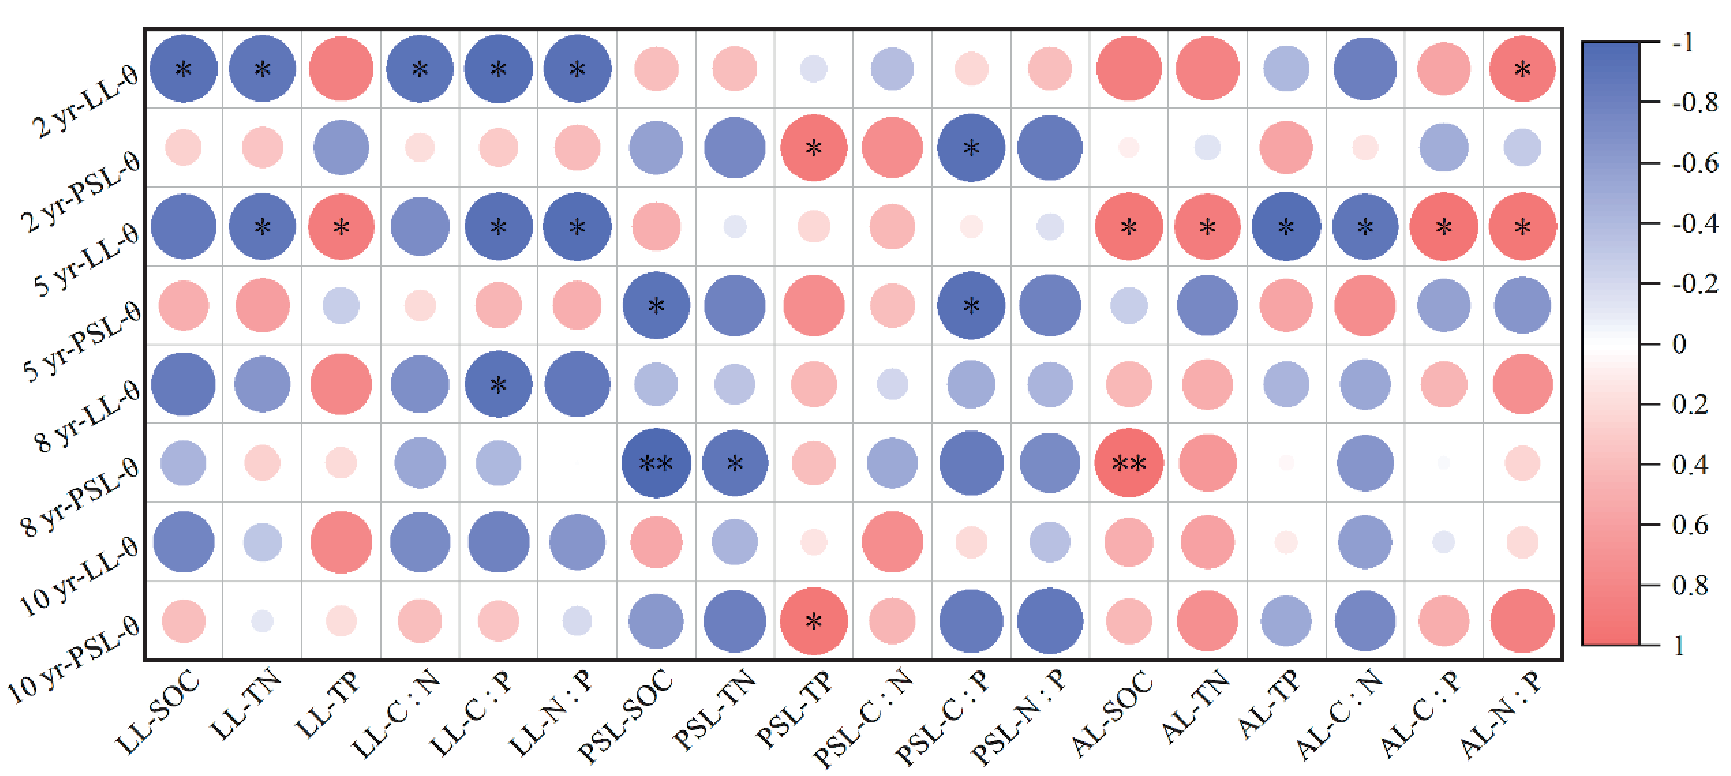
Fig. 5.
Redundant analysis of C, N, and P contents, their ratios, and bulk density of soil with the biomass and stoichiometric characteristics of alfalfa. LL, loess layer; PSL, Pisha sandstone layer; P, Plant; AB, Above-ground biomass; UB, Under-ground biomass; TB, Total biomass.
The C, N, and P contents of alfalfa leaves were highly dependent on the planting years, and leaf nutrient contents increased at a certain growth rate with the increase of planting years [18]. The average contents of C, N, and P in alfalfa at different planting years (408.25 g·kg-1, 37.75 g·kg-1, 2.20 g·kg-1) were lower than the global average contents of C (436.80 g·kg-1) in terrestrial plant leaves and higher than N and P (14.14 g·kg-1 and 1.11 g·kg-1) [44]. It indicates that alfalfa has a low utilization efficiency of nutrients. The reason may be that the study area is located in a soft sandstone area with harsh climatic conditions, the plant grows slowly, and the N, P metabolic activity and content in the body decreases after the growth rate decreases with the increase of planting years. At the same time, its lower demand for N will lead to an increase in soil N accumulation, coupled with the biological nitrogen fixation capacity of legumes, which makes the dependence of alfalfa on soil N decrease year by year, and causes the different trends of alfalfa TN and soil TN. C and N of alfalfa leaves increased first and then decreased with the increase in planting years, reaching their maximum value when the planting period was 5 yr. Due to the excessive artificial N fertilizer accumulated in the farmland before returning cropland to grass, which could not be consumed in a short time, the loss of artificial N fertilizer was greater than that fixed by perennial alfalfa, and due to the imbalance between N fixation and loss, the TN content showed a trend of decreasing first, then increasing, and finally decreasing [45]. Wang [20] found that the N content of green and dead leaves of alfalfa tended to increase first and then decrease with the increase in planting years, which was consistent with the results of this study. With the mowing of alfalfa aboveground biomass, it took away soil P year by year, and the single source of P could not be effectively replenished, so the P content available to alfalfa would be reduced, so alfalfa TP was significantly and positively correlated with soil TP. Previous studies found that the P content of alfalfa tended to increase first and then decrease with the increase of planting years [20, 46], which was inconsistent with the results of this study and was attributed to factors such as a special geographical environment, climatic conditions, or different varieties in different study areas, resulting in some differences in the nutrient content of alfalfa with increasing planting years. Zhao [47] found that the P content of alfalfa stems tended to increase and then decrease with increasing reclamation time, which is consistent with the results of this study.
C/N, C/P, and N/P of alfalfa leaves were greatly influenced by planting years, but there was no unidirectional change trend with the increase in planting years [48]. In this study, C/N of alfalfa leaves showed a trend of decreasing first and then increasing with the increase of planting years, and C/P and N/P of alfalfa leaves showed a trend of increasing, then decreasing, and finally increasing with the increase of planting years. The C/N and C/P of alfalfa leaves can be used to reflect the nutrient utilization efficiency and growth status of plants [49]. Alfalfa is a perennial forage, and unlike tree C accumulation, frequent removal of above-ground shoots leads to large amounts of N and P migration out of the grass ecosystem. Due to alfalfa leaves always regrowing out, SOC content remains almost constant in alfalfa across planting years, and the main factors affecting C/N and C/P values are N and P. As a legume, the alfalfa root system has strong rhizosphere nitrogen fixation, and its nitrogen fixation capacity varies at different years, resulting in different leaf N contents at different planting years [50]. In this study, the N content of alfalfa leaves varied with the planting year. In this study, the N content tended to increase first, then decrease, and finally increase with the increase of planting years, and the P content tended to change in the opposite direction to N. This explains why the C/N of alfalfa leaves tended to decrease first and then increase with the increase in planting years, and the C/P tended to increase first and then decrease. Plant leaf N/P is usually used as an important index of plant N and P elemental limitation, and Koerselman [51] pointed out that at the N/P threshold, when N/P<14, plant growth is mainly limited by N elements; when N/ P>16, it is mainly limited by P elements. The combined N/P analysis of alfalfa in different planting years judged that the growth of alfalfa in this study was mainly limited by P elements, which is consistent with the results of many studies showing low P content in plant leaves [52].
Correlation of Soil and Alfalfa Stoichiometric Characteristics
The variation in soil nutrient content is mainly related to the litter and roots produced by vegetation. The surface soil nutrients are mainly affected by litter and plant roots, while the deep soil is mainly affected by plant roots. The root system of alfalfa is very developed, with thick and obvious main roots and well-developed lateral roots up to a maximum depth of 5 m [53]. In this study, it was found that the correlation between soil nutrients from different soil layers and alfalfa nutrients at different scales was different with increasing planting years. At large scales, alfalfa C and N were significantly negatively correlated with soil SOC and soil TN, and alfalfa C/N was significantly positively correlated with soil C/P and soil N/P. Cui [54] proposed that increasing N concentration in the soil would increase N concentration in leaves, which would reduce plant C/N and increase N/P; increasing N deposition would increase N content in plant tissues and decrease C/N. At small scales, the LL soil was significantly correlated with alfalfa leaves in the early planting period (2 yr, 5 yr), while the PSL soil was not significantly correlated with alfalfa leaves, which was attributed to the fact that alfalfa nutrients mainly came from the shallow soil LL in the early planting period and did not take up many nutrients from the deeper soil. In the late planting period (8 yr, 10 yr), there was a significant correlation between the soil of PSL and alfalfa leaves. Some studies showed that plant P content was significantly and positively correlated with soil TP content [55]. However, this is not consistent with the results of this study, which are mainly due to the low soil P content in the Pisha stone area and the low utilization of P by alfalfa leaves. The magnitude of the correlation between soil nutrients and alfalfa changed with the increase in planting years, which indicated that the change patterns of stoichiometric characteristics of soil and alfalfa in different planting years were not synchronized and the relationship between them was not simply linear, probably due to the decomposition of plant root organic chemicals by Pisha stone soil with the increase in planting years.
Interaction of Alfalfa Biomass Allocation and Stoichiometric Ratio Characteristics
The elements N and P are mainly influenced by the year of cultivation and other abiotic factors and are actively involved in various metabolic reactions in the plant [56, 57]. N/P can reflect plant growth rate, and plants need to synthesize phosphorus compounds for rapid growth [58], so plants with higher growth rates have lower N/P [59]. In this study, we found that alfalfa had a high soil P content, a high growth rate, the highest aboveground biomass, and a steady increase in belowground biomass when it was planted before 5 yr (Fig 1). With the increase in alfalfa planting years, the overall trend of N/P increased, at which time the nitrogen fixation by rhizobia stabilized and the N elemental limitation was lifted, which was consistent with the results of Zhang [57]. The N/P content of alfalfa was 13.25 at 2 yr of planting, indicating that its growth was N-limited because of the high growth of the aboveground part of alfalfa in the preplanning period and the high demand for N, which stimulated plant root growth. The N/P of alfalfa plants was 23.17, 16.23, and 18.50 at 5-10 yr of planting, which was P-limited, and the limited P supply and strong P demand stimulated plant root growth, making PSL and LL P significantly and positively correlated with plant P. Also, because alfalfa is a perennial forage grass, the aboveground part is periodically mown and harvested [60], while the belowground part is accumulated for many years, leading to a decrease in aboveground biomass and an increase in belowground biomass with increasing planting years. Alfalfa responded to the increasingly severe P limitation by increasing belowground biomass, and deep soil PSL at 5-10 yr of planting also affected plant growth.
Conclusion
The aboveground biomass of alfalfa decreased with increasing planting years, and the belowground biomass and total biomass increased with increasing planting years. The consistency of SOC and TN changes and the stability of TP changes in the LL led to the consistency of C/N and C/P changes in the LL at different planting years. The stability of soil nutrients in the PSL led to the stabilization of ecological stoichiometric ratios in different planting years. The nutrient content of alfalfa leaves was lower at 2 yr and higher at 5 yr. Alfalfa planted for 2 yr is N-limited; planted for 2 yr alfalfa photosynthesizes as it grows, increasing aboveground biomass and belowground biomass to lift N-limitation. Belowground biomass increases, rhizobia perform nitrogen fixation, and N-limitation is lifted. In planting 5-10 yr alfalfa growth turns to P limitation and stimulates plant root growth to obtain P from PSL, which is self-regulating for nutrients and promotes a virtuous cycle of nutrients in the plant-soil system. Thus, changes in soil-plant ecological stoichiometry characteristics with planting years provide a basis for studying the growth and succession of alfalfa during planting for grass restoration.

