

Introduction
Ecosystem services (ESs) are the benefits that people derive from ecosystems [1], These services encompass provisional, regulatory, and cultural services, as well as supporting services that sustain the functioning of the other three categories. It is important to note that ESs directly impact human well-being [2]. People often over-pursue or consume one or several types of these services, but ESs are not independent and may have a highly nonlinear relationship; thus, they may lead to declines in some regulating services. Trade-offs are generally defined as situations in which one ES increases at the cost of another ES. For example, forests enhance carbon sequestration, but evapotranspiration reduces water availability [3]. Synergies are the opposite of trade-offs, and they are defined as situations in which both services either increase or decrease [4]. Coordinating the trade-off relationship between ESs poses a significant challenge in scientific research on ecosystem services. It is crucial to understand the complex interactions and dynamics of ESs to ensure the sustainable management and preservation of ecosystems that provide these valuable services. Arid and semiarid regions cover approximately one-third of the Earth’s land surface [5], face significant challenges due to limited water resources, which constrain the productivity and sustainability of ecosystems in these areas [6]. In recent years, the climate has experienced major changes due to global warming. The increase in air temperature affects vegetation productivity and leads to carbon storage reduction in the ecosystem [7, 8]. Concurrently, global warming has intensified evaporation, leading to accelerated soil moisture depletion. Insufficient water resources make it difficult for primary producers to survive, consequently compromising their ability to provide essential ecological services to humans [9]. When vegetation construction is undertaken haphazardly in arid and semiarid regions without considering water resource protection, it not only causes severe damage to the ecological environment, particularly through the reduction of soil moisture, but also results in substantial economic losses. The Loess Plateau, located in northwestern China, stands out as a critically affected area by soil and water loss disasters, with distinctive soil and ecosystem characteristics contributing to soil moisture depletion [10]. At the same time, the transpiration loss is greater than the total precipitation over the Loess Plateau, and soil moisture plays an important role in biomass allocation [11]. Therefore, under the premise of global warming, it is necessary to study the balance between soil moisture and vegetation development in arid and semiarid areas, such as the Loess Plateau.
In recent years, trade-off analysis has gradually become a research focus. Previous studies have explored four types of ESs (provisional, regulatory, cultural and supporting services) [12-14] and subtypes within specific types, such as freshwater and food supply [15]. Previous studies have shown that trade-off analysis is a key issue for planning, management, and decision-making within ESs [16, 17]. Trade-off analysis has been used to coordinate various areas of ESs, including agricultural [18] and ecological restoration [19], and has also been applied to various geographical features, such as wetlands [20] and mountains [19]. Therefore, trade-off analysis may be the key method to guide water resource consumption on the Loess Plateau of China.
This paper studies the relationship between soil moisture and vegetation development in cultivated land, forest and grassland on the Loess Plateau. We first assume that the NDVI, root-zone soil moisture (SMR) and surface soil moisture (SMS) are strongly affected by meteorological factors and topographic factors and then assume that there is a trade-off between the NDVI and soil moisture. The purpose of this study is to (1) investigate the effects of meteorological and topographic factors on the NDVI, SMR and SMS;
(2) discuss the relative benefits of vegetation development and actual evapotranspiration on soil moisture; and (3) To investigate the relationship between vegetation development and soil moisture in different periods on the Loess Plateau is our objective. The clarification and revelation of the connection between soil moisture and the Normalized Difference Vegetation Index (NDVI) in different vegetation types during various periods hold paramount importance for achieving sustainable ecosystem development in arid and semiarid regions, specifically in the case of the Loess Plateau.
Materials and Methods
Study Area
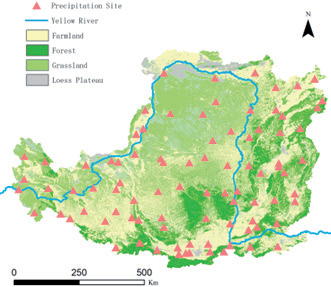
The Loess Plateau is located in northwestern China (33º41’-41º16’N, 100º52‘-114º33’E), covers an area of approximately 640000 km2, and has altitudes of 200-3000 m and an average altitude of 1400 m (Fig. 1). The Loess Plateau is located on the Ordos block, which is relatively stable and rigid. The climate is heavily influenced by monsoons. Precipitation decreases from southeast to northwest; the highest annual precipitation is 800 mm, and the lowest annual precipitation is 150 mm. The annual potential evaporation exceeds 1000 mm. The average annual temperature is 3.6ºC in the northwest, 14.3ºC in the southeast, and 10.1ºC overall. The vegetation distribution, which correlates with precipitation, shows obvious zonal characteristics; most of the forestland is located in the southern region, and grassland is located in the northwestern region and has less precipitation. However, due to the fragile ecological environment and human-made destruction of the Loess Plateau, most of the natural vegetation has been destroyed, resulting in severe soil erosion and land degradation. Since the 1950s, the Chinese government has adopted a series of policies to control soil erosion, including building warping dams (sediment storage dams for building farmland), planting trees and building terraces. One of the most successful policies is that of returning farmland to forest and grassland, which was implemented in 1999. After the implementation of this policy, the vegetation coverage on the Loess Plateau increased from 31.6% in 1999 to 61.4% in 2020.
Data Source
Data in this study include soil moisture, actual evapotranspiration, vegetation development (NDVI), meteorological (annual precipitation and average annual temperature), and topographic (altitude, slope direction, and slope gradient) data. Among them, soil moisture and actual evapotranspiration data are derived from the Global Land Evaporation Amsterdam Model (GLEAM, https://www.gleam.eu/), which is a set of algorithms that separately estimate the different components of terrestrial evaporation (i.e., ‘evapotranspiration’) based on satellite observations: transpiration (Et), interception loss (Ei), bare soil evaporation (Eb), snow sublimation (Es) and open-water evaporation (Ew). Intermediate outputs of the model include potential evaporation (Ep), root-zone soil moisture (SMR), surface soil moisture (SMS), and evaporative stress (S) (Fig. 2). To date, the data have been validated in Australia [20], verifying the applicability of the data for the Loess Plateau [21]. NDVI data come from Moderate Resolution Imaging Spectro radiometer (MODIS) satellite remote sensing data and are obtained by the maximum synthesis method. The meteorological data are collected from meteorological stations in China. Terrain data are derived from the Shuttle Radar Topography Mission (SRTM) (http://gdex. cr.usgs.gov/gdex/) and have a resolution of 30 m.
Calculation of ES Trade-offs
The benefit of a single ecosystem service can be defined as the relative deviation between the observed value and the draw value. The overall benefit is estimated by calculating the mean value of the individual benefit and weighted according to the benefits of all ESs. In this study, all ESs are considered equally important [22].
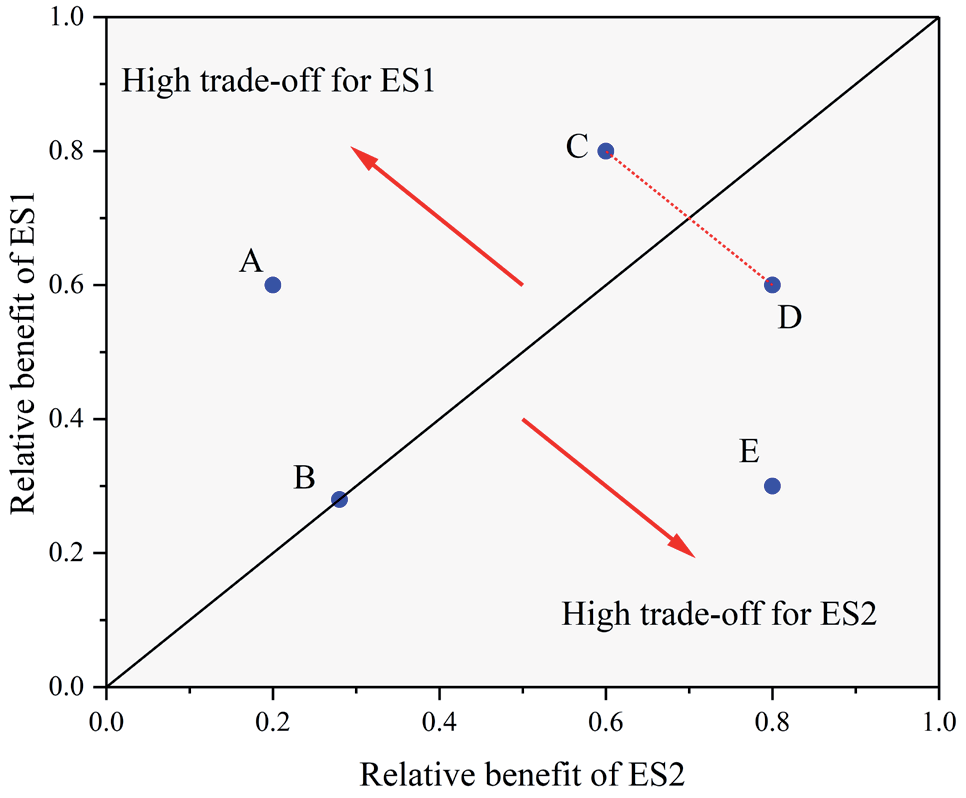
A simple and effective way to quantify the trade-off between two or more ESs is to calculate the root mean squared deviation (RMSD) of the individual Ess [23]. In two dimensions, the RMSD represents the trade-off distances of the two sets of ESs from the 1:1 line, and the position of the trade-off relative to the 1:1 line represents which ES is more favorable. This representation extends the trade-off from a negative correlation to include the heterogeneous ratio of ESs changes in the same direction [24].
Calculating the root mean squared error (RMSE) aims to eliminate the dimensionality relationship of ESs. First, the ES must be standardized so that the data can be compared without changing the correlation between the data. Standardized ESs or relative benefits of ESs are defined as [25]:
Where ESstd is the standardized value of any ES, ESobs is an observed value, and ESmin and ESmax are the minimum and maximum observed values, respectively.
Fig. 2.
Illustration of the trade-off between two ecosystem services (ESs). For point A, the relative benefit of ES1 is 0.2 and the relative benefit of ES2 is 0.6. Point A is beneficial to ES1, and point E is beneficial to ES2, and point C and point D are the same distance from the 1:1 line with an equal trade-off value, but their trade-offs are less than point A. The trade-off value is zero for point B. This figure is modified from Bradford and D’Amato (2012).
Where ES1(i) and ES2(i) are the standardized values of ES1 and ES2, respectively, and n is the number of observations.
Data Analysis
The normality of the spatial distribution of the SMR, SMS and NDVI data frequencies was tested. The Mann-Kendall test was used to assess the mutation of data on a specific time scale, and the Pettitt test was used to determine the mutation nodes. Correlation analysis and multiple stepwise linear regression analysis were used to study the effects of vegetation and meteorological factors on SMR and SMS. Regarding restoration types, a value of 0 was assigned to natural restoration, while artificial restoration received a value of 1. The classification of slope direction factors was determined based on sunlight duration, with the following values: a sunny slope was rated at 1.0, the summit of a slope at 1.25, a semi-sunny slope at 1.5, a semi-shady slope at 2.0, and a shady slope at 2.5. All statistical analyses were conducted using IBM SPSS Version 22.0, and charts were drawn using ArcGIS 10.6, R Version 3.5.2 and Origin 2020.
Results
Basic Information
We analyzed the interannual variations in the NDVI, SMR, SMS and MAE. The results showed significant increasing trends in the NDVI, SMR, SMS and MAE, and the rank correlation factors reached 4.97, 2.87,3.01, and 3.15, respectively (P<0.001). Fig. 3 shows the abrupt NDVI change in 2009(P<0.01), the abrupt SMS change in 2010 (P<0.05), the abrupt SMS change in 2011(P<0.05) and the abrupt MAE change in 2011 (P<0.01).
Table 1 provides basic information about the SMR, SMS and MAE on the Loess Plateau. The SMR and SMS values increased from northwest to southeast and were the lowest in the Kubuzi Desert region (38°2′42″-39°47′51″N, 108°14′42″-110°45′15″). The MAE increased from northwest to southeast.
Correlation Analysis between SMR and SMS
We analyzed the correlations between SMR and SMS and meteorological factors and topographic factors before and after the year with the abrupt change (Fig. 4 and Fig. 5). Before the year with the abrupt change, latitude and elevation (ELE) were negatively correlated with SMR. MAE, MAP and longitude were significantly positively correlated with SMR. However, after the year with the abrupt change, latitude was no significantly correlated with SMR, and the correlation of MAP decreased. SMS was similar to SMR.
After removing the irrelevant indicators from the regression results, multiple stepwise regression was further carried out to examine the factors affecting SMR and SMS (Table 2). On the spatial scale, MAP, ELE, and MAE had significant simulations of aboveground biomass, accounting for 41.8% of the SMR variation, and MAP accounted for 30.2% of the SMR. MAE, ELE and MAT were the main determinants of the SMS, which accounted for 38.7% of belowground biomass (BGB) and 26.0% of the MAE. On a temporal scale, MAP and the NDVI accounted for 40.5% of the SMR. MAP, longitude, and latitude accounted for 60.5% of the SMS. The increase in the NDVI accelerated precipitation cycles, leading to increases in SMR, SMS, and MAE.
Fig. 3.
Analysis of the abrupt change in the NDVI, SMR, SMS and MAE. SMR, root-zone soil moisture; SMS, surface soil moisture; MAE, mean annual actual evaporation.
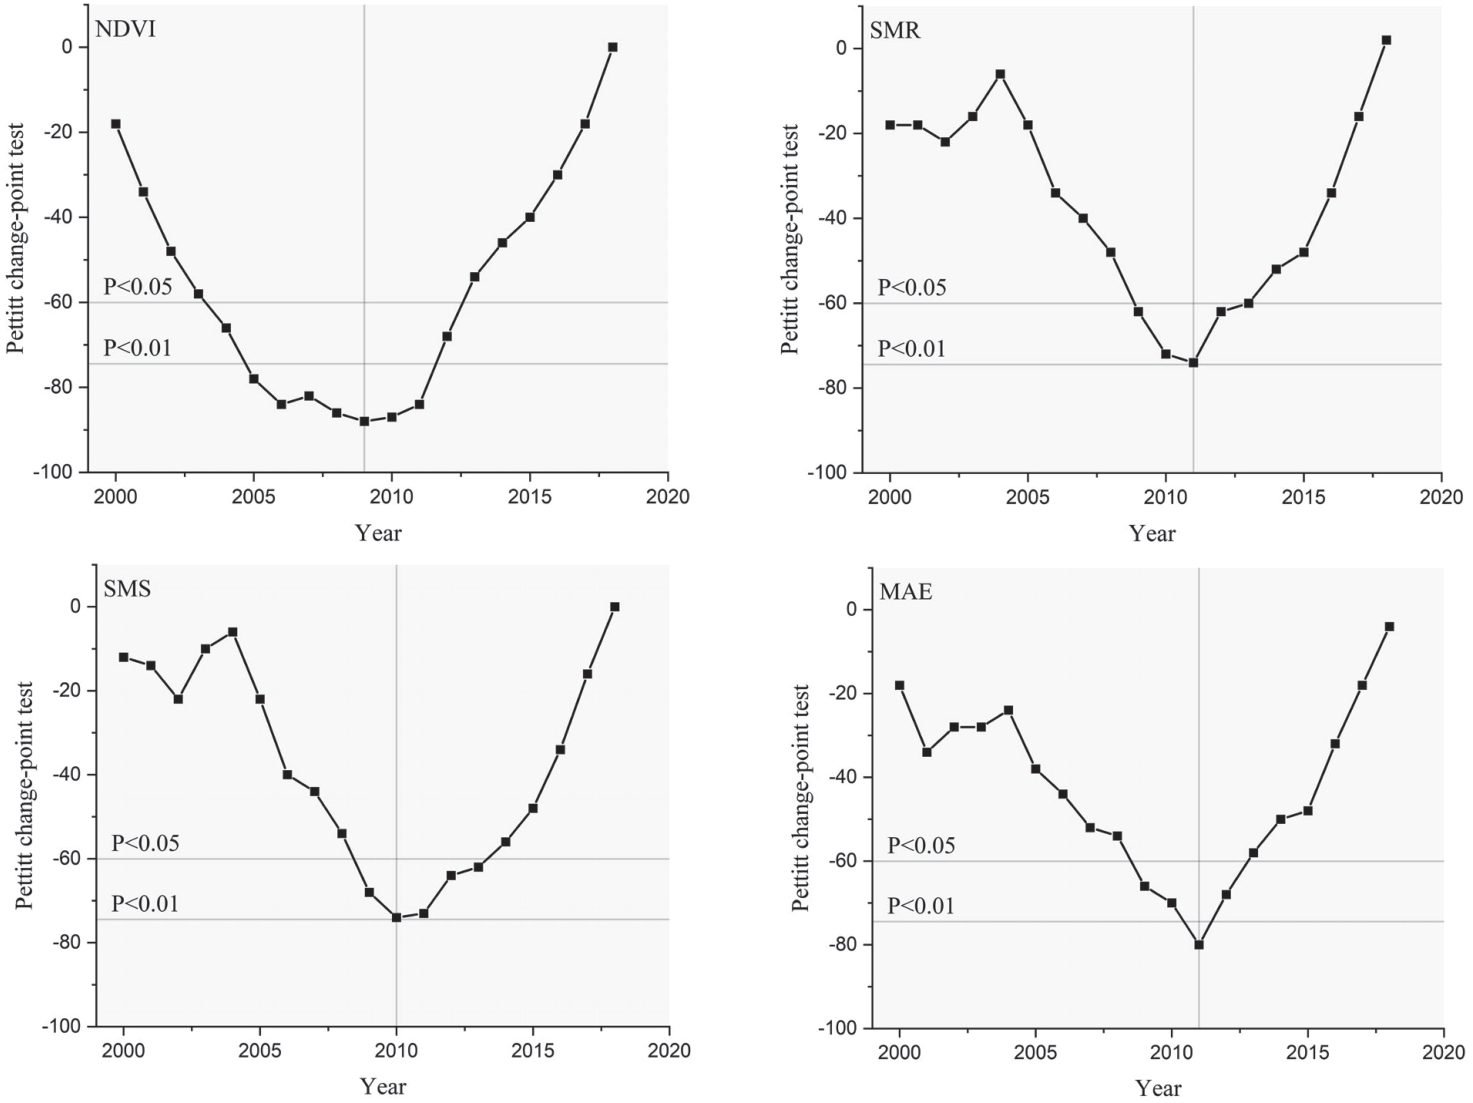
Table 1.
Soil moisture and mean annual actual evaporation contents for forests, shrublands and grasslands.
Table 2.
Summary of stepwise regression models to detect relationships between the aboveground biomass (AGB), BGB and SMC and their influencing factors.
Change in Relative Benefits
The Loess Plateau experiences a significant impact from the southeastern monsoon, resulting in a gradual decrease in precipitation from the southeast to the northwest. While the proliferation of vegetation has positively influenced the precipitation cycle in the region, it has not completely eradicated the fundamental spatial distribution pattern. Therefore, there is a need for further investigation into the precipitation gradient on the Loess Plateau. The relative benefits of the three planting covers showed different trends with increasing precipitation (Figure 6). As the area with precipitation less than 350mm·a-1is located in the northwestern Loess Plateau, it is not suitable for the growth of trees, and there is a lack of the relative benefit of the forestland in this area. The relative benefit of the forest NDVI was higher than that of farmland and grassland in the same rain belt. In the 550-650 mm·a-1 area, the relative benefit of the forest NDVI was the highest. The relative benefit of the forest NDVI increased by 19.07% and 12.26% in the 550-650 mm·a-1 area compared with the 450-550 mm·a-1 area and >650 mm·a-1, respectively. In response to the increase in precipitation, the highest relative benefit of the farmland NDVI appeared in the >650 mm area compared to the 150-250 mm, 250-350 mm, 350-450 mm and 550-650 mm precipitation areas, where the benefit increased by 432.04%, 188.24% 61.18%, 43.10% and 6.51%, respectively.With regard to the grassland, the relative benefit of the NDVI reached the highest in the 550-650 mm·a-1 area, which was not significantly different from the 450-550 mm·a-1 and >650 mm·a-1 areas, but significantly different from the 150-250 mm·a-1, 250-350 mm·a-1 and 350-450mm·a-1 areas.
Fig. 4.
Correlation coefficients of SMR and SMS with key average environmental factors before the year with the abrupt change. Lon, longitude; Lat, latitude; SLD, slope direction; SLG, slope gradient; ELE, elevation; MAE, mean annual actual evaporation; MAT, mean annual temperature; MAP, mean annual precipitation.
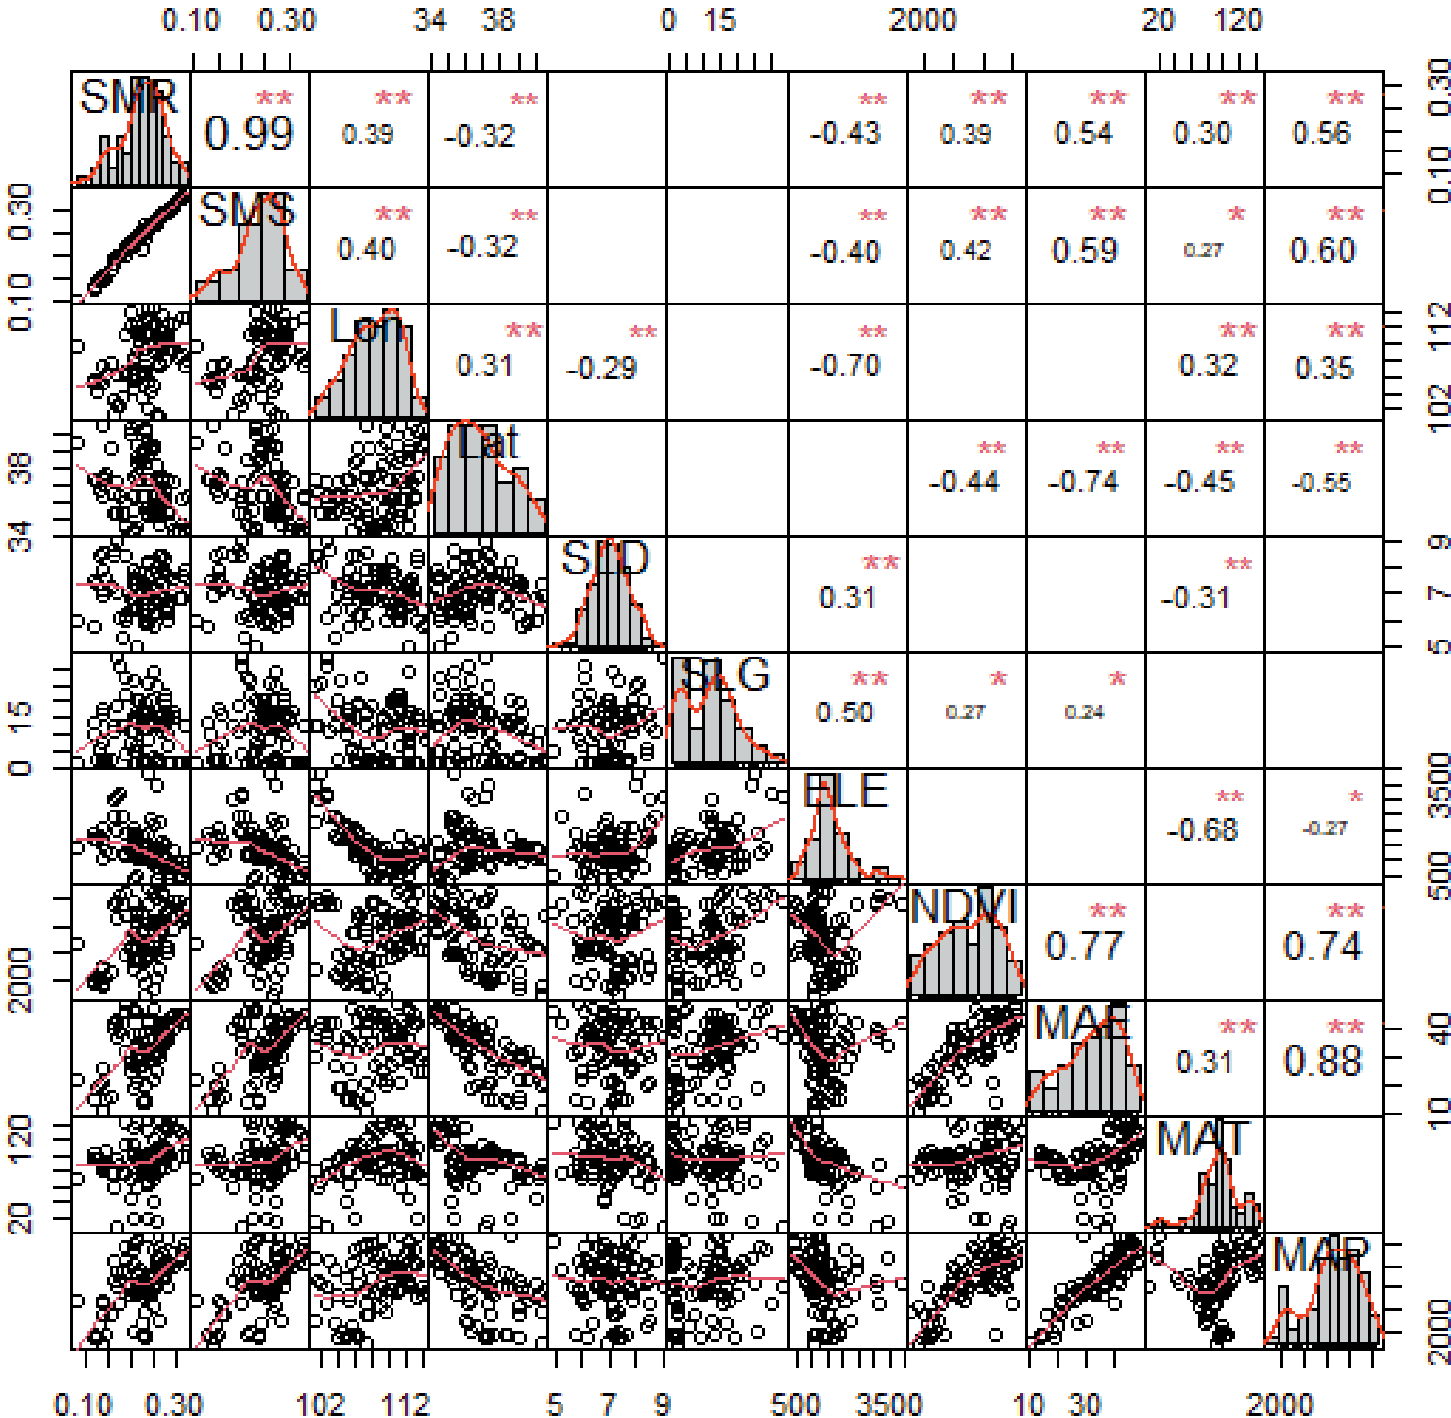
Fig. 5.
Correlation coefficients of SMR and SMS with key environmental factors averaged after the year with the abrupt change.
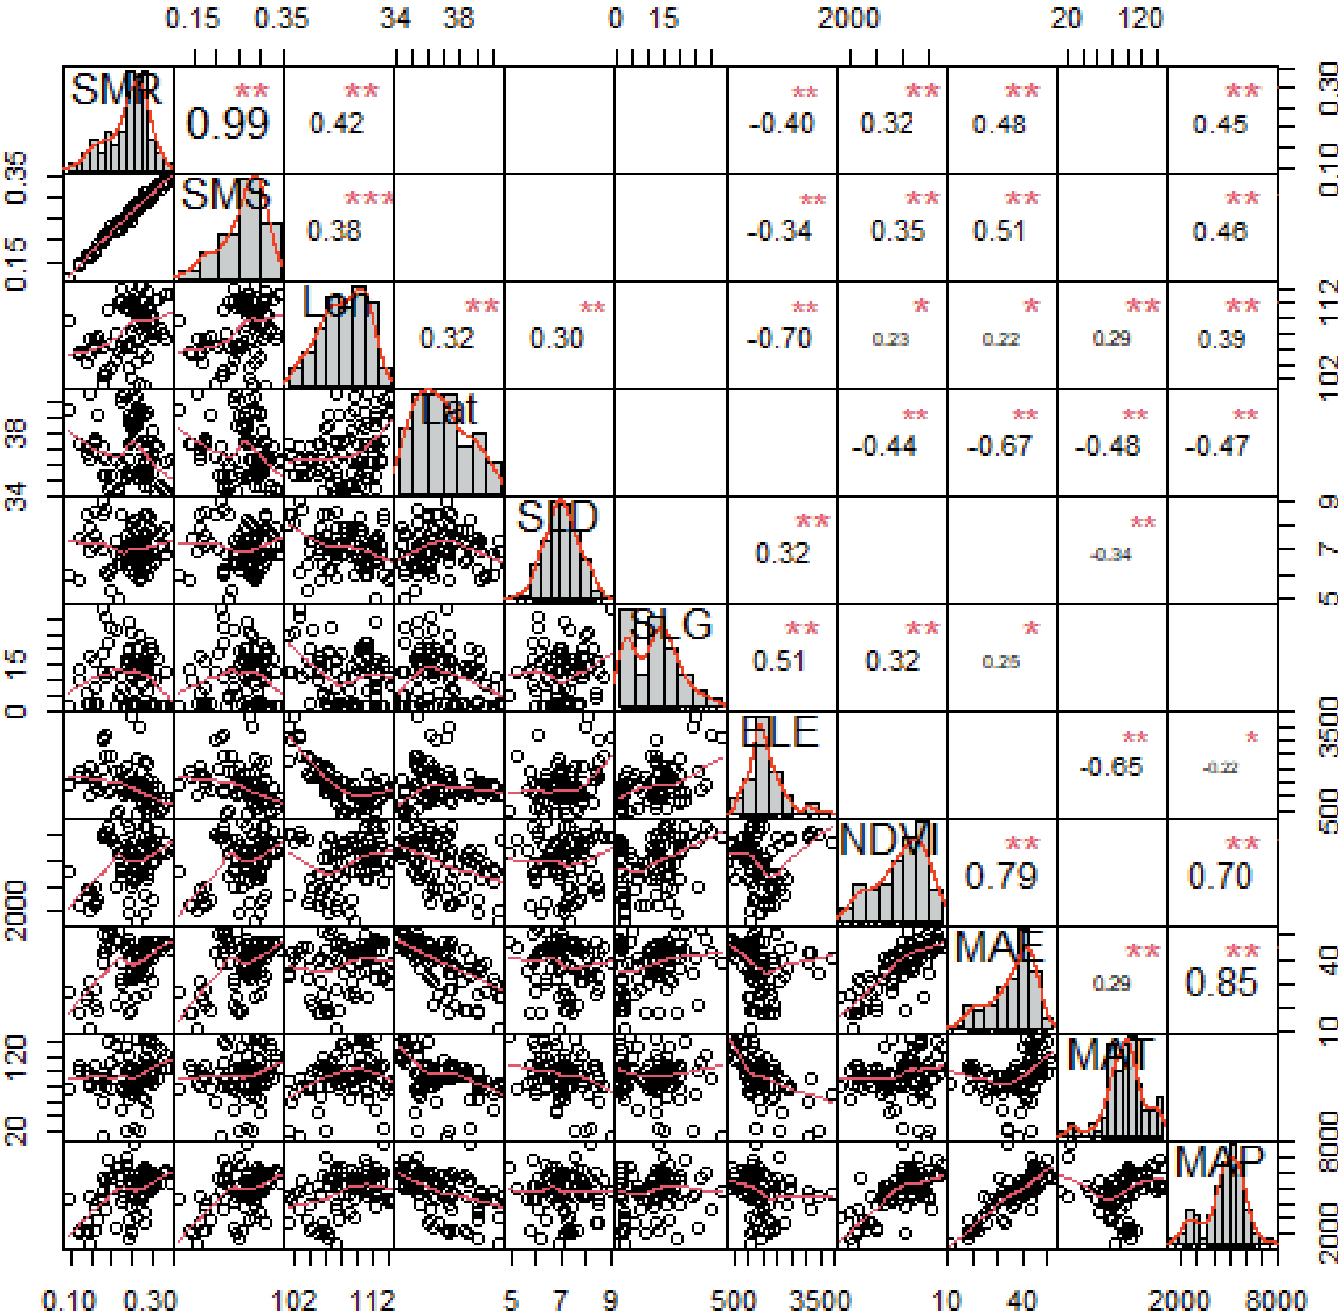
Fig. 6.
Changes in the relative benefits of AGB, BGB and SMC in forest, shrubland and grassland under different precipitation conditions.
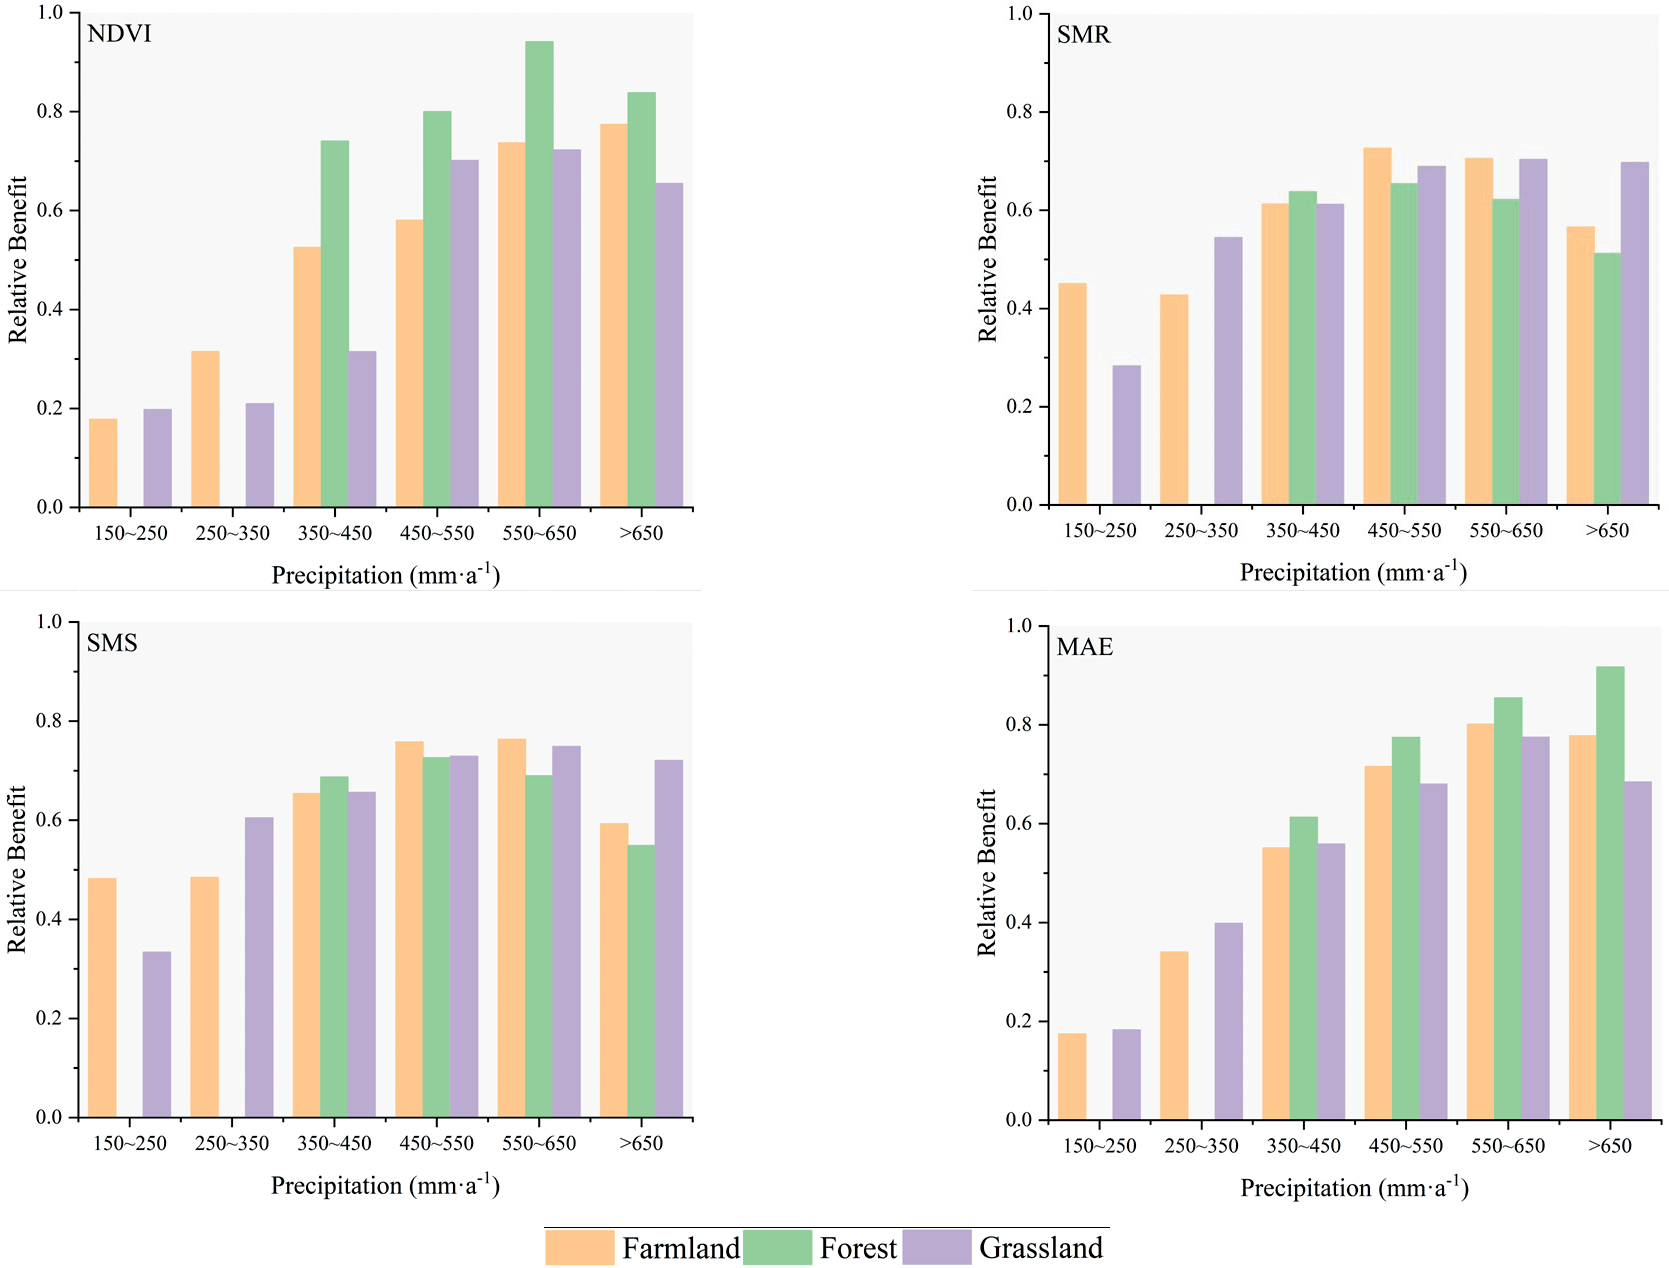
The relative benefit of the forest SMR species reached a maximum value of 0.65 in the 450-550 mm area and increased by 2.60%, 5.20% and 14.20% compared with the precipitation in the 350-450 mm·a-1, 550-650 mm·a-1 and >650 mm·a-1 areas, respectively. With an increase in precipitation, the relative benefit of the farmland SMR showed a tendency to increase first and then decrease, reaching a maximum value in the 450-550 mm·a-1 area. The highest value of the benefit of grassland occurred in the 550-650 mm·a-1 area, which was an increase of 148.36% compared with the minimum in the 150-250 mm·a-1 area. At the same time, the relative benefit of the grassland SMR in the 150-250 mm·a-1 area was the minimum overall. With regard to the SMS, the relative benefits of farmland, forest and grassland were higher than that of SMR, but the overall trend was basically the same.
With an increase in precipitation, the relative benefit of MAE with the three vegetation types increased gradually, and the relative benefit of the forest MAE was significantly higher than that of the farmland and grassland in the same precipitation. In the 150-250 mm·a-1 and 250-350 mm·a-1 precipitation areas, the relative benefit of farmland MAE was lower than that of grassland, which decreased by 4.29%, 14.51% and 1.40%, respectively. In the 450-550 mm·a-1, 550-650 mm·a-1 and >650 mm·a-1precipitation areas, the relative benefit of farmland MAE was slightly higher than that of grassland, increasing by 5.26%, 3.42% and 13.69%, respectively.
Change in the Trade-off between the Soil Moisture and NDVI
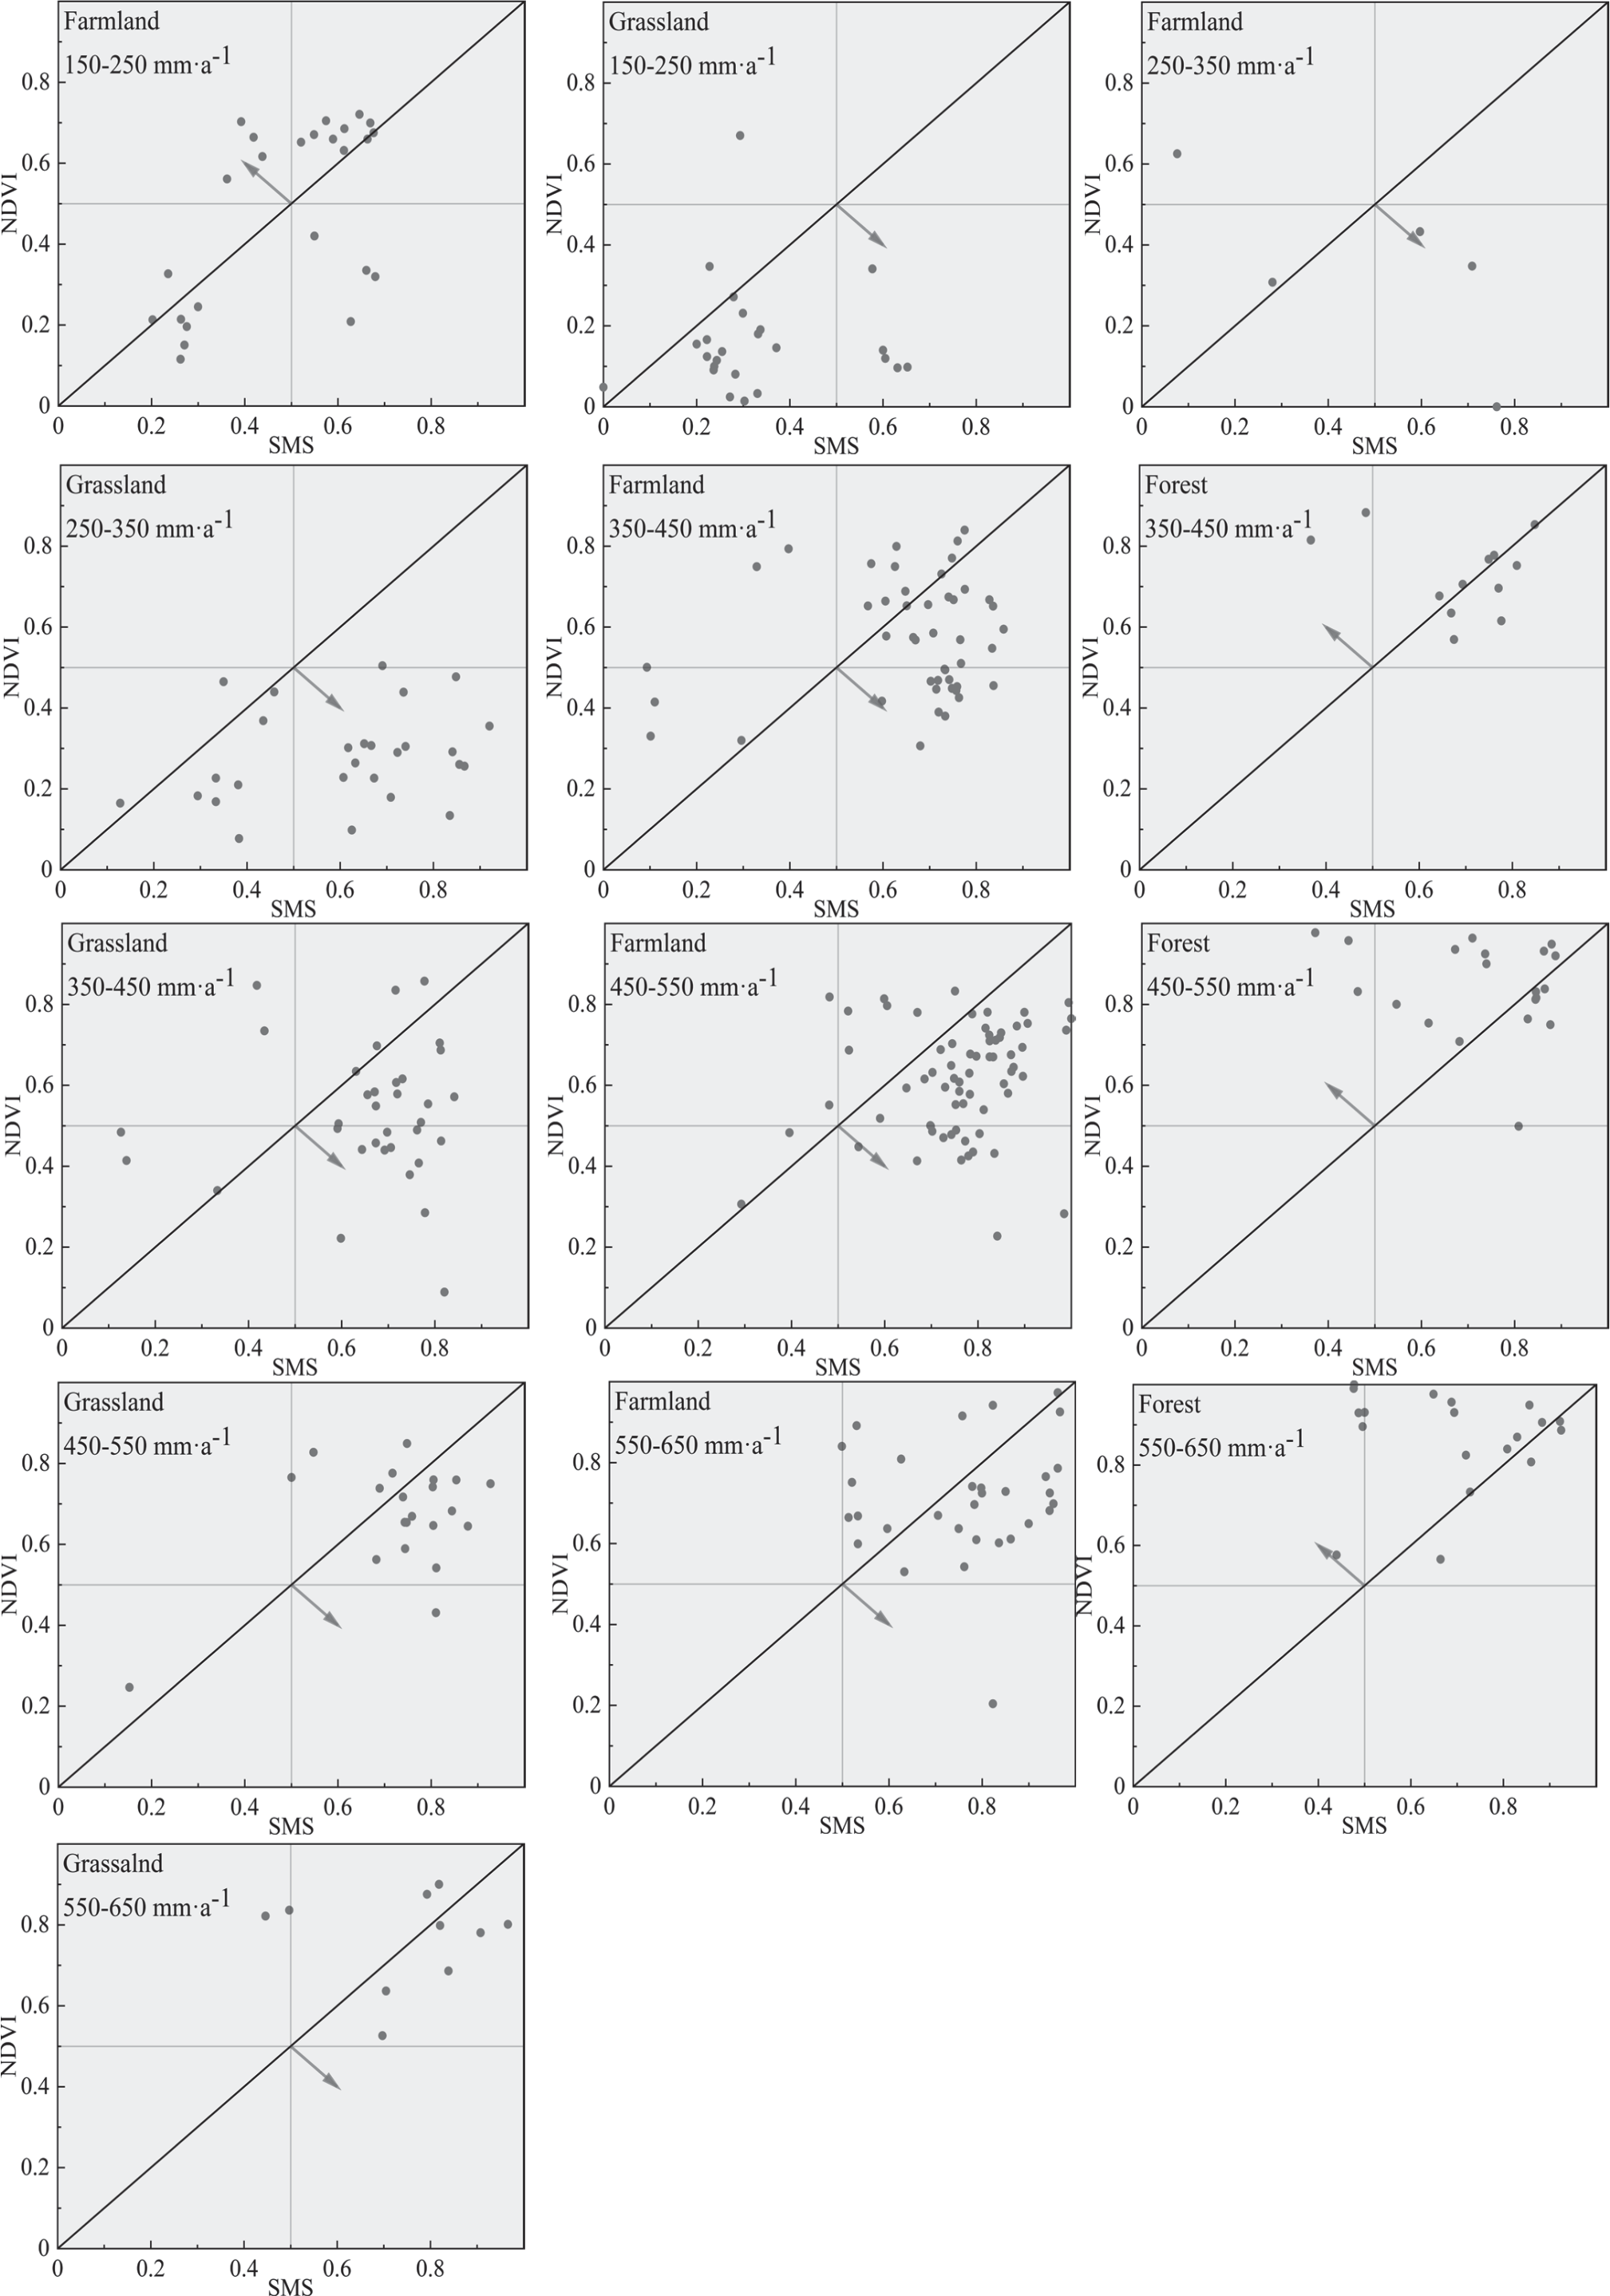
The trade-offs between the NDVI and SMR in different precipitation regions are shown in Fig. 7. In general, the coordinate points were divided based on the two sides of the 1:1 line, but the relative benefits of most parts of the Loess Plateau were slightly inclined to the SMR. However, the relative benefit of the forestland type area was more inclined to the NDVI. At present, in the Loess Plateau region, the proportions of farmland, forestland and grassland were 37.73%, 16.12% and 35.98%, respectively. SMR had more advantages when there was contradiction between the NDVI and SMR. The trade-offs between the NDVI and SMS in different precipitation regions were also different, and the overall trade-offs between the NDVI and SMR were similar. On the Loess Plateau overall, the SMS (Fig. 10) benefits were higher than the NDVI benefits, but in forest terrain areas, the NDVI benefits were significantly higher than the SMS benefits. The relative benefits of the farmland NDVI in the rain-fall belt of 150-250 mm·a-1 were higher than those of SMR and SMS, mainly because this region was geographically located in the northwestern Loess Plateau close to the upstream basin of the Yellow River and around Yinchuan city and is affected by human activities and the flowing water of the Yellow River.
Change in the Trade-offs between the Soil Moisture and MAE
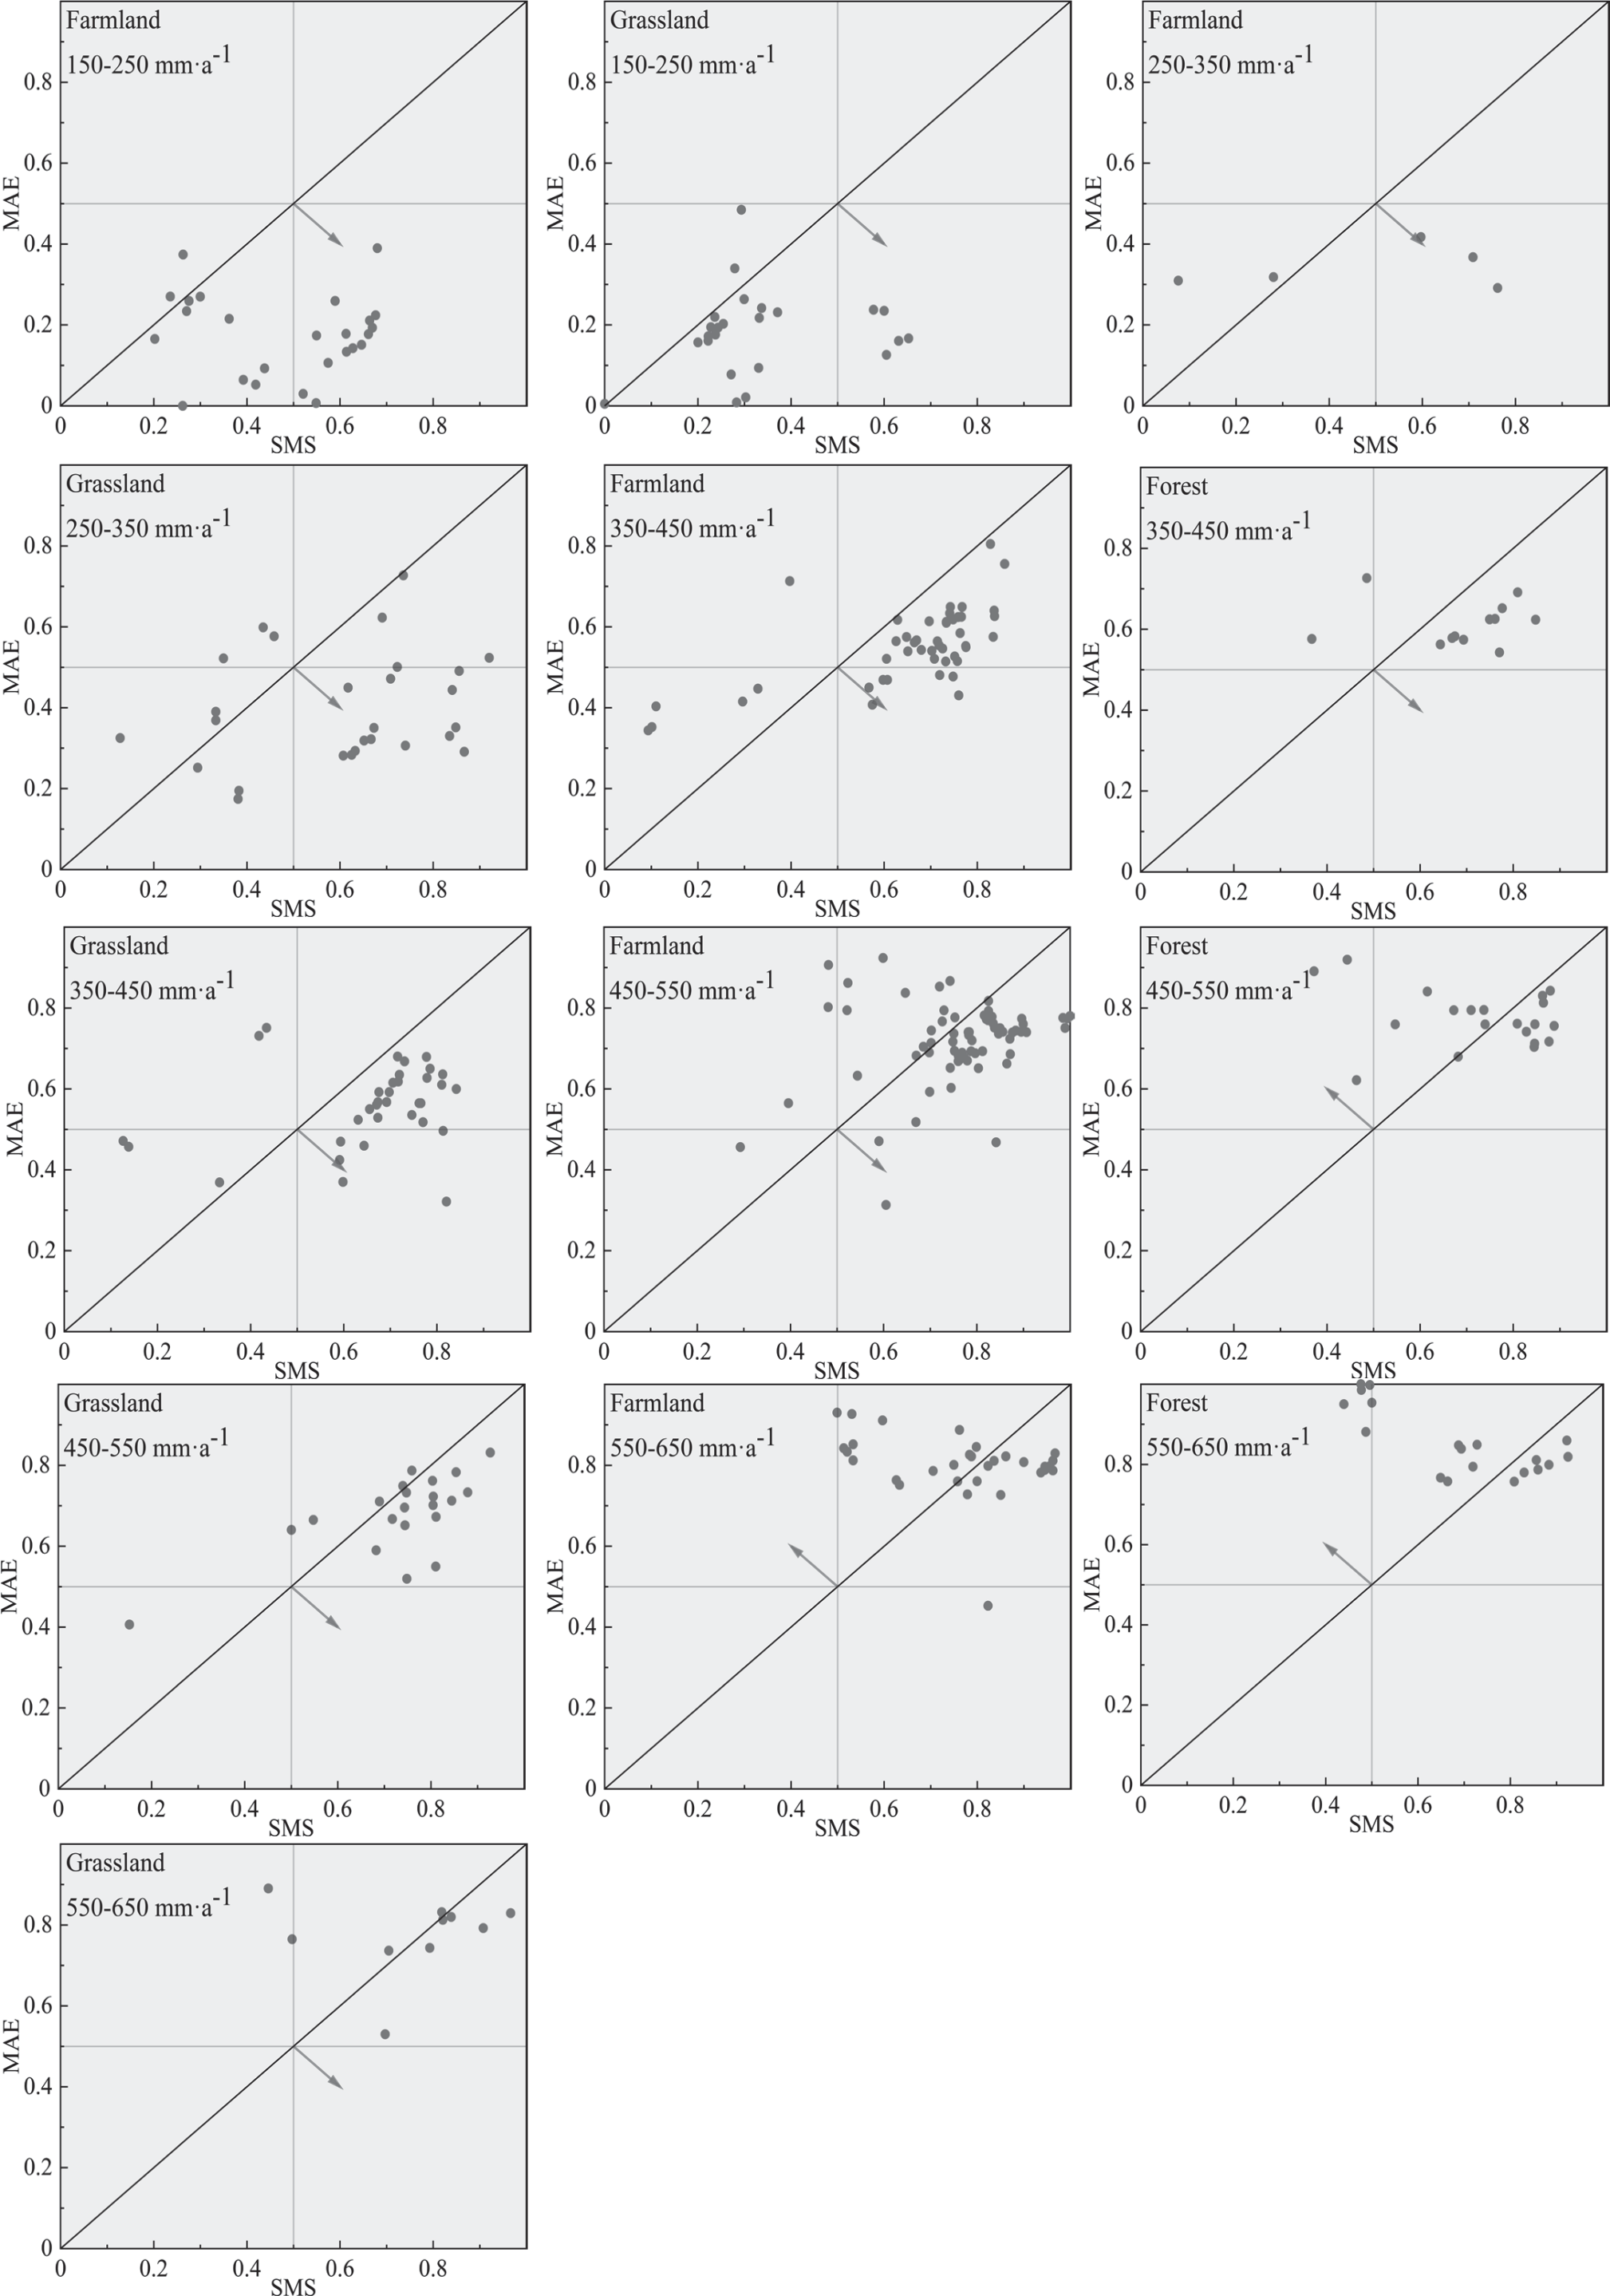
In the Loess Plateau region, the trade-off between the MAE and soil moisture was obviously affected by precipitation. In areas receiving 150-550 mm·a-1 of precipitation, the balance between MAE and SMR in both farmland and grassland tilts more towards SMR. Conversely, within the 550-650 mm·a-1 precipitation range, the trade-offs for farmland, forest, and grassland lean more towards MAE. In the 350-345 mm·a-1 precipitation area, the trade-off for the forest tended to be the SMR, while in the 450-550 mm·a-1 precipitation area, the trade-off for the forest MAE was higher. However, interestingly, for forest within the 350-450 mm·a-1 precipitation area, the points that tended to favor soil moisture were distributed very closely around the 1:1 line. In general, in the Loess Plateau region, the relative benefit of the low precipitation belt was more inclined toward the SMR, while the relative benefit of the high precipitation belt was more inclined toward the MAE. The SMS (Fig. 8) trend was broadly in line with the SMR and is not repeated here.
Trade-offs for NDVI, MAE and Soil Moisture along Precipitation Gradients
As shown in Fig. 9, the overall RMSD1 means for cultivated land, forestland and grassland were 0.22, 0.29 and 0.26, respectively. As precipitation increased, the RMSD1 values of forestland increased gradually, while farmland and grassland showed a trend of first increasing and then decreasing. The maximum RMSD1 values for cultivated land were in the 250-350 mm·a-1 rain belt, and the minimum values were in the 150-250 mm·a-1 rain belt, which were mainly the result of human activities. In the rain belts of 350-450 mm·a-1, 450-550 mm·a-1 and 550-650 mm·a-1, the RMSD1 values of cultivated land gradually decreased, with decreases of 53.88%, 55.52% and 62.34%, respectively, compared with those of 250-350 mm·a-1. In comparison to the with the 350-450 mm·a-1 rain belt, the RMSD1 of the 450-550 mm·a-1 and 550-650 mm·a-1 rain belts increased by 30.62% and 43.84%, respectively. The minimum RMSD1 value of grassland was located in the 450-550 mm·a-1 rain belt, and the maximum value was located in the 250-350 mm·a-1 rain belt. The trend in the RMSD2 values was basically the same as that for RMSD1, but there were some numerical differences, which are not repeated here.
The average RMSD3 values for cultivated land, forestland, and grassland were 0.21, 0.26, and 0.20, respectively. It was evident that the RMSD3 values for forestland were significantly higher compared to both cultivated land and grassland. Moreover, with an increase in precipitation, the RMSD3 values for forestland displayed a gradual upward trend. The RMSD3 values of cultivated land first decreased and then slightly increased to a minimum in the 350-450 mm·a-1 rain belt. Compared with the 150-250 mm·a-1 rain belt, the RMSD3 values in the 250-350 mm·a-1, 350-450 mm·a-1, 450-550 mm·a-1 and 550-650 mm·a-1 rain belts decreased by 14.92%, 54.90%, 54.28% and 38.27%, respectively. The grassland reached its maximum in the 250-350 mm·a-1 rain belt, then gradually decreased, and reached its minimum in the 450-550 mm·a-1 rain belt.
Trade-offs for the NDVI and Soil Moisture and the MAE and Soil Moisture among Different Years
The trade-offs between the SMR and NDVI showed evolution on the Loess Plateau (Fig. 10, Table 3); the trade-offs were more inclined toward the NDVI between 2000 and 2004, but after 2005, the NDVI was preferred (Fig. 11). Over time, the RMSDa reached a maximum value of 0.245 in 2015 andincreased slightly without an obvious year of abrupt change. The trade-offs between the SMS and NDVI in 2000-2005 and 2014-2017 were more inclined toward the SMS. The trends of the SDMR and RMSD were basically the same.
The trade-offs between the MAE and SMR were slightly inclined toward the SMR, as well as for the SMS (Fig. 12). The RMSDc values were between 0.15 and 0.20 and slightly increased after 2012. The RMSDd values showed a flat band from 2012 to 2014. The overall values were still low and were similar to those of the RMSDc.
Discussion
Trade-offs between Soil Moisture and Other Factors
The Pettitt mutation point and M-K tests showed that the soil moisture in the Loess Plateau area increased annually. The fitting results of the multiple stepwise regression model showed that precipitation was the most important factor affecting SMR and SMS spatially, while temporally, the increase in the SMR was deeply affected by precipitation and the NDVI; the SMS was greatly affected by precipitation and latitude and longitude; however, these models varied on different spatial and temporal scales. Therefore, the mechanism of the spatiotemporal variation in soil moisture needs further study. The SMR and SMS are also influenced by living or nonliving factors, such as topography [26] and plant characteristics [27]. Precipitation is a major constraint factor affecting the total supply of ecological services in a region [28]. The arid environment of the Loess Plateau restricts the growth and distribution of vegetation. In addition, excessive consumption of soil moisture is due to unreasonable selection of tree species and high community density [29]. However, these trade-off relationships do not increase or decrease monotonously as vegetation ages; for example, vegetation growth accelerates the circulation of soil moisture in the atmospheric system [30-32]. Under the joint action of human activities and the environment, vegetation development and soil moisture change greatly over time, but certain reference values can still be obtained. Although there is evidence for a trade-off between the NDVI and soil moisture and evapotranspiration, this study still has many limitations. First, the SMS and SMR have a strong numerical correlation (0.967, P<0.01), resulting in SMS and SMR coupling in the trade-off analysis. At the same time, the soil moisture data are remote sensing data, and therefore lack the support of the measured data for a conclusion. Second, when plant development is in conflict with soil moisture, different vegetation types and species adopt different water use strategies. Our study aimed to determine the relationship of interest between vegetation development and soil moisture and evapotranspiration in different water areas. Third, the NDVI represents the development of vegetation and lacks biomass, carbon, nitrogen reserves and other indicators to describe the ecosystem.
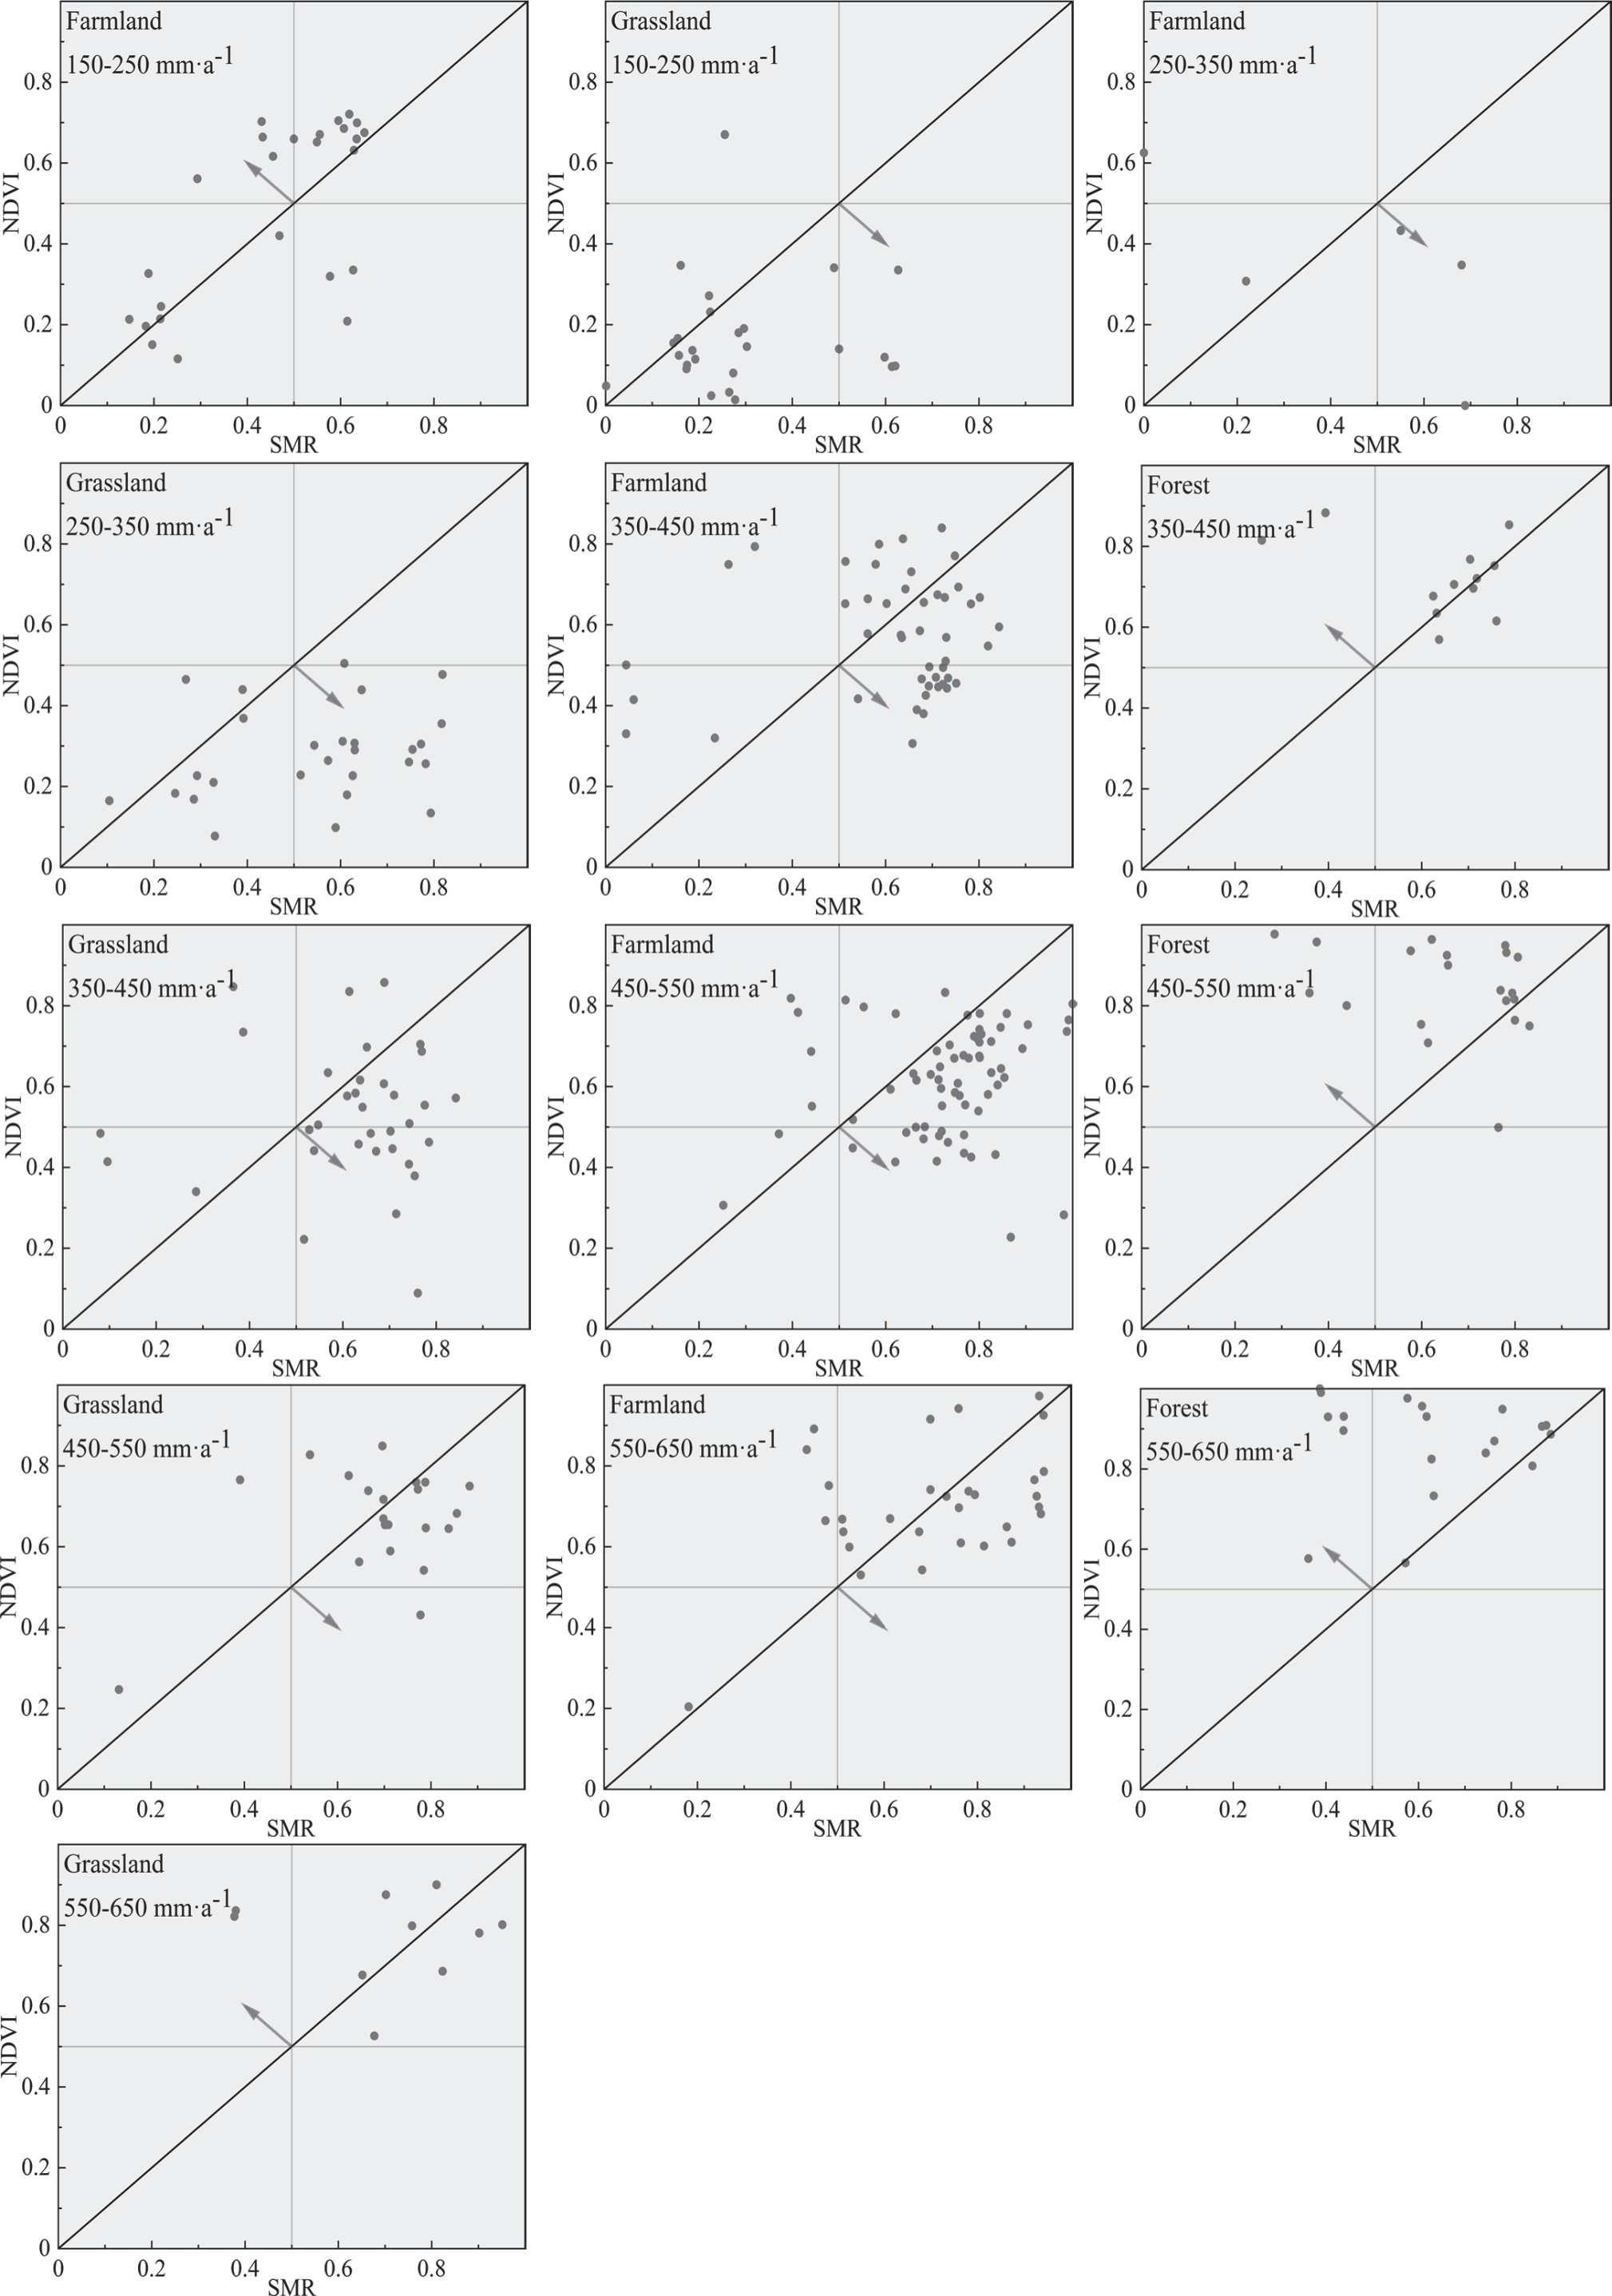
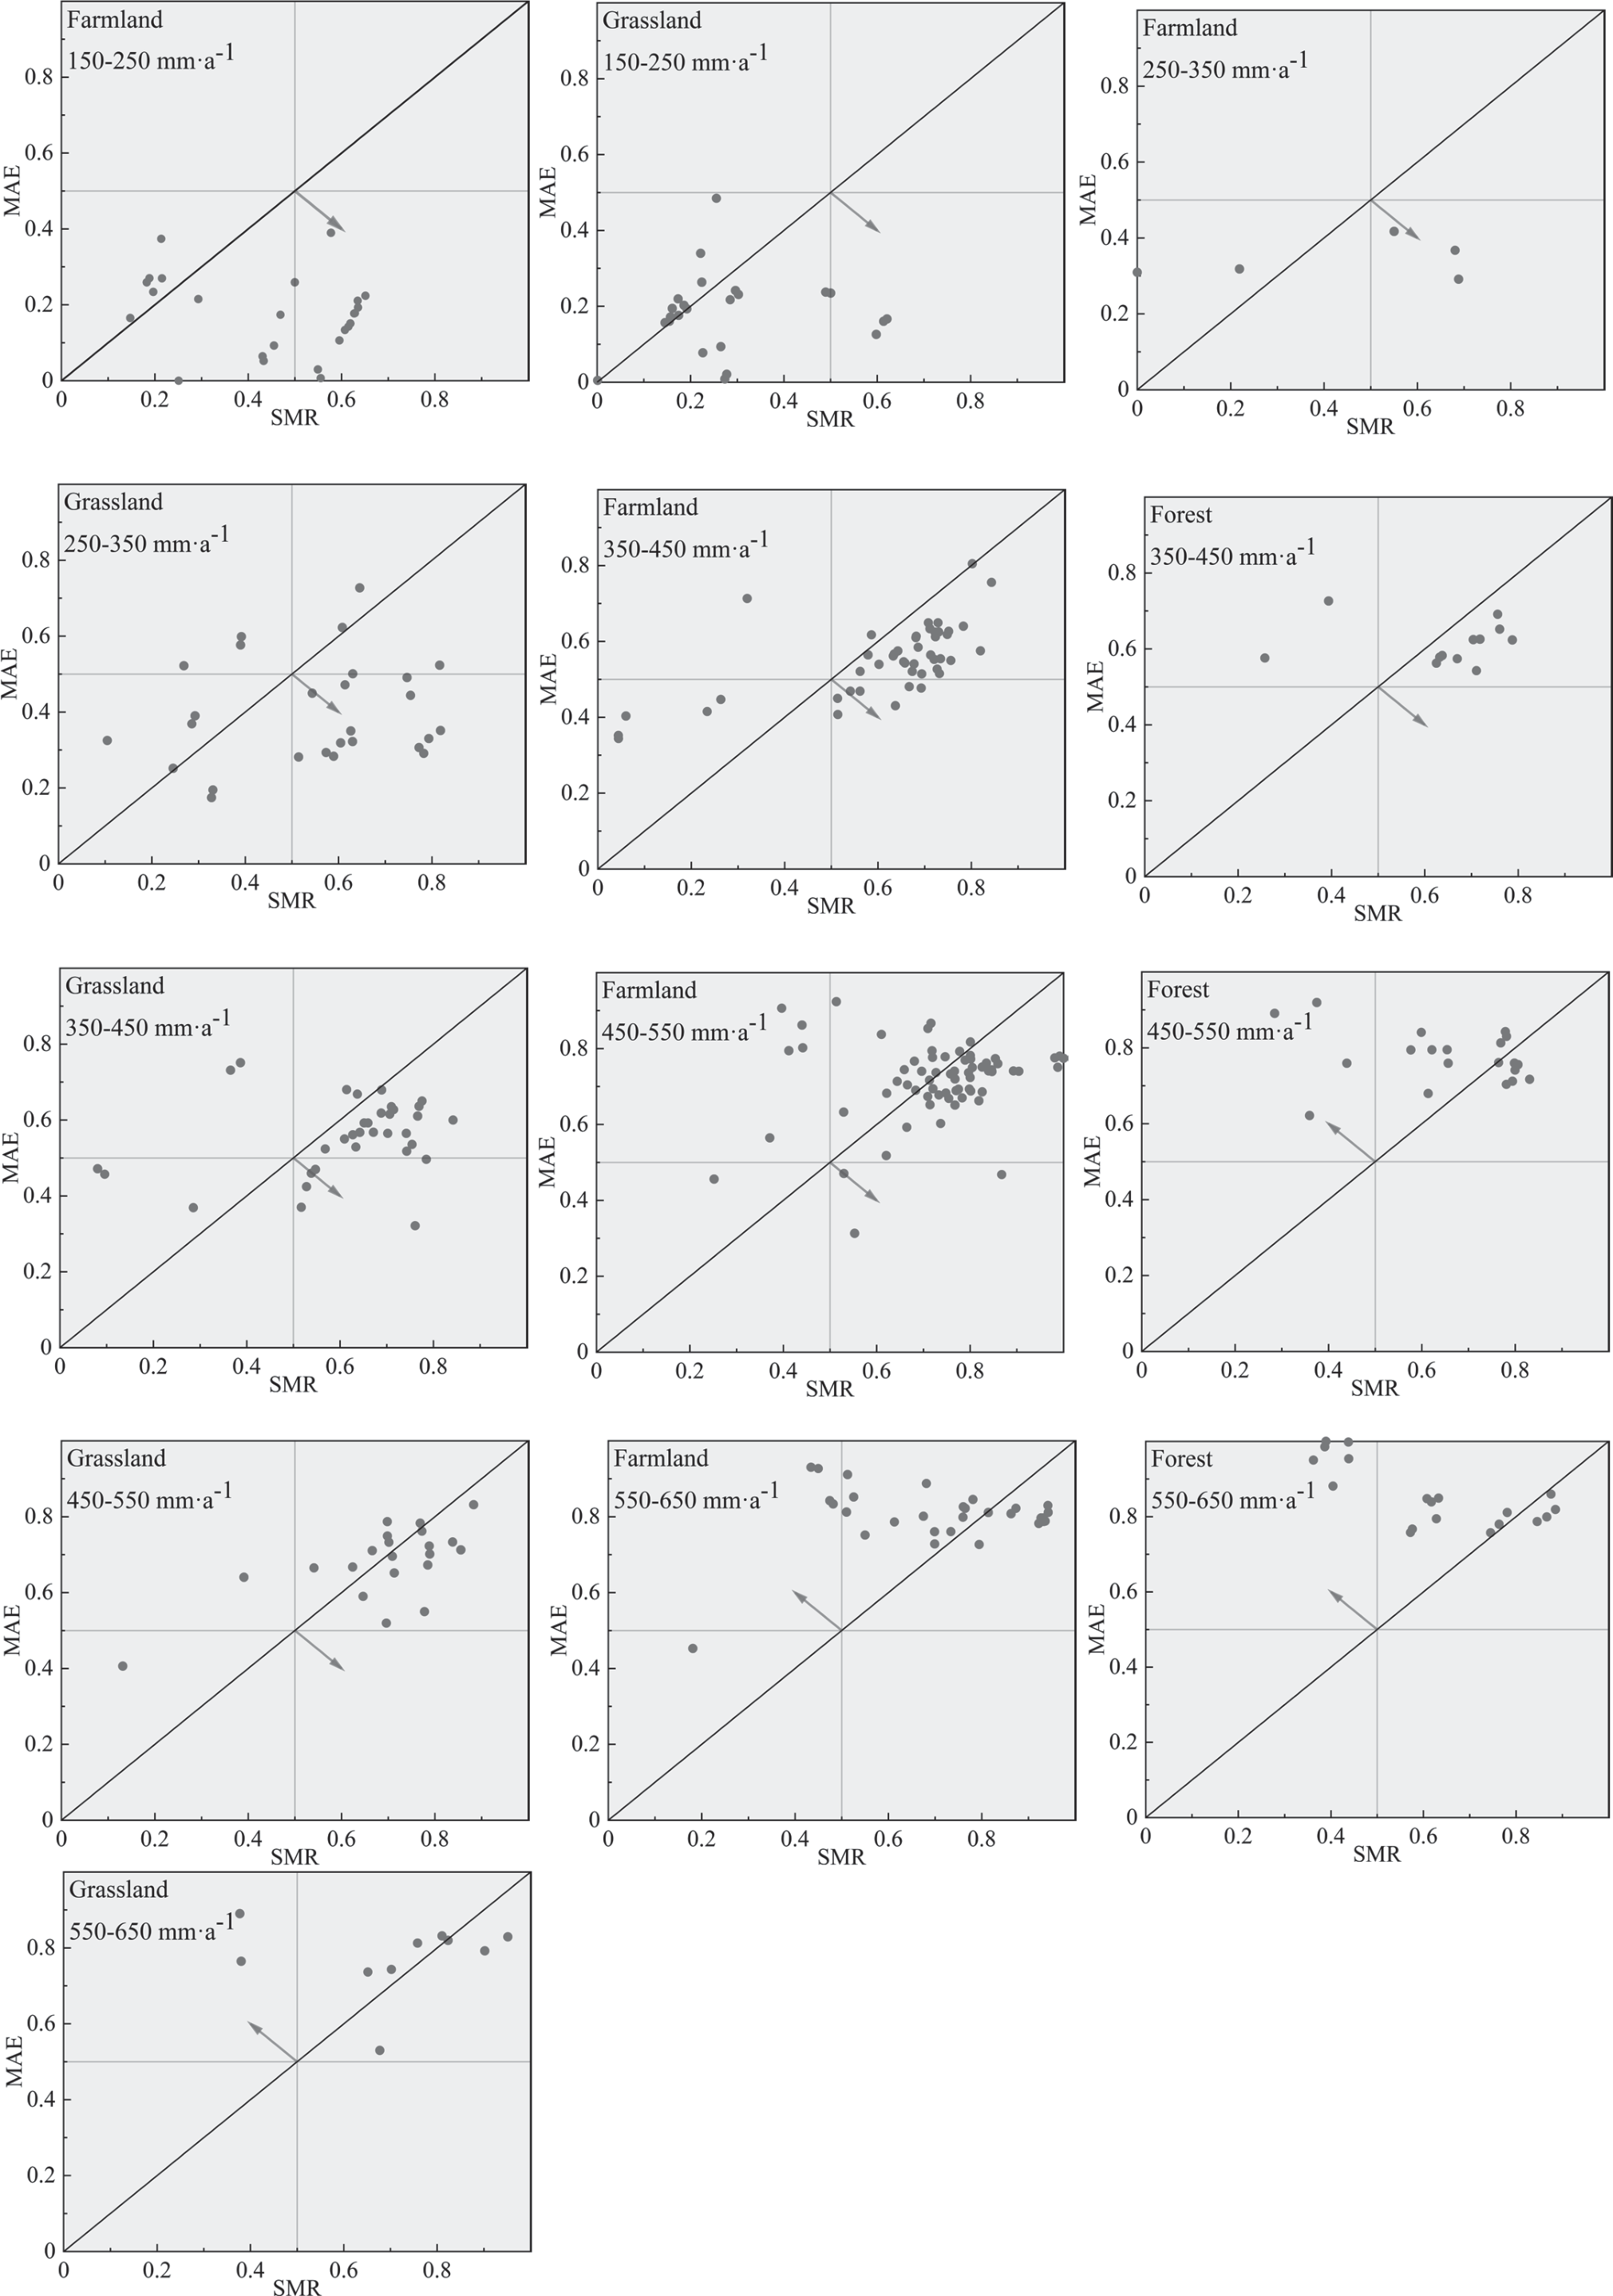
Fig. 9.
Changes in the trade-offs of three vegetation types along the precipitation gradient. RMSD1, trade-off between the NDVI and SMR; RMSD2, trade-off between the NDVI and SMS; RMSD3, trade-off between the MAE and SMR; RMSD4, trade-off between the MAE and SMS.
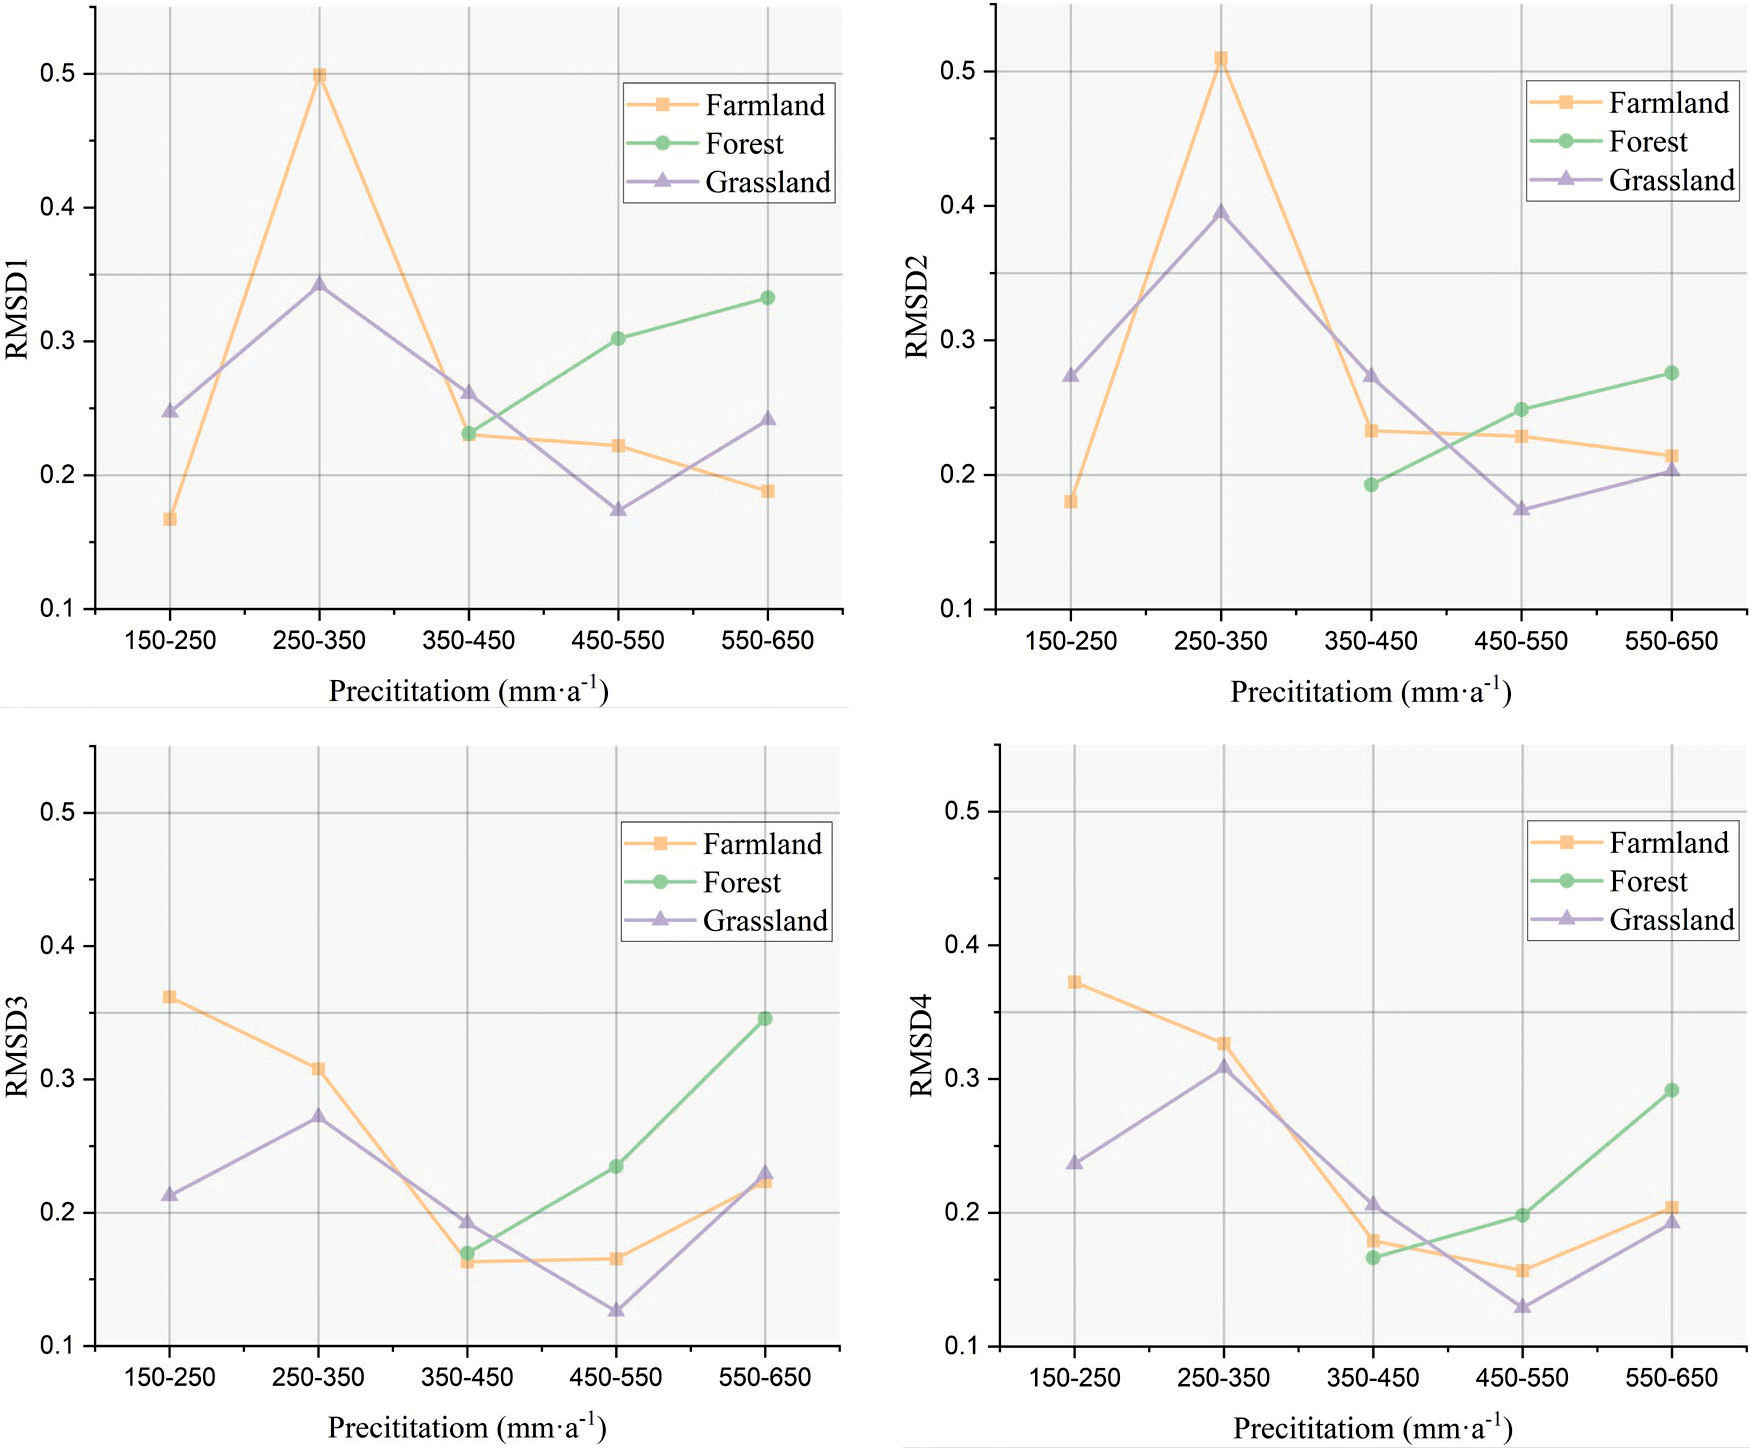
Fig. 10.
Variation in the trade-offs in different years on the Loess Plateau. RMSDa, NDVI and SMR; RMSDb, NDVI and SMS; RMSDc, MAE and SMR; RMSDd, MAE and SMS.
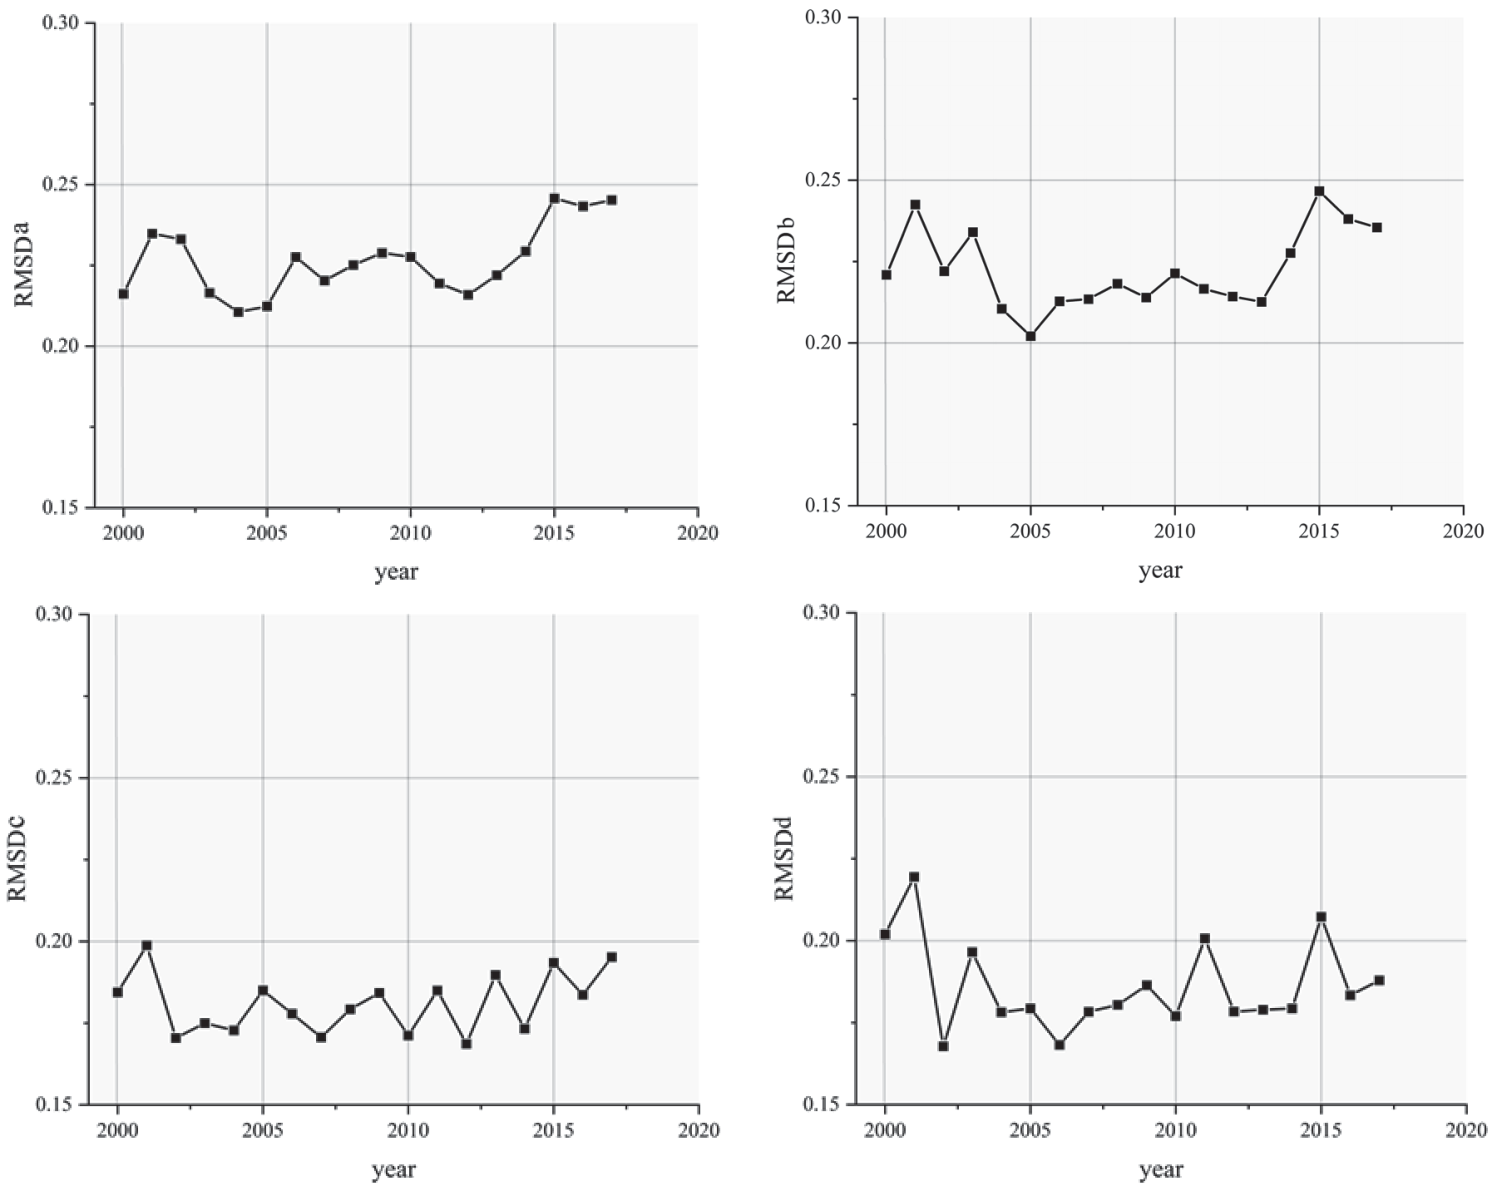
Table 3.
Number of trade-off propensity ratios in different years.
Temporal and Spatial Differences in Soil Moisture
The Loess Plateau is the worst-hit area for soil erosion in China. Since 1999, the policy of returning farmland to forests and grasslands has been implemented. Rational land use cover change (LUCC) can not only improve the soil moisture content but also enhance regional sustainable development [33, 34]. In the early stage, the change in LUCC causes deep soil moisture to decline [33]. According to our study, SMR showed a downward trend from 2003 to 2006, no obvious change from 2007 to 2010, and an upward trend from 2011 to 2018. One study showed no significant age differences in soil moisture, possibly due to differences in the temporal and spatial scales that were studied [35]. Yan’s research in 2015 [33] found that the soil moisture content under 1m was the highest in cultivated land with no change in the land use type. In our study of relative benefits, except for 300-450 mm and 550-650 mm rain belts, the relative benefits of soil moisture in cultivated land were higher than those in other land use types (Fig. 9).
The distribution of soil moisture was coupled to the distribution of precipitation and was severely affected by the southeast monsoon. The growth and development of vegetation caused the soil moisture in the Loess Plateau region to show an increasing trend yearly. Due to the special natural environment and human factors, the soil moisture in the Kubuqi Desert was lower than the normal level.
Effects on Vegetation Development
The temporal and spatial differences in the supply of services across multiple ecosystems are studied to find evidence supporting the aggregate high level of most services and to understand the potential and modalities for achieving this high level [1, 36, 37]. In the Loess Plateau region, soil moisture and vegetation development are not mutually antagonistic. Soil moisture supports the development of vegetation, which accelerates the circulation of soil moisture in the atmospheric system through transpiration and returns soil moisture by increasing precipitation [30, 38]. Our study shows that the trade-offs between the soil moisture and NDVI and MAE change with changes in precipitation and years. At different times, the different equilibrium tendencies represent the self-regulation ability of the Loess Plateau region, and the change in RMSD values indicates that the soil moisture system in the Loess Plateau region has always been in a relatively balanced state in recent years. On the one hand, soil moisture is a key variable in the ecosystems of arid and semiarid regions, limiting the growth of primary producers, and previous studies have found that trees can lead to the drying of soil layers [39]. The appearance of “little old trees” (which refers to the low-yield and low-value stands that are unable to grow into live timber after afforestation for a long period of time, commonly known as “little old trees”) aggravates soil and water losses. Therefore, in vegetation restoration, special attention should be given to reducing the negative impact of soil moisture loss, especially in areas where the relative benefits of soil moisture are relatively low but where the NDVI and soil moisture trade-offs are relatively high, such as forest areas with low precipitation belts. In most precipitation areas of the Loess Plateau, the relative benefit of soil moisture is higher than that of the NDVI and MAE. Therefore, under the premise of appropriate species and reasonable vegetation density, the areas with relatively high soil moisture benefits should be expanded. On the other hand, the relative benefits of forest areas are in favor of the NDVI and MAE, which are the places that need the most attention in the Loess Plateau region. The policy of returning farmland to forest should be carried out under the premise of monitoring the soil moisture content. The results of this study have some reference value for other areas that are similar to the Loess Plateau, where large-scale conversions of farmland to forest or grassland are carried out [40]. Our study highlights the need to quantify the trade-offs between multiple ecosystem services at different spatial and temporal scales to better manage ecosystems. In addition, the results of this study depend on the selected research objects and do not represent the best measures for vegetation construction.
Conclusions
We conducted an extensive analysis of the interrelationships among soil moisture, NDVI (Normalized Difference Vegetation Index), and MAE (Mean Absolute Error) across farmland, forestland, and grassland ecosystems at various temporal and spatial scales within the Loess Plateau region. Our findings revealed that precipitation emerged as the paramount factor influencing soil moisture content. Furthermore, soil moisture exhibited variations in response to latitude and longitude changes over time, while the extent of soil moisture retention (SMR) was notably influenced by the dynamics of vegetation development. In most of the precipitation areas, farmland and grassland benefitted more from soil moisture than the NDVI and MAE, and forest showed the opposite pattern. From 2000 to 2018, the deviation degree of the overall relative benefits of the Loess Plateau was relatively stable, which reflected the excellent self-regulation ability of the region. At the same time, to better restore local vegetation and reduce the presence of small old trees, measures should be taken to minimize the relative benefits between soil moisture and vegetation parameters. Therefore, the negative effects of excessive soil moisture consumption in forest regions should be reduced, and vegetation restoration should be advanced in areas with high soil moisture yield under the premise of appropriate plant species selection and distribution. In conclusion, this study serves as a foundational framework for guiding future endeavors in vegetation development and soil moisture management across the Loess Plateau region.

