

Introduction
In Southwest China, the rainfall is minimal, and the climate is arid. Especially in Xinjiang Province, water resources are seriously scarce; Xinjiang Province belongs to a classical continental dry climate [1]. The annual average precipitation is approximately 150 mm. The magnitudes of annual evaporation are a dozen or dozen times greater than precipitation, so drought and water resource shortages have seriously restricted the development of agriculture and the economy in Xinjiang [2]. To solve the above difficulties [3], water-saving techniques are widely applied and promoted in Xinjiang Province, for example, drip irrigation, subsurface irrigation, and spray irrigation [4]. These irrigation systems can distribute water uniformly, precisely control the amount of water released, increase plant yields, reduce evapotranspiration and percolation, and decrease the dangers of soil degradation and salinization [5], especially for the planting of cotton; different irrigation modes have significant influences [6-7] on the growth and development of cotton. Many researchers have performed many investigations [8] on this problem. For instance, the corresponding production function of crop water in combination with experimental results was applied to analyze the influences of irrigation on cotton yields under different irrigation modes by Yang et al. [9]. The development and physiological characteristics of cotton under different irrigation modes [10] were investigated in an experiment by Li et al. [11]. Using the same irrigation modes, the plant heights of cotton were found to decrease as the irrigation amounts decreased [12]. The influence of the irrigation mode on the sizes of cotton plants was more significant than the influence of the irrigation amount [13-14]. An investigation by He et al. [15-16] demonstrated that the distributions of the water content are different under different irrigation modes, so the influences of various irrigation modes on the growth and development quality [17-18] of cotton are also different. The above conclusions demonstrate that the selection of irrigation modes has a significant influence on the yield of cotton.
The paper is organized as follows: Section 1 introduces the experimental scheme in the study area. Section 2 establishes two assessment models based on the AHP-TOPSIS theory and the accelerated genetic algorithm. In Section 3, the results obtained from the experiment and theory are compared and discussed. In Section 4, conclusions are drawn.
Materials and Methods
The Overview of Experimental Field
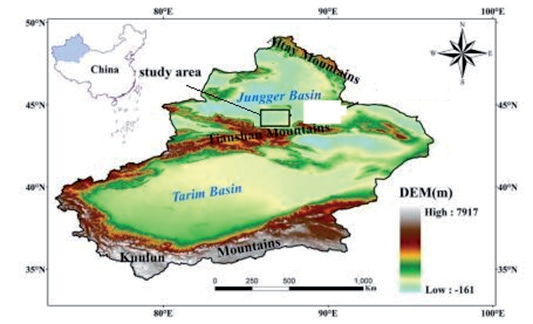
The study area is located in a certain experimental field in Urumqi, Xinjiang, a vital communication line between the north and south of Xinjiang Province; it is located in the south of the Dzungar Basin and is surrounded by mountains on three sides. Its eastern longitude is 87ºC, its northern latitude is 43º, and its average altitude is approximately 800 m. The continental arid climate in a temperate zone is presented in Urumqi because it is far from the ocean; the annual average temperature is approximately 7.3ºC, the extreme maximum temperature is 47.8ºC, the minimum temperature is -41.5ºC, and the yearly rainfall is approximately 194 mm. The rainfall in the spring accounts for 40% of the rainfall that occurs in the whole year. The annual average hours of sunshine are approximately 2775 hours, the frost-free period is between 105 and 168 days, and the temperature varies considerably between day and night. The summer and winter seasons are long, while spring and autumn are short. The total area of Urumqi is approximately 1.42×10⁴ square kilometres. It is divided into seven districts and one county, and its residential population is approximately 330×104 people. The existing cultivated land is about 65400 hectares. Agriculture is the primary industry in Urumqi; specifically, cotton cultivation is its pillar industry, and it is also the primary source of income in Urumqi. The study area is a classic arid area and is shown in Fig. 1.
Experimental Scheme
The field experimental environment is modeled in the paper. Three irrigation modes (including flood irrigation (E), drip irrigation under the film (F), and subsurface irrigation under the film (G)) in the experiment are performed, and the lower limit of soil moisture content is set as the control standard, three processing methods are divided in each irrigation mode, so total nine processing methods about irrigation modes are adopted in the experiment, each processing method is repeated three times. The experimental areas are divided into 27 sub-regions. The total growth periods of cotton are composed of the sowing stage, seedling stage, bud stage, flower, and boll stage and boll stage. The crucial steps of demanding water (including bud stage, flower, and boll stage) about the cotton are discussed in the paper. Three lower limit indices of irrigation are set in every irrigation mode, respectively defined as 50%-55%, 60-65%, and 70%-75% of field moisture capacity. Irrigation is often begun when the magnitudes of actual soil moisture content are lower than ones of lower limit index about soil moisture content, the quantity of irrigation water arrives at the upper limits of irrigation water (namely, field moisture capacity); the amount of irrigation water can be expressed as follows:
Where, Q is the quantity of irrigation water once in the sub-regions (m2); q1 is the upper limits of soil moisture content; q2 is the average value of actual soil moisture content; s is the area of sub-region (m2); h (m) is the thickness of planned wetting layer; p is the soil moisture ratio, it is adopted as 0.7.
The experimental layout in the paper is shown in Table 1.
The Monitoring of Growth and Development Index
The plant height (C1), daily increment of plant height (C2), the number of blades (C3), daily increment of blades(C4), number of fruiting branches (C5), bud number (C6), number of blossoming (C7) and the mass density of roots (C8) are regarded as the critical indices of growth and development about the cotton. Temperature, humidity, illumination soil moisture, etc., greatly influence cotton growth and development. The experimental fields are located at the same place in the paper, so temperature, humidity, illumination, and other factors can be omitted. The magnitudes of irrigation amount are crucial factors that affect the growth and development of cotton; to investigate the influence of different irrigation modes on the growth and development of cotton in the paper, it is assumed that all magnitudes of irrigation amount are the same at different irrigation modes, eight indexes about the growth and development quality are respectively monitored during the flowering and boll stages. Their results on the quality of growth and development of cotton are shown in Table 2.
The Establishment of Assessment Model
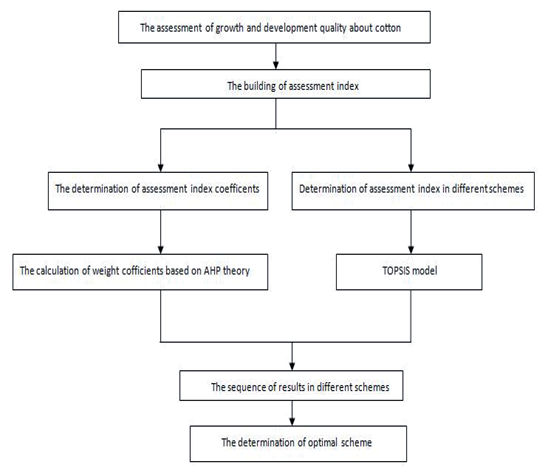
TOPSIS model is called a technique for order preference by similarity to ideal solution; it is applied to assess the multi-objective decision about the finite schemes. It has many virtues, for example, simple calculation and reliable results, so it is widely applied in hydraulic engineering. AHP theory in the paper is combined with TOPSIS theory to assess the quality of growth and development of cotton under different irrigation patterns, as presented in Fig. 2.
At first, to assess the growth and development quality, a complete assessment index system is built; and then assessment index coefficients is determined using AHP theory;the assessment index in the different schemes are determined by using the TOPSIS model; finally, the sequence of results in various schemes are performed, then the optimal scheme is obtained according to the sequence.
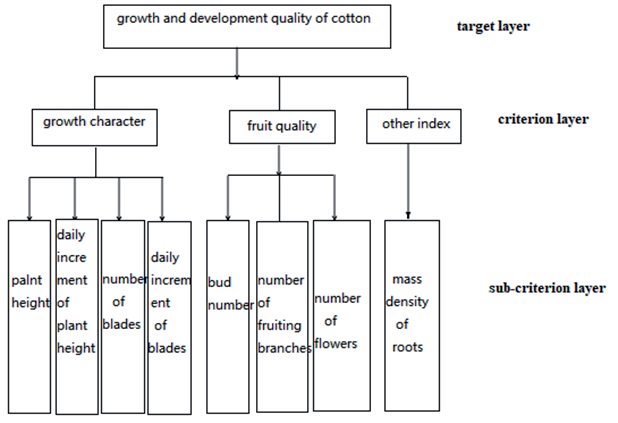
Because eight assessment indices are selected in the paper, and their influences on the growth and development of cotton are nonlinear, AHP method is adopted to estimate the weight coefficients of different indices [19]. The growth and development quality of cotton is selected as target layer at first; secondly, growth character, fruit quality and other index are selected as criterion layer; thirdly, eight assessment indices are selected as sub-criterion layer. Their relations are plotted in Fig. 3 as follows:
Table 1.
The layout of scheme in the experiment.
(2) The construction of weight coefficients about different indices
The consistent checking formula is expressed as follows [20]:
Where, CR is the random consistent ratio of judgement matrix; CI is the consistent index of judgement matrix; When CR<0.1, it means that judgement matrix has good consistency, the distribution of weight coefficients is rational, otherwise the judgement matrix need be adjusted until it meets with the consistency [21].CI can be expressed as follows:
Where, λmax is the maximum characteristic root; n is the order number of judgement matrix; RI can be obtained in Table 3 for the low-order judgement matrix 2. TOPSIS theory
The calculative procedure about TOPSIS theory is listed as follows:
The influential factors are used to establish the decision matrix, index factor set is X = (X1, X2,…, Xn), the decisive value corresponding to index factor Xi about scheme Ni is Zij, so its objective decisive matrix can be expressed as follows:
The standardized treatment about Eq. (4) is
performed, the normalized matrix V = (vij) can be obtained, its expression is [22]:
Table 2.
The results about the growth and development quality of cotton.
Where, vij represents the standard value of jth influential factor in ith scheme, when vij is multiplied with the coefficients of different influential factors, weighted Matrix F = (fij)m×n can be obtained, where fij = ωj ∙ vij (i = 1,...m; j = 1,.., n).
(3) The calculation of ideal positive solution x+ and negative solution x –
Ideal solution x+ and x – can respectively be expressed as [23]:
The distance Di + and Di – between different
assessment index and ideal solution can be determined, their expression can be respectively shown as follows:
The value of pasting schedule φi is calculated to
assess the good and bad of different schemes, and the sequence about φi is performed ; the scheme is better when the magnitude of φi is bigger; pasting schedule φi can be expressed as follows:
The projection pursuit algorithm is applied to
analyze and treat high dimensional data, especially it is valid to analyze high dimensional data about abnormal distribution;
Its basic theory is: high dimensional data is projected to low-dimensional subspace by using computer technology according to certain combination, and the projection to reflect the high-dimensional data structure or character can be found by minimizing the certain index projection. The data structure is analyzed in low-dimensional space to investigate and analyze the high-dimensional data. Its reduced-dimensional flowchart figure is plotted in Fig. 4.
Its calculative procedure is listed as follows:
(1) the selection of assessment index, and assessment index is performed normalization treatment
The matrix xij (i = 1, 2, ..., m; j = 1, 2, ..., n) is assumed; where, i is the number of schemes, j is the number of index; to erase the dimension of index factor and unify the range of index factor, the more and better index can be expressed as follows [23]:
The less and better index can be expressed as:
Where, xmin(j) and xmax(j) are respectively the maximum and minimum value of index factor in certain scheme; after normalization treatment is performed, the magnitudes of above index factors are limited [0,1]. (2)The establishment of projection index function
When m dimensional datum x(i,j), j = 1, 2, 3, ..., m; is reduced to 1D projection value b = (b(1), b(2), ..., b(m)), its projection expression can be depicted as:
Finally, the optimal selection of schemes are performed according to Z(i); b(i) is vector of unit length.
When synthetic projection is performed, the dispersion characteristics of projection value zi are required as: local projection points concentrate possibly; for the best, a number of point blob can be formed, the points between the point bobs can be scattered as much as possible. So objective function Q(a) can be defined as the product between the distance s(a) and density d(a) between the category, namely [24]:
In Eq. (16), z̄ a is the average value of {z(i)|i = 1, 2, ..., n}, the magnitude of s(a) becomes bigger, it means that the dispersion is more separate. The distance among the characteristic value of projection is set as rij = |zi – zk| (i,k = 1, 2, ..., n), then:

Where, f(t) is the first order heaviside function; When t≥0, its value is 1. when t<0, its value is 0. where,
The seeking of optimal projection direction can be transformed as the following problems:
The above formula is a complex nonlinear optimal problem about optimal variable a. The accelerated genetic algorithm is adopted to solve the optimal problem in the paper.
According to optimal projection direction, the difference level of projection value zi can be calculated; obviously, when the magnitude of zi is bigger, the corresponding scheme is better; finally, different schemes are respectively assessed.
Results and discussion
The Results and Discussion in the Experiment
Specific surveys are performed during the bud stage to assess the growth and development quality of cotton, and the results are shown in Table 2. It can be seen in Table 2 that under the first processing mode, relative to flood irrigation, the magnitude of the plant height under drip irrigation increases by 11.64%, the daily increment of the plant height increases by 22.22%, the number of blades increases by 6.86%, the daily increment of the blades increases by 25%, the number of fruiting branches increases by 24.39%, the bud number rises by 19.23%, the number of blossoms increases by 50%, and the mass density of the roots increases by 25%. Relative to flood irrigation, the magnitude of the plant height under subsurface irrigation increases by 21.14%, the daily increment of the plant height increases by 44.44%, the number of blades increases by 8.82%, the daily increment of the blades increases by 50%, the number of fruiting branches increases by 90.24%, the bud number rises by 36.54%, the number of blossoms increases by 100%, and the mass density of the roots increases by 52.8%. The growth and development quality of cotton under the subsurface irrigation mode is the best, that under the drip irrigation mode is second, and that under the flood irrigation mode is the worst.
Under the second processing mode, the results are similar to those of the first. Relative to flood irrigation, the magnitude of the plant height under surface irrigation increases by 11.9%, the daily increment of the plant height increases by 25%, the number of blades increases by 8.03%, the daily increment of the blades increases by 41.67%, the number of fruiting branches increases by 64.71%, the bud number rises by 28.17%, the number of blossoms increases by 55.65%, and the mass density of roots increases by 37.7%. Relative to flood irrigation, the magnitude of the plant height under drip irrigation increases by 6.15%, the daily increment of the plant height increases by 16.67%, the number of blades increases by 1.79%, the daily increment of blades increases by 16.67%, the number of fruiting branches increases by 23.53%, the bud number rises by 25.35%, the number of blossoms increases by 22.22%, and the mass density of roots increases by 21.31%.
Table 4.
The weight coefficients of different indices.
| Index | C1 | C2 | C3 | C4 | C5 | C6 | C7 | C8 |
|---|---|---|---|---|---|---|---|---|
| Weight coefficients | 0 . 0 5 9 | 0 . 1 3 4 | 0 . 0 2 8 | 0 . 0 7 6 | 0 . 1 6 0 | 0 . 2 9 1 | 0 . 0 8 8 | 0 . 1 6 3 |
Table 5.
The weighted value of index.
Under the third processing mode, the variability trends are the same as those of the two irrigation modes described above.
As shown in Table 2, when different irrigation amounts are discussed, relative to the irrigation amount G1, the magnitude of the plant height under irrigation amount G2 increases by 10.59%, the daily increment of the plant height increases by 15.38%, the number of blades increases by 9.01%, the daily increment of blades increases by 41.67%, the number of fruiting branches increases by 7.69%, the bud number rises by 28.17%, the number of blossoms increases by 75%, and the mass density of roots increases by 52.7%. Relative to the irrigation amount G2, the magnitude of the plant height under irrigation amount G3 is unchanged, the daily increment of the plant height increases by 13.33%, the number of blades increases by 6.6%, the daily increment of blades increases by 5.89%, the number of fruiting branches increases by 1.19%, the bud number rises by 5.49%, the number of blossoms increases by 7.14%, and the mass density of roots increases by 21.43%. It can be found from the above analysis that the magnitude of the irrigation amount G2 increases by 10% compared to that of the irrigation amount G1. Similarly, the magnitude of G3 also increases by 10% compared to that of G1. The variable range between G2 and G1 is more extensive than that between G2 and G3. Thus, conclusions can be drawn when irrigation modes with the irrigation amount G3 are adopted, the growth and development of cotton is the best, while the G2 amount is second-best. Comparing the three irrigation modes, subsurface irrigation under a film is the best, drip irrigation under a film is second, and flood irrigation is the worst.
Results and Discussion about Assessment Model
To analyze and compare, the results of two models are together discussed in the paper.
The weight coefficients about different indices based on Fig. 3 according to Eqs (2) and (3) can be obtained in Table 4 as follows:
Table 2 is the decisive matrix, the normalized decisive matrix Z can be obtained according to Table 2 and Eq. (5), it is shown in Table 5.
Ideal solution x+ and x – can be obtained according to Eq. (7) and (8); the distance Di+ and Di – between different assessment index and ideal solution, and the relative pasting schedule φi can respectively be obtained as follows according to Eq. (9), (10) and (11). Di+ = [0.0935 0.0751 0.0540 0.0580 0.0330 0.0167
Table 6.
The normalized results about assessment index.
0.0495 0.0218 0.0003]
Di– = [0 0.0189 0.0452 0.0365 0.0641 0.0797
0.0458 0.0768 0.0935]
φi = [0 0.2012 0.4556 0.3858 0.6604 0.8269
0.4805 0.7785 0.9968] (2) the results about accelerated genetic projection pursuit theory
According to Eq. (12) and (13), and in combination with Table 2, the normalized results are shown in Table 6.
Finally, the optimal projection direction can be obtained according to Eqs (14)-(18):
b = (0.35 0.3332 0.2906 0.386 0.363 0.3759
0.3585 0.36725)
To compare and analyze, the results obtained from two different theories are listed in Table 7.
It can be seen in Table 7 that the influences of the 9 different irrigation modes on the growth and development quality of cotton can be ranked as follows: G3> G2> F3> F2> E3> G1> E2> F1> E1. Namely, when the lower limit of irrigation is 70-75%, the cotton under subsurface irrigation is best, while that under drip irrigation is second best. When the lower irrigation limit is 50-55%, the growth and development quality under drip irrigation is second-to-last, while that under flood irrigation is the worst. It can also be found that the results obtained from the projection pursuit theory are consistent with those obtained from AHP-TOPSIS. When the results from the experiment are taken into consideration, it is found that the results assessed from the theory are also consistent with those obtained from the experiment. These conclusions demonstrate that the AHP-TOPSIS theory and the projection pursuit theory are feasible for optimizing cotton growth and development quality under different irrigation modes.
Conclusions
To improve the growth and development of cotton, nine different irrigation modes are introduced, so selecting the optimal irrigation mode becomes a compelling issue. In this paper, the various schemes are analyzed and compared in two different views: theory and experiments. The conclusions are listed as follows.
(1) When the different irrigation amounts are discussed in the experiment, the conclusions can be drawn that when irrigation modes using amount G3 are adopted, the growth and development of cotton is the best, while modes using amount G2 are second best. When comparing the three irrigation modes, subsurface irrigation under a film is the best, drip irrigation under a film is the second-best, and flood irrigation is the worst.
Table 7.
The results in two models under different irrigation modes.
| Irrigation modes | E1 | F1 | G1 | E2 | F2 | G2 | E3 | F3 | G3 |
|---|---|---|---|---|---|---|---|---|---|
| Pasting schedule | 0 | 0.6383 | 1.336 | 1.1352 | 1.8597 | 2.4293 | 1.338 | 2.1339 | 2.8 |
| Projection pursuit theory sequence | 9 | 8 | 6 | 7 | 4 | 2 | 5 | 3 | 1 |
| AHP-TOPSIS sequence | 9 | 8 | 6 | 7 | 4 | 2 | 5 | 3 | 1 |
(2) For the theory analysis, the rank of the influence on the growth and development quality of cotton of the nine different irrigation modes are G3>G2>F3> F2>E3>G1>E2>F1>E1. When the lower limit of irrigation is 70-75%, cotton’s growth under subsurface irrigation is best; when the lower limit of irrigation is 50-55%, that under flood irrigation is the worst. The results obtained from the projection pursuit theory are consistent with those obtained from AHP-TOPSIS, and the results assessed from the theoretical analysis are also consistent with those obtained from the experiment. These conclusions can provide great instructive significance for selecting optimal schemes for the growth and development quality of cotton under different irrigation modes in the future.

