

Introduction
Water resources are indispensable for human survival and social development, and they are the source of life for our product and progress [1]. However, with the rapid development of the global chemical industry and the rapid growth of the population, coupled with the uneven distribution of the global freshwater resources, global freshwater resources available for human use have been stretched to the limit [2]. Moreover, because a large amount of sewage is discharged into rivers, water quality is deteriorating increasingly, and the shortage of water resources and water pollution has become a common problem [3]. Hence, the water quality assessment has great significance nowadays [4].
Many researchers have performed many water quality assessment methods [5] in many countries. For example, Li et al. [6] applied multivariate statistical techniques to compare and evaluate the water quality of Australian downstream lakes under extreme drought and post-drought conditions; Koichi et al. [7] hope to simplify the format to develop a new, globally accepted “Water quality index,” the index could be used widely and could represent reliable water quality; Ivana I. et al. [8] put forward a comprehensive method of water quality assessment based on water quality index (WQI) and multi-criteria decision making (MCDM); Nele et al. [9] integrated multi-criteria decision-making analysis of water quality assessment and management support, and he provided decision-making support for water quality management in combination with the water quality index and management; Pandey et al. [10] assessed the ecological status of four major Korean rivers by using physical chemistry analysis and various descriptive methods based on diatomic combinations of the substrate; Aoudia et al. [11] applied the water quality index method to assess the vulnerability of Algiers, the capital of Algeria, the way takes into account both water demand and water supply; Baat et al. [12] studied chemical analysis of water quality index evaluation, and effect-based water quality assessment allowed site prioritization based on ecotoxicological risks; Juliana M et al. [13] carried out a study on the Kunza, Dande, and Bengo Rivers by using principal component analysis, and he developed a new water quality index that enables the quantitative expression of water quality at these locations; Zhang et al. [14] used a fuzzy method to analyze and evaluate the spatial-temporal characteristics of water quality in the Zigong section of the Tuo River from 2013 to 2018, and predictions are performed. When multiple objectives, multiple pollution sources and external conditions of water quality change with time are considered, Schuwirth [15] proposes a continuous evaluation model from zero to one based on the multi-attribute value theory.
Although the above methods predict water quality from different viewpoints and have achieved a specific prediction effect, they still have some areas for improvement [16]. For example, complex calculation processes, neglected randomness and low efficiency, et al. To overcome the insufficiency of the above methods, the Evidence-entropy weight gray incidence theory is introduced to assess the water quality level; the technique applies the entropy weight method to determine the weights of each evaluation index, and then the gray comprehensive correlation method is used to calculate the certainty and uncertainty reliability of each index. Finally, a fundamental probable distribution function matrix is constructed, and the assessment level of water quality is determined.
The paper is organized as follows: in Section 2, the engineering overview are introduced at first; in Section 3, theory and methodology based on the Evidence-Entropy weight gray incidence theory is introduced; in Section 4, the assessment model of the water quality level is constructed, and the assessment results are analyzed; in Section 5, discussions and comparative analysis are performed; in Section 6, conclusions are drawn.
Materials and Methods
Engineering Overview
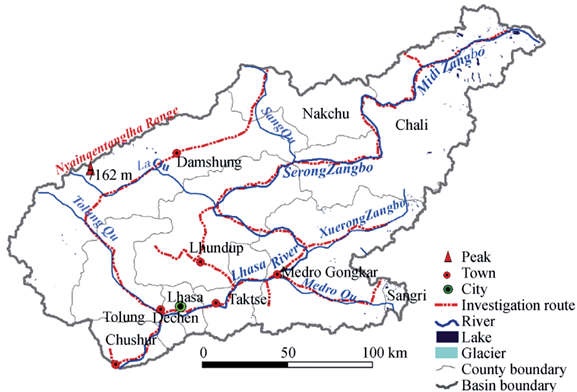
The Lhasa River originates at the southern foot of the Nyenchen Tanglha Mountains at the Poncho la Kongma trench in Lhari County, Tibet, China. It is bounded by the Salween River valley in the north and northeast; in the east, it joins Palomzangbo and Nyang Rivers. Its south is the mainstream of the Yarlung Tsangpo River. Its western and northwestern parts are the inner stream system of northern Tibet; its location is plotted in Fig. 1. The inlet is 3580 meters above sea level with a total drop of 1620 meters, the length of river basin is 551 km, and it covers an area of 32471 km2 and accounts for 13.5% of the Yarlung Tsangpo River valley. The mountain peaks in the northern part of the basin are 5000-5500 meters above sea level, and the valley floor is 4000-4500 meters above sea level. The Lhasa River basin has a mild climate, flat terrain, thick soil, and abundant water resources, it is one of the major grain-producing areas in Tibet, so it significantly impacts the economic development of Lhasa.
The Determination of the Evaluation Index
In this paper, the monitoring point in Maizhokunggar County, Yangbajain, Duilong Deqing County, Lhasa City, and Dagzê County of the Lhasa River basin are adopted as the investigation object. The data were collected from the 2011 water quality monitoring data at the Tibetan Autonomous Region Sha Tsui Environmental Monitoring Centre station; eight routine monitoring items of water quality at each monitoring point were analyzed, it including PH (X1), DO (X2), COD (X3), CODMn (X4), Ammonia nitrogen (X5), Total cyanide (X6), Total phosphorus (X7) and Fluoride (X8); their average value of monitoring index at the A1-A5classic cross sections are shown in Table 1. And according to ''Environmental Quality Standard of surface water'', the seven assessment indices of water quality can be classified as five levels as shown in Table 2, level I (very good), level II (good), level III (common), level IV (bad) and level IV (worse).
The Evidence Theory
It is assumed that questions to be assessed is q, a collection of all possible results is Θ = {F1, F2, F3, ..., Fd}; where, Θ is identification framework; the set of factors that determine the result is E = {E1, E2, E3, ..., Ed}, Ei is the evidence body; assuming that a set function m:2Θ→[0,1] meet with
So the basic reliability m(F) of F under the action of all body of evidence is [17]:
Where, k is normalization coefficient.
Table 1.
The monitoring datum.
| Index | X1 | X2 | X3 | X4 | X5 | X6 | X7 | X8 |
|---|---|---|---|---|---|---|---|---|
| A1 | 8.6 | 6.4 | 14 | 2.29 | 0.65 | 0.004 | 0.05 | 0.24 |
| A2 | 9.1 | 4.7 | 18 | 2.23 | 0.94 | 0.005 | 0.10 | 2.38 |
| A3 | 8.55 | 6.5 | 16 | 2.12 | 1.12 | 0.006 | 0.05 | 0.9 |
| A4 | 8.45 | 7.0 | 15.2 | 1.96 | 0.91 | 0.004 | 0.05 | 0.24 |
| A5 | 8.7 | 5.7 | 15.5 | 2.02 | 0.85 | 0.004 | 0.06 | 1.70 |
Table 2.
The classification standard of water quality.
Construction of Basic Reliability Distribution Function
The reliability of the evidence body is influenced by the reliability of the information source and its value. The reliability of the information source can be reflected based on its certainty reliability si and uncertainty reliability mi(δ); among them, the certainty reliability represents the probability that the object is identified. The greater the certainty reliability is, the more reliable the information source is, and the higher the reliability is. The evidence body is divided into the positive index and negative index; the characteristic of positive index demonstrates that with the increase of index value, the probability of event is greater, and the reliability is higher; the inverse index has the opposite characteristic, as the likelihood of the event is smaller, the reliability becomes lower.
Suppose that there are n categories of a problem, and the results of the classification are influenced by d-type evidence. R(+) is a matrix composed of upper limits of evaluation index intervals corresponding to different classifications, R(–) is the matrix of the lower limit of the evaluation index interval, their expression is listed as follows:
Let Pi be the reliability generated by evidence xi, and the basic reliability distribution is
Where, the corresponding positive indicator is
The corresponding inverse index is
The Construction of Assessment Systems
By substituting the corresponding indexes at the critical points of the classification grades in Equations (3) and (4) into Equation (5), the reliability of the classification limits of the indexes M is obtained as follows [18]:
(8)
All row vectors and uncertainty reliability {m1(δ), m2(δ), m3(δ), ..., md(δ)} in matrix M are substituted into formula (1), the critical reliability of each grade is obtained as follows:
Finally, the subjects were classified according to the different intervals of the synthetic reliability of q.
The Calculation of Determination Reliability Based on the Entropy Weight Gray Correlation Method
In order to determine its reliability objectively and reasonably, the entropy weight gray correlation method is used. Firstly, the weight of each index is calculated by entropy theory, and then the reliability of each index is determined by gray correlation method.
(1) The determination of weight coefficients
The membership index gij of target i under index j is first determined, and objective membership degree matrix G = (gij)m×n is constructed; the normalized target membership matrix G = (gij)m×n is obtained as [19]:
The entropy of index j is
The weight of indicator j is
Where, 0≤ωj≤1 and
(2) Determination of basic reliability distribution function
Let Rij be the comprehensive gray correlation coefficient. In this paper, the comprehensive correlation method is used to calculate the correlation coefficient to avoid the distortion results obtained by using the optimal and the worst correlation alone. The calculation of rij is listed as follows:
The optimal correlation coefficient rij+ is [20]
The worst correlation coefficient rij– is
Where,
Substituting rij into formula (17), the uncertainty reliability D(Ij) of each index can be obtained, the corresponding certainty reliability is 1-D(Ij).
The q-order uncertainty reliability of indicator j is
Where, q = 2.
The basic reliability distribution function for different targets of each index is
Where, mj(i) is the basic reliability distribution function of target i under the action of index j, and
Results and Discussion
The Construction of Assessment Model
(1) The construction of the evaluation frame
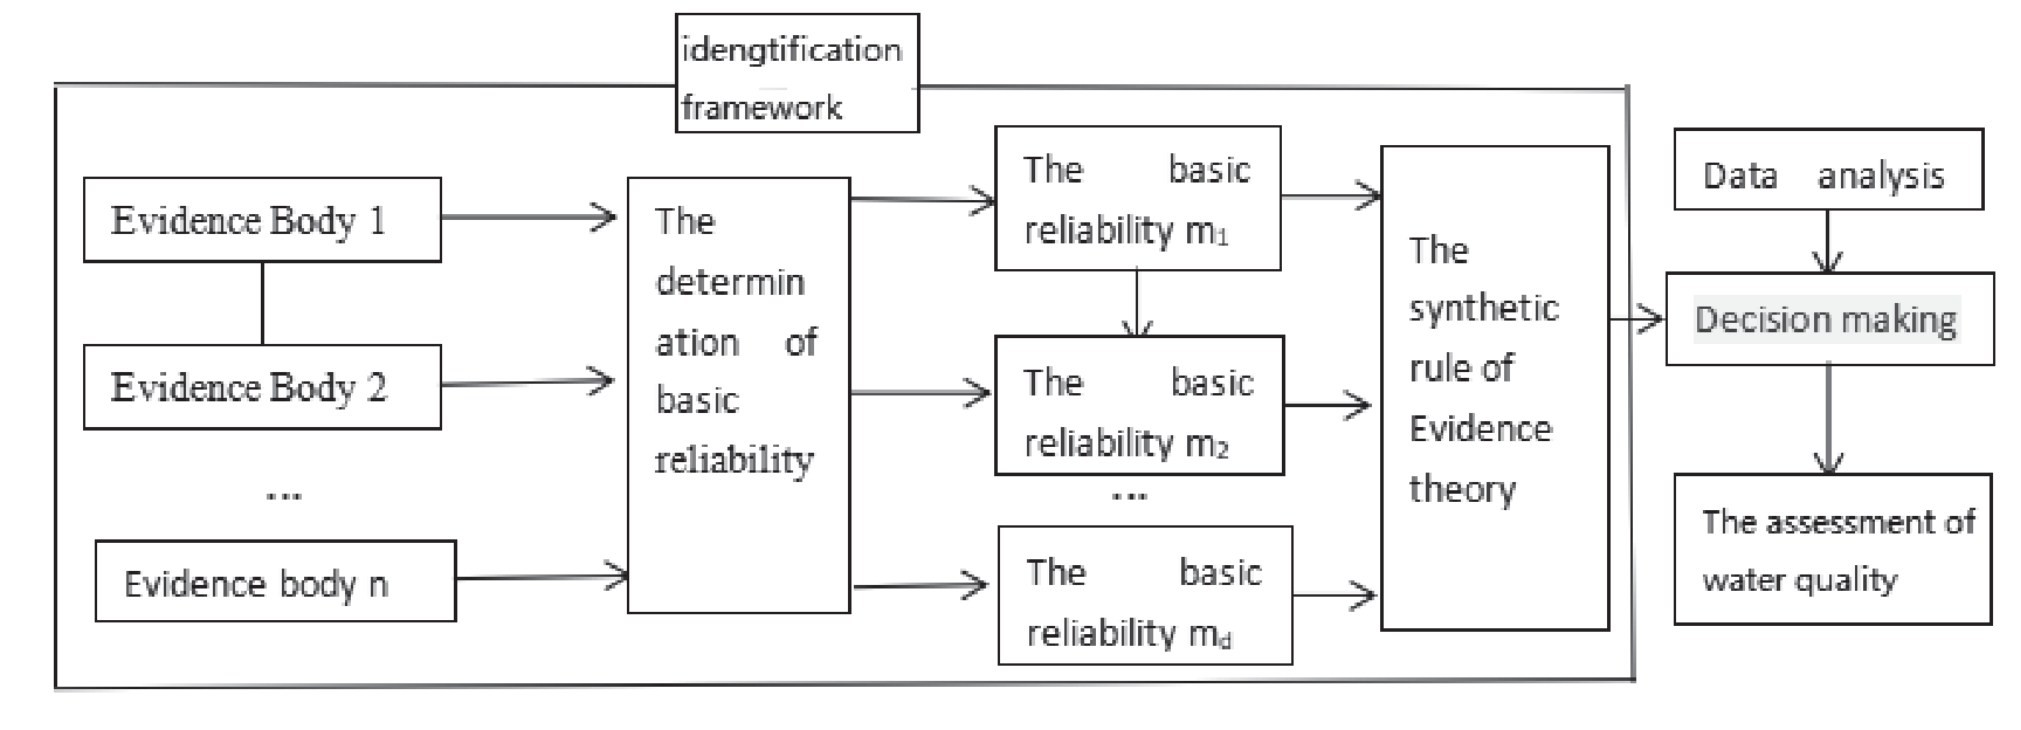
To evaluate the water quality in Lhasa River, a new suggested model is constructed; its schematic diagram is plotted in Fig. 2. At first, the different evidence body of classification standard is collected, then according to the above evidence body, the essential reliability can be determined by using the Entropy-Weight gray theory; secondly, according to the relevant essential reliability, the synthetic rule of evidence theory is performed, their results are regarded as the identification framework; thirdly, the actual monitoring data is analyzed, and the decision making is performed in the identification framework; finally, the model of water quality assessment is constructed, and evaluation results are obtained.
(2) Determining the certainty reliability
It can found that the risk grade increases with the increase of magnitudes of the indicator X1, so it is an inverse index; the rest of indicators in the Table 2 are positive indicators, based on Eq. (3) and (4), and in combination with the Table 2, the classification matrix of water quality assessment can be shown as:
Based on Table 1, and in combination with the Eqs (10)-(12), the weight coefficients of different indicators can be obtained as:
According to Eq. (13), the weighted membership degree matrix can be expressed as
The ideal optimal sequence is
The ideal worst sequence is
The maximum difference and minimum difference respectively are:
Based on Eq. (16), the gray correlation coefficient matrix can be obtained as follows:
According to Eq. (17), the uncertainty reliability of different indices is obtained as
According to Eq. (18), the Mass function of different indicators can be expressed as:
Based on Eqs (19)-(20), the total certainty and uncertainty reliability can be shown in Table 3.
(3) The calculation of identify frame
Substituting the data in Table 1 and the index value in the classification boundary into Eq. (5), the distribution function of essential basic reliability is constructed, and then the synthesis between different confidence intervals is performed. Their results are shown in Table 4.
(4) Determining the assessment level of the water quality
The data of A1 is adopted as an example, substituting these data into Eqs (1) and (2), the primary reliability distribution of A1 can be shown in Table 5.
Similarly, the synthetic reliability of A2-A5 can be calculated in Table 6, respectively.
The Evidence-Entropy weight gray incidence theory is applied to evaluate the water quality assessment. The assessment results are respectively shown in Table 6. It can be found from Table 6 that the assessment levels of the water quality from A1 to A5 cross sections are different. The assessment level of water quality at A2 and A5 cross sections is III; one at the rest cross sections is II, which means that the assessment level of water quality at A2 and A5 cross sections is good. One at the rest cross sections are common, the qualified rate of water quality level in all cross sections arrive at 100%. However, for A1 to A5 cross sections, the necessary prevention measurement should be taken to avoid the deterioration of water quality; for example, the clean-up operation of river channel should be performed, et al.
Table 3.
The reliability of evidence body.
| Evidence body | X1 | X2 | X3 | X4 | X5 | X6 | X7 | X8 |
|---|---|---|---|---|---|---|---|---|
| si | 0.8883 | 0.8883 | 0.8881 | 0.8882 | 0.8884 | 0.8872 | 0.8812 | 0.8222 |
| mi(δ) | 0.1117 | 0.1117 | 0.1119 | 0.1118 | 0.1116 | 0.1128 | 0.1188 | 0.1778 |
Table 4.
Classification standard of identification frame.
| Grade | I | II | III | IV | V |
|---|---|---|---|---|---|
| Reliability intervals | <0.4999 | [0.4999 0.9645] | (0.9645 0.9995] | (0.9995 1) | ≥1 |
Table 5.
The basic reliability distribution of A1 cross section.
Table 6.
The predicting result of water quality.
According to the comparative results of the assessment model in Table 6, conclusions can be drawn that the results obtained by the suggested method are consistent with the investigation for five different cross-sections. Its accuracy reaches 100% for the proposed method, which is higher than the results from the statistical probability and comprehensive fuzzy approach (60%) [21]. So the conclusion demonstrates that it is feasible to estimate water quality levels using the Evidence-Entropy weight gray incidence theory model. And the method can provide more details for assessing water quality level; for example, the COD of water quality at the A3 cross section is 16, which should belong to level III based on Table 2. In addition, the primary reliability distribution of the other indicators obtained by using the suggested model belongs to level II, so the quality level probability of the A3 cross-section at level II is higher than that of groups I, III, and IV. So the water quality level at the A3 cross-section only belongs to level II and almost impossibly belongs to levels I, III, and IV. Furthermore, the risk level of the A3 cross-section is more likely to be level III than that of the A1 cross-section because the synthetic reliability(0.947) of the A3 cross-section for group III is higher than that of the A1 cross-section (0.8272). The results obtained using the suggested model accurately demonstrate the assessment level of water quality and further determine the quality grade ranking for different cross sections at the same level.
Discussions
The evidence theory is applied to fuse the evidence body of various information resources; the assessment results demonstrate the interaction of different factors; relatively to the statistical probability and comprehensive fuzzy method, it can improve the predictive accuracy and determine the certainty reliability of other evidence bodies, the difference of importance between various evidence bodies can be reflected. So the suggested model enhances the predictive efficiency of water quality levels.
In comparison with the traditional method, its assessment result has higher reliability and efficiency, and an interval scale can be taken into consideration in the evaluation process,so the suggested theory can well predict the grade criterion which are interval form.
Conclusions
Considering PH (X1), DO(X2), COD(X3), CODMn (X4), Ammonia nitrogen (X5), Total cyanide (X6), Total phosphorus (X7), as well as the Fluoride (X8), a new evaluation method is introduced in this paper to assess the level of water quality based on the Evidence-Entropy weight gray incidence theory. The eight different evidence bodies are determined at first. Then the certainty reliability of other evidence bodies is calculated using the entropy weight-gray correlation method. Finally, the synthetic reliability of the water quality level is calculated using the evidence theory, and the assessment level of water quality is determined.
The proposed method is applied to assess the level of water quality in the Lhasa River; conclusions can be drawn that the results obtained by the proposed method are entirely consistent with the actual investigation for five different typical cross sections. Its accuracy reaches 100% for the suggested method, which is higher than the statistical probability and comprehensive fuzzy approach. The results obtained using the suggested model accurately demonstrate the assessment level of water quality and further determine the risk grade ranking for cross sections at the same level.

