

Introduction
Microplastics, which are plastic particles smaller than 5 mm, have become topical in global environmental research. Studies have shown that the distribution range of microplastics is widespread, from the deep sea of the North Atlantic [1] to the distant Antarctic and Arctic regions [2] or inaccessible plateau areas [3]. In recent years, the research focus of domestic and foreign scholars has turned to surface water. Gao et al. reported the presence of microplastics in European rivers [4], and a study by Yu et al. revealed the distribution of microplastics in the Great Lakes [5]. Notably, a study by Schönlau et al. confirmed that microplastics are present in all surface waters in Sweden [6]. These studies show that microplastic pollution has become widespread worldwide and potentially threatens ecosystems. In recent years, Chinese scholars have studied the Haihe River [7], Yellow River [8], Taihu Lake [9], Poyang Lake [10], and the Yangtze River and its tributaries [11], conducting surveys of microplastic pollution. These studies revealed a wide range of microplastic sources, including personal care product use [12], sewage discharge [13], agricultural film crushing [14], tire wear [15], maritime transportation [16], and aquaculture [17], highlighting the severity of microplastic pollution. Hence, the environmental impact of microplastics cannot be ignored. Not only do they pose a direct threat to aquatic ecosystems, but they may also have indirect effects on human health through food consumption. Studies have shown that microplastics can often act as carriers of other pollutants, capable of adsorbing various heavy metals [18], persistent organic pollutants [19], and harmful substances such as additives and unreacted monomers [20]. They may even be ingested by marine organisms [21] and inadvertently be transferred to sources of food [22]. Given the unique toxicity of microplastic pollution and its potential risks to the ecosystem, effective measures must be taken to mitigate the negative impact of microplastics on the environment and human health.
The Chishui River Basin is located in southwest China, in the transition zone from the northern edge of the Yunnan-Guizhou Plateau to the mountainous area around the Sichuan Basin, with a total length of 444.5 km and a drainage area of 20,400 Km2. The terrain is undulating with a typical subtropical monsoon humid climate. The watershed’s hydrology is affected by monsoons, with evident seasonal precipitation changes. The region’s economy is primarily based on agriculture, with a growing industrial sector, including the production of Chinese liquor. Anthropogenic activities such as agriculture, industry, and urbanization lead to increased water stress in the basin. Hence, the ecological protection of the Chishui River is of great importance. At present, conventional detection methods for studying microplastics in the marine environment include Fourier Transform Infrared Spectroscopy (FTIR) and Raman Spectroscopy. However, these two methods are based on visual screening, which is cumbersome and time-consuming. Furthermore, the fluorescence of other substances may interfere with this analysis process, which is a particular concern of Raman spectroscopy [23]. Importantly, these traditional detection methods cannot detect microplastics with diameters below 100 μm [24]. Scientists have begun to explore new technologies to improve the efficiency and accuracy of microplastic detection. The Agilent 8700 laser direct infrared (LDIR) technology, an emerging microplastic detection method, demonstrates the advantages of speed and automation [25]. LDIR technology can eliminate redundant data, analyze mixtures of microplastic samples without visual preselection, effectively reducing the interference of human factors, and identify smaller microplastic particles more quickly and accurately than traditional methods, providing more reliable information on the distribution of microplastics in the environment.
Therefore, in this study, the Chishui River surface water was analyzed using LDIR to determine the distribution and characteristics of microplastic pollution. Then, the pollution level and potential ecological risk of microplastics in the surface water were evaluated in order to provide a scientific basis for the environmental protection of the Chishui River Basin.
Materials and Methods
Sample Collection
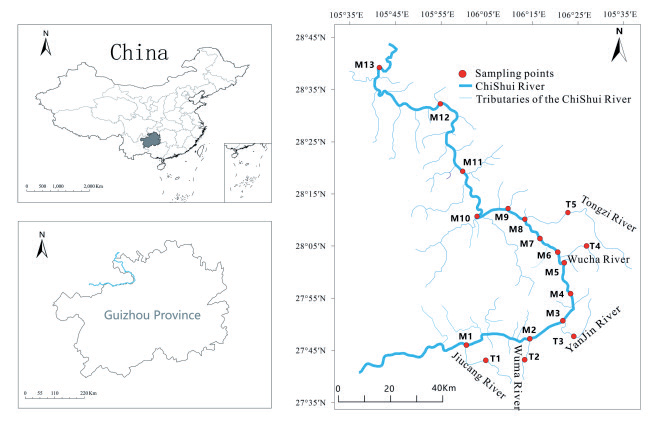
As shown in Fig. 1, 18 sampling points were collected along the upper, middle, and lower reaches of the Chishui River and its main tributaries in November 2022. To avoid plastic contamination, samples were collected using glass containers. Irrigation and cleaning were performed on each container three times before sample collection to reduce sampling errors. Due to the small volume of each water sample, manual direct collection of water samples was performed. At each sampling point, 2.5 liters of surface water were collected from the river center. To maximize the homogeneity of samples, triplicate samples were collected every 5 min and combined to form a composite sample. During sampling, leaves, sticks, and other sundries were avoided, as well as the violent agitation of water bodies. Samples were taken with the mouth of the water bottle facing the direction of the flow. A volume of 10% of each sample container was reserved to enable the shaking and mixing of the samples. After sample collection, all composite samples were stored at 4ºC and immediately transferred to the laboratory.
Sample Processing
After each water sample was weighed and recorded, the filter membrane was immersed in ethanol solution for 30 min and treated with ultrasound so that the substances on the filter membrane were dispersed into the ethanol solution. The filter membrane was removed from the ethanol solution and cleaned several times with ethanol. A 30% hydrogen peroxide solution was added to the ethanol solution to remove organic matter. The mixture was stirred for 24 h to allow the hydrogen peroxide to fully react with the organic matter. The digestion solution was filtered under a vacuum using a steel membrane with a pore diameter of 13 μm. The obtained filter membrane was placed in a sample bottle and immersed in the ethanol solution for 30 min to allow the substances on the filter membrane to disperse in the ethanol solution. After removing the filter membrane from the ethanol solution and cleaning it with ethanol several times, it was concentrated to 150 μL in an infrared drying oven and dripped on highly reflective glass. LDIR was performed after the ethanol was completely volatilized.
Sample Characterization
An LDIR (8700, Agilent, USA) was used to qualitatively analyze microplastics. The processed microplastic samples were transferred to a Kevley window, and the particle analysis mode was selected. The microplastics in the selected area on the Kevley window were located, identified, and photographed at 1800 cm-1 using the LDIR imager software (Clarity). The software captured and identified the infrared spectra of the microplastics in the selected area. The method for establishing the microplastics spectrum library was selected and matched with the equipment database. An automatic detection method (matching degree >85%, particle size range 20-500 μm) was used for detection. In the process of comparing the Clarity software with a standard library, results with a matching degree higher than 65% were used for qualitative analysis. Studies have shown that when the matching degree is only 65%, the obtained polymer identification is often quite different from the actual identification [26]. Therefore, to improve the accuracy of the analysis, it was necessary to further screen the test reports. In this study, particles with a matching degree greater than 85% were screened, and non-plastic particles, such as cellulosic, coal, chitin, and ammonium polyphosphate (APP), were eliminated. The lowest matching degree used was 85.02%, and the highest was 98.34%. This improved the credibility of the data analysis.
Quality Control
During the collection and laboratory analysis of samples, using non-plastic materials was strictly adhered to in order to avoid plastic pollution. Specifically, throughout the experiment, the experimenters wore nitrile gloves, cotton masks, and cotton lab suits throughout the experiment. All solvents were filtered through a 0.45 um PTFE filter membrane before use, and all experimental consumables were glass products. The glass products were washed three times with ethanol before use and then dried. Prior to the LDIR testing, all procedures were performed in fume hoods to reduce airborne pollution. To track the occurrence of suspected plastic contamination, two blank samples (deionized water) were used as controls and analyzed with the experimental samples using the same method. Table S1 shows that there were no microplastic particles in the two blank samples, indicating that there was no microplastic pollution during the experimental analysis. In addition, parallel samples were randomly selected at a rate of 20%, and their relative deviation was less than 5% in accordance with the requirements of the test.
Evaluation Methodology
At present, there is no ecological standard for microplastic pollution. The general risk assessment methods for microplastics used locally and globally primarily include the polymer hazard index (PHI), pollution load index (PLI), and pollution risk index (PRI) methods. These three methods can be used to evaluate the risk of microplastics individually and can be combined and cross-validated to ensure that the risk assessment of microplastics is more accurate and comprehensive. In this study, the overall PHI, PLI, and PRI of microplastics were calculated for the surface water of the entire Chishui River Basin in order to assess the risk of microplastics pollution in the river basin.
PLI
The PLI evaluates the load of pollutants in an area as a whole. This method reflects the degree of pollution in independent sampling points and evaluates the pollution of a certain area synthetically and the degree of contribution of pollutants in the area intuitively. The calculation method is shown below in formulas (1)- (3) [27].
where Ci is the abundance of microplastics at a sampling point; Coi is the standard reference value; in this study, the safe level of microplastics in surface water calculated by Everaert et al. [28] (6.65 n/L) was used; CFi is the pollution factor of microplastics at a sampling point; PLI is the microplastic pollution load index of a sampling site; n is the number of sampling sites; and PLIZone is the microplastics pollution PLI of the Chishui River. The degree of pollution is shown in Table 1.
PHI
There are limitations to evaluating the risk level of microplastics solely based on their abundance because different types of microplastic polymers have different toxicity hazard scores [29]. Thus, the PHI assesses the chemical toxicity risks of different types of microplastics on the ecological environment and quantifies each microplastic’s environmental impact. These are then combined to show the degree of harm to the ecological environment caused by microplastics. The calculation method is shown in formulas (4)–(5).
where PHIi is the risk index of microplastic pollution at sampling point i, Pn is the percentage of each microplastic polymer type at each sampling site, Sn is the hazard fraction of plastic polymers as shown in Table 2, and PHIZone is the microplastic pollution PHI of the Chishui River. The degree of pollution is shown in Table 1.
PRI
By combining the PLI and PHI, the PRI can be used to assess microplastic pollution in the environment, as shown in formulas (4)–(7) [30].
where PRIi is the microplastics PRI of sampling point I and PRIZone is the overall pollution risk index of the Chishui River. The degree of pollution is shown in Table 1.
Results and Discussion
Spatial Distribution of Microplastics in the Chishui River Basin
Fig. 2 shows that microplastics were detected at 18 sampling sites, indicating that the Chishui River Basin is widely polluted by microplastics. Microplastics ranged from 9.34 to 69.67 n/L, with an average abundance of 24.87 n/L. The abundance of microplastics in the main water stream ranged from 9.91 to 69.67 n/L, with an average abundance of 23.74 n/L. The abundance of microplastics in tributaries ranged from 9.34 to 60.10 n/L, with an average abundance of 27.85 n/L. Microplastic pollution in tributaries was more serious than that in main streams. This may be because tributaries, as the direct receiving water body of microplastic pollution, have a “two-phase property”; that is, tributaries are not only the “carrier” of microplastics but also the “sink” of microplastics [31]. As the distance between the tributary source and the main stream increases, the retention effect of the tributary is prominent, and microplastics converge in the watershed, thus aggravating the microplastic pollution in the tributary. In addition, there were complex and uneven patterns of microplastic abundance along the Chishui River. This may be due to the presence of microplastics associated with various distribution drivers, including but not limited to population density, industrial buildings, and natural factors [32].
Table 1.
Pollution loading index (PLI), polymer hazard index (PHI), and pollution risk index (PRI).
| PLI | Pollution level | PHI | PRI | Pollution level |
|---|---|---|---|---|
| <1 | Mild | <10 | <150 | Ⅰ |
| 10-100 | 150-300 | Ⅱ | ||
| 1-2 | Moderate | 100-1,000 | 300-600 | Ⅲ |
| 1,001-10,000 | 600-1,200 | Ⅳ | ||
| >2 | High | >10,000 | >1,200 | Ⅴ |
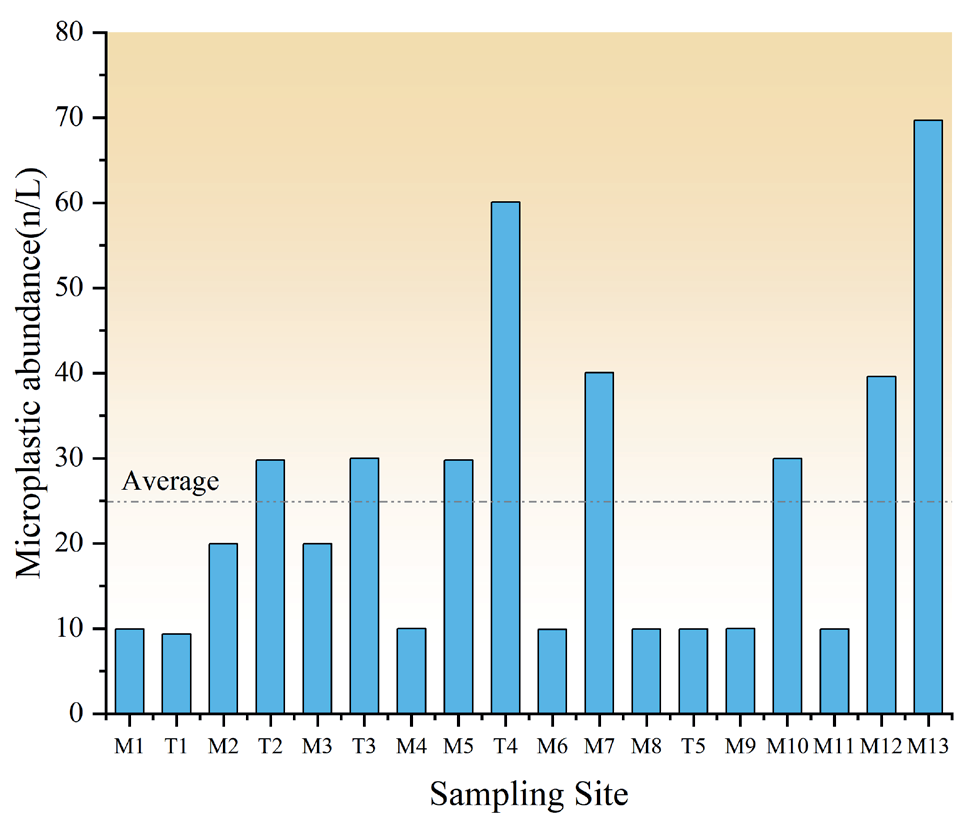
Microplastics originate exclusively from humans [33]. The microplastic abundance was highest at sampling site M13, at 69.67 n/L. Sampling points M12 and M13 are located upstream and downstream of Chishui City, respectively, close to urban areas with dense populations and frequent human activities. Furthermore, M13 is close to Chitianhua, and pollution at this site may be caused by solid waste and wastewater discharged after industrial production [34]. The abundance of microplastics at T4 was second only to M13. This may be because T4 is located near the Dashaba Reservoir. Partially or fully enclosed water bodies, such as lakes and reservoirs, have relatively stable hydrological conditions, which are conducive to the deposition and retention of microplastics, thus becoming microplastic “sinks” [35]. Furthermore, tourism development leads to intensive human activities, exacerbating microplastic pollution. The microplastic abundance at M7, located under the Chishui River tourist highway, was 40.05 n/L. This is 1.61 times higher than the average. As mentioned above, the abundance of microplastics is closely correlated with human activities. Freshwater pollution from microplastics is higher in developed urban areas with frequent human activities. Differences in the abundance of microplastics between cities may be primarily influenced by the level of urban development [36]. Among the study sites, T1 had the lowest abundance of microplastics. The low microplastic abundance may be due to the sampling site being located in a rural area with a small population and no surrounding large industrial or agricultural sites. In summary, microplastics accumulated from upstream to downstream waterways were evident, with microplastics showing point-source pollution. Differences in microplastic abundance appeared to be closely related to human activities and industrialization.
Characteristic Composition of Microplastics in the Chishui River Basin
Dimensions
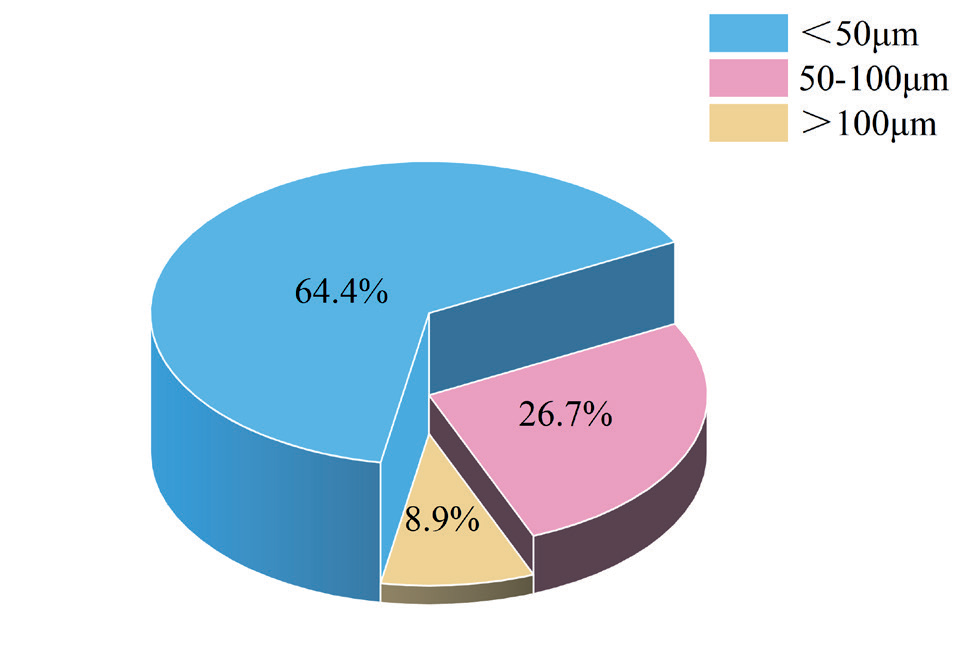
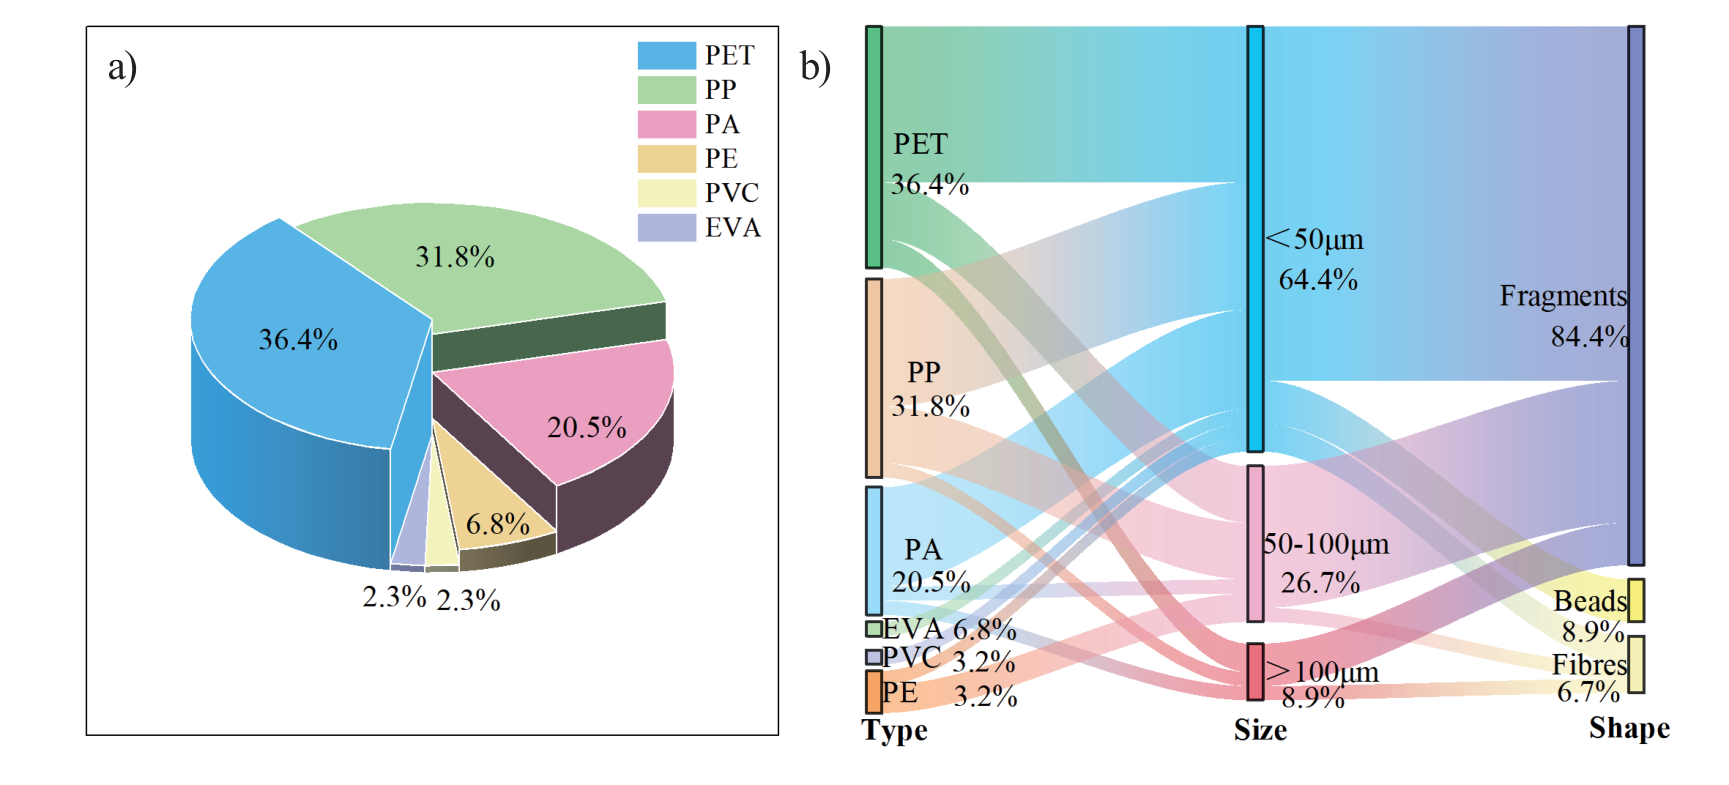
Three microplastic categories were found in the Chishui River Basin: <50 μm, 50-100 μm, and >100 μm. The proportions of microplastics in each size category are shown in Fig. 3. Microplastics smaller than 50 mm accounted for 64.44% of the total, with the proportion of microplastics decreasing with increases in microplastic size. This may be due to the high average flow rate of approximately 101×109 m3 in the Chishui River. Due to this rapid flow, large plastic sheets will decompose into small plastic sheets [37]. Meanwhile, in response to external factors, including ultraviolet irradiation, weathering, and river water impacts, larger-sized microplastics gradually decompose and form smaller-particle microplastics with stronger impact resistance. These can exist more stably in natural water [38]. River environments tend to have a higher abundance of smaller-sized microplastics [39]. Importantly, small-sized microplastics are often carriers of other pollutants, which can absorb persistent organic pollutants [40], heavy metals [41], and antibiotics [42], leading to their bioaccumulation in marine and terrestrial environments [43]. Thus, a large amount of small microplastics in the Chishui River Basin may negatively impact the aquatic ecosystem. As such, it is imperative that future research examines the health effects of small microplastic pollution in urban waters.
Shape
Microplastics can be classified into five types according to their shape: beads, fragments, fibers, films, and foams [44]. This study used the width, height, roundness, and hardness of microplastics to determine their shape. Objects with an aspect ratio greater than three were defined as fibers, objects with a roundness of 0.90 or greater were defined as beads, and all other objects were classified as fragments [45].
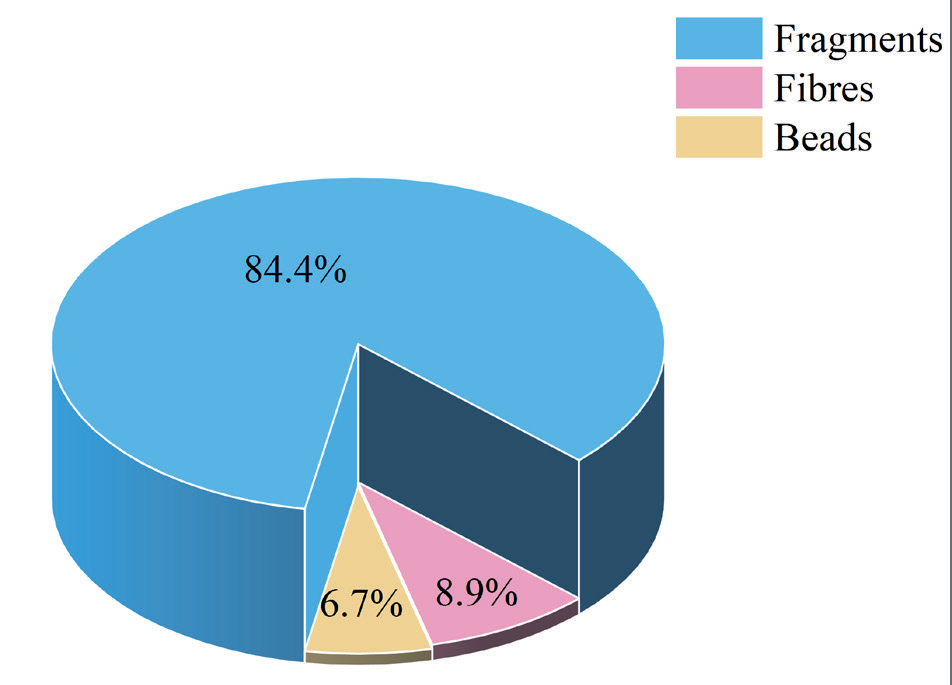
According to Fig. 4, microplastics in the Chishui River were predominantly fragments (84.44%), followed by fibers (8.89%) and beads (6.67%). Based on this, it can be concluded that secondary microplastics are the main type of microplastics in the Chishui River. Typically, microplastic debris is formed when larger plastics fragment or decompose [46], such as agricultural greenhouse coatings, packaging bags, and plastic containers [47]. Microplastic debris is also produced by rubber particles from tires [48]. Fibrous microplastics originate primarily from domestic wastewater discharge [49], suspended atmosphere [50], and fishing nets. Since fishing is completely banned in the Chishui River Basin and all fishing activities are prohibited, the fibrous microplastics in the Chishui River Basin do not derive from fishing activities [51]. Densely populated areas tended to contain sites with high fiber content, suggesting that domestic sewage may be one of the important factors leading to the increase in the fiber contents of these sites. Particles were the least abundant microplastics, accounting for only 6.67% of all identified microplastics. Particles are mostly virgin microplastics, mostly deriving from raw materials in the plastic industry, such as cosmetics, air sandblasting agents, and industrial cleaners, and are caused by direct emissions from industrial production activities [52]. The high particle contents at M4, M7, and M8 are mainly because these three sampling sites are located in light industrial areas.
Analysis of the Polymer Types and Sources
As shown in Fig. 5a), the microplastic particles detected in the surface water of the Chishui River were composed of six different polymers: PET, PP, PA, PE, EVA, and PVC. PET, PP, and PA were the most common microplastics detected in the Chishui River. The detection rate for PET was highest (35.56%), followed by PP (31.11%) and PA (20.00%). EVA and PVC detection rates were the lowest, at 2.22%, respectively. Therefore, PET, PP, and PA are the most widely distributed polymers in the surface waters of the Chishui River.
As shown in Fig. 5b), PET (24.44%) and PA (11.11%) were predominant in fragments <50 μm in the Chishui River, followed by PP (11.11%). Research shows that plastic bottles, agricultural plastic films, food packaging bags, and other rigid plastic products produce fragmented PET and PP [53], which enter urban rivers via surface runoff [54] and atmospheric deposition [55], among other sources. As an engineering plastic, PA is widely used to manufacture mechanical parts, automobile parts, electronic and electrical accessories, etc. Fragmented PA may originate from industrial production or sewage discharge [56]. Most of the watersheds assessed in the study area are located in Renhuai City, a city known as the “Liquor Capital of China”, which not only occupies a pivotal position in the liquor industry but also has a complete industrial chain from sorghum and wheat cultivation to liquor production and packaging. Therefore, the high proportion of plastic debris, such as PET, PA, and PP, in the study area mainly comes from using agricultural films and packaging waste after liquor production. In daily life, PET and PP are the primary raw materials for textile products, and the process of washing and using these products enriches the surface water with fibers. Research indicates that 35% of textile fibers from clothing enter the water and sea during washing, serving as a major source of microplastics [57]. Notably, common types of microplastics in Chasui Hanoi included PP (0.91 g/cm3), PE (0.962 g/cm3), and EVA (0.948 g/cm3) with densities less than water, and PA (1.15 g/cm3), PET (1.37 g/cm3), and PVC (1.4 g/cm3) with densities greater than water. Thus, other factors affect the microplastic distribution besides density [58].
Fig. 5.
a) Abundance of microplastic types in the surface water across all sites; b) characteristics of surface water microplastics.
The distribution characteristics of microplastics are affected by various factors, including physical (e.g., wind, river velocity), chemical (e.g., UV radiation, hydrolysis), and biological (e.g., fungi, bacteria) factors. These factors work together to affect the vertical distribution of microplastics in water [59]. In summary, it is preliminarily determined that surface water microplastics in the study basin mainly come from industrial and agricultural production and domestic sewage, and their distribution is the result of the interaction between the external environment and the intrinsic characteristics of plastics.
Risk Assessment of Microplastic Pollution
PLI
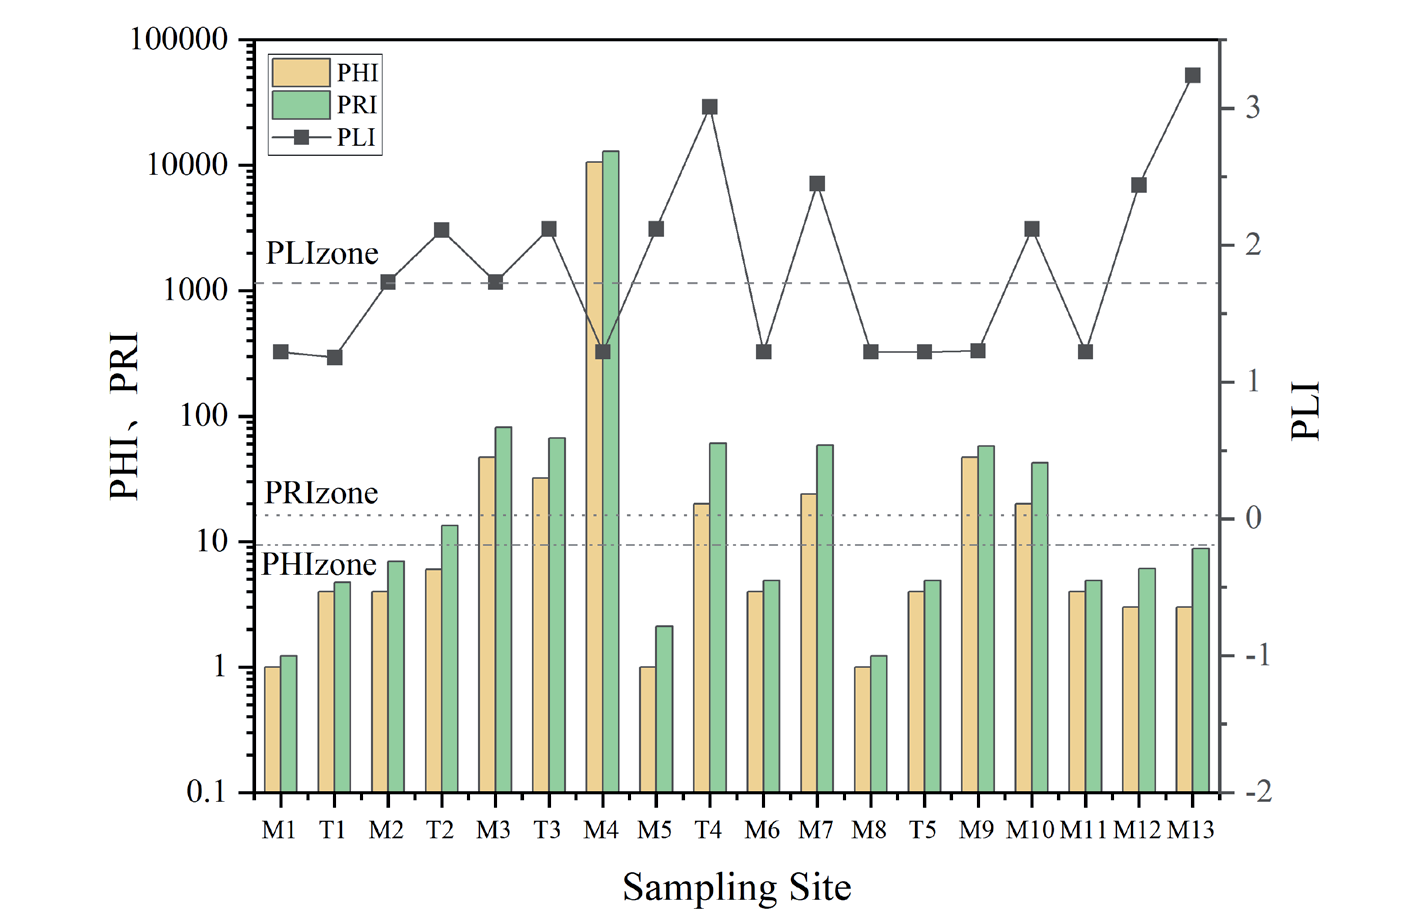
Based on the PLI, each sampling point was polluted to a different degree. As shown in Fig. 6, the PLI of each sampling site ranged from 1.18 to 3.24. For the entire study area, PLIzone was 1.72, which indicates a moderate pollution level. The highest PLI value occurred at M13, indicating high pollution. This may be because the sampling point was close to an industrial area; therefore, the pollution level was relatively high. The lowest PLI value occurred at the T1 sampling point, which was located in the countryside. This region has fewer people and is the most upstream sampling point of the study area; therefore, its contribution to the Chishui River microplastic pollution was relatively low. When comparing Fig. 2 and Fig. 6, it can be seen that the change in the PLI value of each sampling point corresponded to the change in microplastic abundance. Additionally, the estimated results of the model depended on Coi’s choice. However, there is currently no unified microplastic concentration reference value, which leads to differences in the results of various studies. In the future, the safety threshold of microplastic abundance in different environmental media should be further discussed, and a standardized analysis method should be established to accurately quantify the pollution levels and ecological risks of microplastics.
PHI
The ecological risks posed by microplastics are not solely determined by their abundance and toxicity. A microplastic polymer can cause different levels of environmental pollution based on its toxicity risk score. As shown in Fig. 6, the PHI values of the study samples ranged from 1 to 10551, and the PHIzone was 9.38, indicating a risk level of I. With PHI>10000, the risk level of M4 was V, while the risk levels of M3, T3, T4, M7, M9, and M10 were II. The risk levels of 11 sampling points, including M1, T1, M2, T2, and M5, were I. Sampling point M4 had a low PLI value; however, its PHI value was the highest, corresponding to a risk level of V. There was no consistency between the PHI and PLI risk assessment results. It should be noted that data with a matching degree lower than 85% in the LDIR test were not included in this analysis, resulting in an underestimation of the ecological risk index for microplastics. According to Fig. 6, sampling point M4 had a high PHI value because it contained an extremely high percentage of PVC (100%), with the highest toxicity hazard score. Similarly, the microplastic risk index in typical intertidal zones and the Huangshui River Basin revealed that highly toxic polymers can lead to high environmental risks in local areas [60]. Importantly, a high environmental risk does not equate to a high hazard. This is because the PHI model only quantitatively evaluates the toxicity of a single polymer sample and does not consider abundance data; therefore, it has certain limitations.
PRI
The PRI values of the sampling points are shown in Fig. 6; the values ranged between 1.22 and 12919.04, with a PRIzone of 16.12. Aside from the ecological risk level of the M4 sampling point, the ecological risk levels of the sampling points were all level I, indicating that the microplastics at the M4 sampling point could threaten the eco-security of the region. This method combines the concentration of microplastics with the ecological pollution indices of single microplastics, providing a relatively comprehensive evaluation of the degree of harm of microplastics in terms of abundance and composition.
In summary, these results indicate that the risk level of the M4 area was much higher than other areas. Thus, the M4 area should be given more attention. Although it is clear from these results that the study area has a relatively low overall risk, a small amount of highly toxic polymers had a high pollution index due to their refractory degradation and easy release of toxic substances, posing a threat to local ecological security. Given these findings, it is necessary to strengthen pollution prevention and reduce the use of toxic plastics that do not degrade easily and readily release toxic substances in order to manage pollution in this area and control the ecological risks in the Chishui River. Moreover, a deeper understanding of the impacts and harms of microplastics in terms of river security and the environment is needed.
Conclusions
(1) The abundance of microplastics in the surface water of the Chishui River ranged from 9.34 to 69.67 n/L, with an average of 24.87 n/L. Among the six microplastics identified, PET, PP, and PA accounted for the highest proportions. The majority of microplastics (64.44%) were sized ≤50 μm and most particles were fragmented.
(2) Microplastics in the surface water of the Chishui River appear to mainly originate from industrial and agricultural production and domestic sewage, and their distribution results from the interaction between the external environment and the intrinsic characteristics of plastics.
(3) The PLI, PHI, and PRI values of microplastics in the Chishui River Basin indicated a relatively light degree of pollution but an overall relatively low-risk level. However, the PHI value of PVC-type microplastics was relatively high, reflecting a dangerous risk level. These findings suggest that PVC poses the greatest risk to the aquatic ecosystem of the Chishui River.

