

Introduction
As a large and heavily populated country, China has long prioritized food security. The country has consistently worked to increase its overall production capacity and improve the structure of its food sector, thus ensuring the essential material foundation for social stability and economic development [1]. However, the outdated development model, which relies heavily on multiple factor inputs to boost food production, has resulted in excessive resource consumption, significant environmental pollution, and growing concerns about food quality and safety [2]. This situation poses a substantial threat to the stability of the food supply and the advancement of sustainable agriculture [3]. Therefore, promoting the green transformation of the food industry is crucial for ensuring food quality and safety, supporting the strategy for a Healthy China, addressing resource and environmental crises, and achieving sustainable agricultural development. The green transition of the food industry requires a shift in production methods, emphasizing integrating environmentally friendly practices into both production and management processes [4]. This involves moving from a purely results-oriented approach to one that embraces environmentally sustainable production principles, utilizes cutting-edge technologies, and promotes effective resource management, ecological conservation, and producing high-quality food products [5, 6]. As the smallest decision-making unit, farmers’ green perceptions and behavioral decisions significantly impact the effectiveness of the green transition in food production [7]. Therefore, efficiently organizing and providing scientific guidance to farmers in transitioning from traditional extensive production to green production is crucial for advancing the green transition of the food industry. This is also an urgent and key issue that must be addressed for the sustainable development of agriculture.
The term “green transition of food production” refers to the shift from traditional to green methods of food production by farmers [8]. This shift involves the use of green production concepts and green production technologies to transform traditional agriculture. In particular, farmers utilize the green development concept as a guide, employing scientific methods to incorporate chemical inputs into food production, adopting green production factors and technologies, and recycling production waste, thereby enhancing the efficiency of resource allocation and the capacity to produce and supply safe and high-quality food. A significant amount of empirical research has examined the green transition behavior of farmers in adopting environmentally friendly practices, focusing on their personal attributes, family-related production characteristics, and external environmental factors [9]. According to most scholars, farmers who have male heads of household, are younger, have higher levels of education, and show increased awareness of ecological and pollution issues are more likely to be willing to participate in green production [10, 11]. Regarding family business characteristics, scholars generally agree that factors such as the number of farmers, experience in planting, available labor, agricultural income, scale of operation, and risk preference play a crucial role in influencing the transition towards green practices in farm household production [12-14]. External environmental factors, such as government policies, social capital, organizational participation, and agricultural socialization services, significantly impact farmers’ adoption of green production practices [15-19].
As the construction of information infrastructure, service platforms, and resource systems continues to advance, digital technologies are increasingly being integrated into agricultural production, rural life, and rural governance. The digital divide between urban and rural residents is gradually narrowing. However, farmers’ digital literacy still lags behind the development of the digital economy, posing a significant challenge and limitation in the construction of digital villages. Digital literacy is becoming increasingly important in integrating the digital economy with agriculture, as it influences farmers’ decision-making in production. Numerous studies have highlighted the growing impact of digital literacy on farmers’ adoption of green production practices. However, whether and how digital literacy affects the green transition in farmers’ food production remains an open question that requires further exploration. In this context, this paper examines the factors influencing the green transition of farmers’ food production from the perspective of digital literacy, with the goal of providing policy recommendations to support food security and sustainable agricultural development.
While China’s efforts are unique in many respects, the international implications of this study extend to both developed and developing countries. Many nations face similar challenges in balancing food security with environmental sustainability. The insights gained from China’s green transition – particularly the role of farmers’ digital literacy and involvement in the process – can provide valuable lessons for other countries. For instance, developing nations can learn from China’s experience in building digital infrastructure to enhance farmers’ capabilities and promote environmentally friendly farming practices. Similarly, developed countries may find China’s emphasis on integrating green practices into national policies and food production systems instructive as they address their own environmental challenges. Thus, this paper offers significant implications for global agricultural sustainability and presents a model that countries at various stages of development can adapt to implement effective green transitions in agriculture.
Literature Review
Recent scholarly attention has been directed towards examining the impact of digital technologies, including the Internet, digital promotion, and rural e-commerce, on the green production of agriculture [20-22]. Digital technology and the digital economy can enhance the efficient movement of resources and accelerate the integration of different market actors, thereby playing a vital role in supporting the transition to sustainable agriculture [23]. Engaging in e-commerce can provide farmers access to more environmentally conscious consumers and expose them to sustainable production practices, thus motivating them to adopt greener agricultural practices to enhance their marketability and reputation [24]. In general, farmers need to possess specific proficiencies in digital tool usage, information utilization, and opportunity identification in order to effectively apply digital technologies and engage in e-commerce [25]. Only groups possessing advanced digital literacy are capable of effectively utilizing digital technology and distributing digital benefits [26, 27]. Consequently, investigating the correlation between farmers’ digital literacy and the green transition of their food production, as well as implementing effective strategies to regulate the behavior of new farmers, has become a practical and efficient way to reduce the use of chemical inputs and promote the shift towards green food production.
Current literature on the green transformation of food production primarily emphasizes theoretical aspects, with only a limited number of empirical studies examining fertilizer and pesticide reduction and efficiency. These studies also consider the influence of farmers’ digital literacy on specific production behaviors [28]. Nevertheless, the green production transition is a systematic and continuous process that requires not only chemical input reduction and green technology adoption but also the rational use of water resources, arable land resources, and the resource utilization of agricultural waste. Given this, this paper empirically analyzes the comprehensive impact of farmers’ digital literacy on the green transition of food production by taking food production as an example, using data from a survey of 1,182 farm households in China, and based on measuring the degree of green transition of food production of farmers using a finite mixture model (FMM); at the same time, it examines the internal logic, the mechanism of action, and the manifestation of heterogeneity of this impact.
This study makes the following key contributions compared to existing research: First, it develops a digital literacy assessment framework specifically for farmers, considering four key application scenarios, and establishes standards better suited to evaluate the ‘digital dividend’ and ‘digital divide’ in the agricultural context. This framework provides a more precise tool for assessing digital literacy in agriculture, filling a significant gap in the literature. Second, the study introduces the FMM to address measurement challenges in the transitional phase of green food production. This innovative approach enables a comprehensive evaluation of the multidimensional impact of digital literacy on food production, analyzing its influence in terms of direction, strength, and scope. Finally, the study conducts a heterogeneity analysis of the relationship between farmers’ digital literacy and the green transition, considering factors such as crop type, operational scale, and risk preferences. The results reveal that the impact of digital literacy on the green transition varies significantly across different farmer groups, highlighting the need for policies tailored to the specific characteristics of farmers. Based on these findings, the study provides targeted policy recommendations aimed at promoting the green transition through improved digital literacy among farmers.
Research Hypothesis
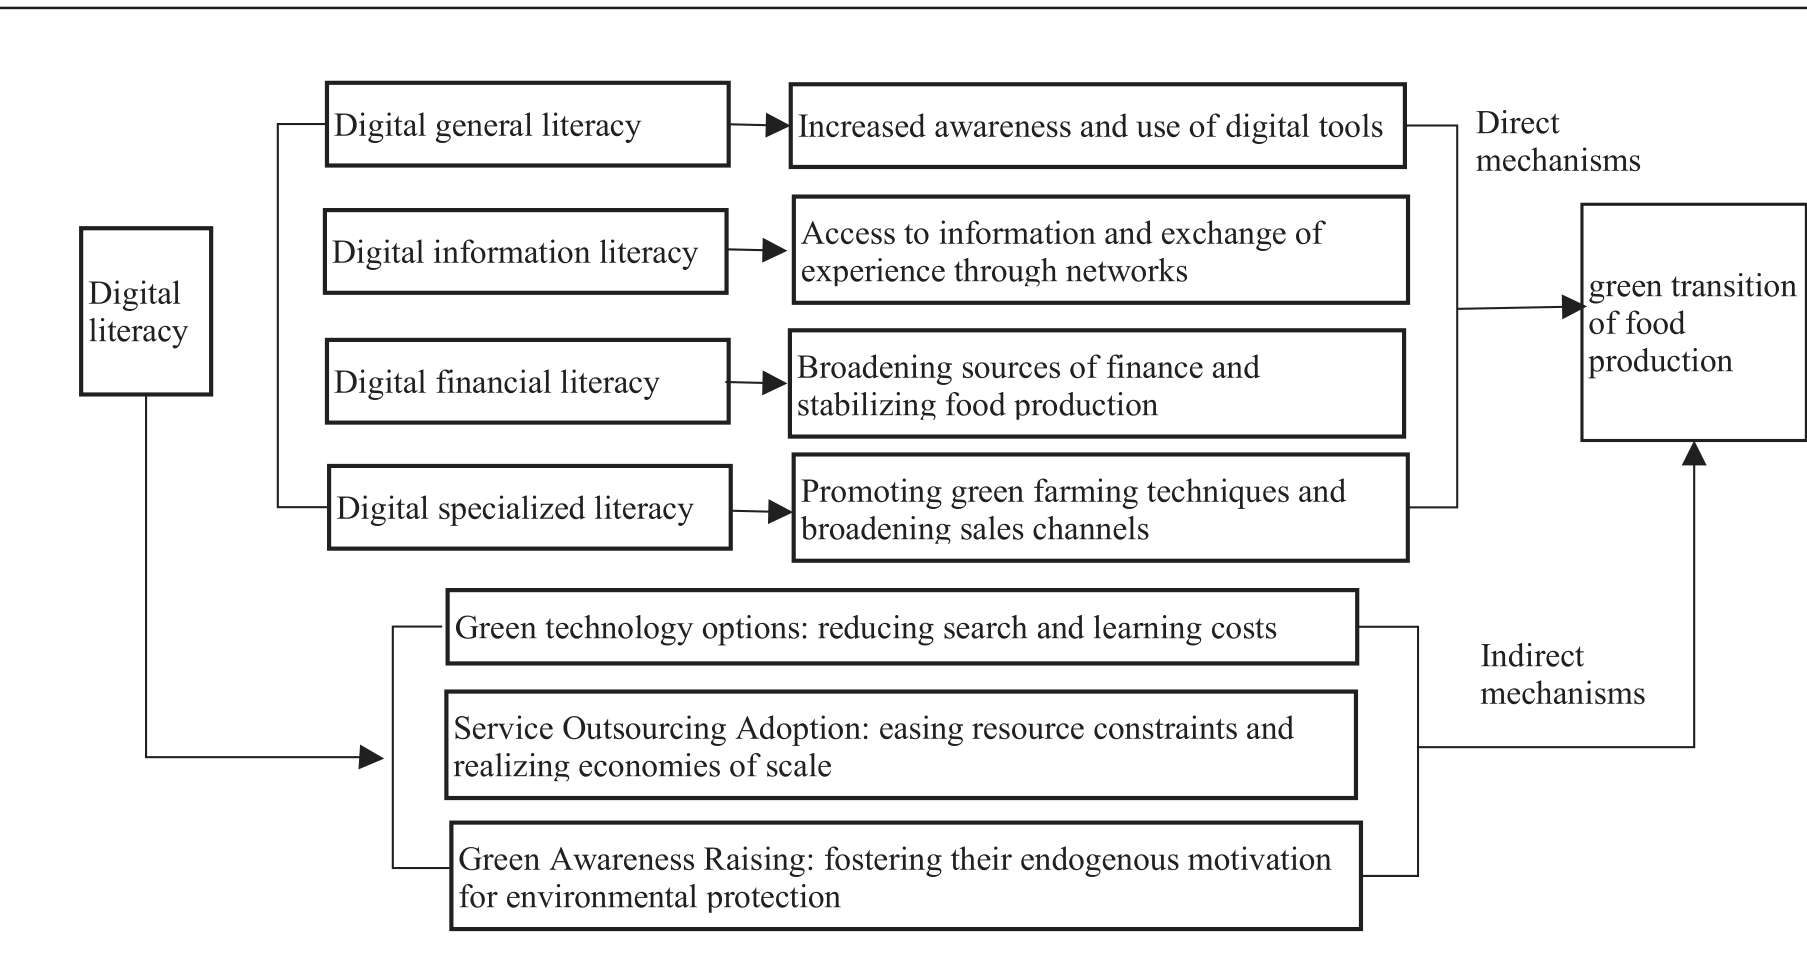
As digital technology continues to permeate the agricultural value chain, the deep integration of “Internet+” with vocational education for farmers, the agricultural service industry, and agricultural production management has become a key driver of the green transition in food production [29]. The level of digital literacy is the key to whether farmers can use digital technology well and realize the simultaneous improvement of cognitive level and transition ability [30]. Firstly, the Internet and various social media platforms facilitate seamless communication among individuals [31]. Farmers with higher digital literacy are more likely to engage with agricultural extension workers and other farmers, enabling them to quickly grasp the key elements of new technologies and enhance their capacity for green transition. Secondly, integrating digital technology with financial inclusion has expanded the reach and accessibility of financial services, empowering the entire food production chain. Improved digital literacy enables farmers to effectively use digital financial tools and mitigate risks by purchasing green financial products (e.g., agricultural insurance) when adopting green technologies. Lastly, digitally literate farmers can more effectively leverage e-commerce platforms to better understand consumer demand and the trends in high-quality food. This awareness encourages them to rethink production methods, innovate, and actively transition to greener production practices [32]. In summary, farmers’ digital literacy may have the following effects on the green transition of food production:
Firstly, digital literacy can facilitate the green transition of food production by helping farmers adopt green technologies. As food consumption patterns and demand levels evolve, there are increasing requirements for food production, including cultivating superior varieties, quality improvement, and brand development. In other words, food production now needs to reduce and optimize the use of chemical inputs like fertilizers and pesticides while also updating green production technologies such as deep plowing, deep-pine cultivation, and water-saving irrigation. Moreover, it is essential to integrate green development concepts – such as soil testing and formula fertilization, biological pest control, and waste resource utilization – into the production process. Research shows that the lack of access to agricultural information and technical support are major obstacles to farmers’ adoption of green practices [33]. The Internet provides farmers with abundant information on market demand and cutting-edge production technologies. By improving digital literacy, farmers can use the Internet more effectively to overcome traditional cognitive biases, recognize that modern agricultural technologies can enhance efficiency and quality, and better understand and apply these innovations at a lower cost. This helps guide farmers to adopt green production technologies and embrace the principles of green development, ultimately supporting the green transition of food production [34].
Secondly, digital literacy can facilitate the shift toward green food production by encouraging farmers to engage in service outsourcing. Given the decentralized nature of food production, outsourcing services can overcome the limitations of small-scale operations by improving the efficiency of resource allocation – such as land, labor, and machinery – through economies of scale. Additionally, service outsourcing can provide farmers with technical assistance, promoting the adoption of more efficient, green, and market-oriented production methods. This ultimately supports the transition to sustainable food production practices [35]. Improving farmers’ digital literacy can enhance their ability to engage in service outsourcing. On the one hand, increased digital literacy expands access to information, helping farmers better understand service outsourcing opportunities through the Internet, reducing information asymmetry, and offering more agricultural service options. On the other hand, digital platforms rich in resources, such as e-commerce apps (e.g., Zhinongtong, Cloud Farm), allow farmers to access agricultural services and benefit from features like online reviews, which help protect their rights and interests [36]. Therefore, boosting farmers’ digital literacy and encouraging participation in service outsourcing enables them to access advanced production resources and technical support, further promoting the green transition of food production.
Finally, digital literacy can support the green transition of food production by enhancing farmers’ environmental awareness. Green cognition includes various aspects, such as farmers’ efforts in environmental protection, resource conservation, and adopting sustainable production methods [37]. The accessibility of information and the cost of acquiring it significantly influence the level of green cognition among farmers [38], resulting in variations in their environmental awareness. The clearer farmers understand green practices, the stronger their commitment to sustainable production, thus driving their motivation to adopt green methods [39]. Digital literacy can expand farmers’ information channels, reduce the cost of information acquisition, and improve their green cognition, ultimately shaping their behavior towards more sustainable production. This influence can be observed in two key ways: First, digital literacy fosters emotional and cognitive engagement with environmental issues, raising farmers’ awareness of pollution risks and strengthening their positive environmental attitudes. Second, it enhances social networks, facilitating the spread of green production information and encouraging the adoption of green practices through peer influence. This “cohort effect” can further promote the use of green production technologies among farmers [40]. Additionally, digital literacy increases transparency, subjecting farmers to greater social scrutiny and enabling the enforcement of sanctions against environmentally harmful practices. In this way, digital literacy shapes farmers’ environmental cognition from both subjective and objective angles – encouraging intrinsic motivation for environmental protection while exerting pressure through social norms, thereby fostering a long-term shift toward sustainable food production.
In conclusion, the analytical framework of farmers’ digital literacy for the green transition of food production is illustrated in Fig. 1. Based on the preceding analysis, this paper proposes the following hypotheses:
H1. Digital literacy has a significant positive impact on the green transition of food production.
H2. Digital literacy can contribute to the green transition of food production by increasing farmers’ access to green technology options.
H3. Digital literacy can contribute to the green transition of food production by promoting farmers’ adoption of outsourcing services.
H4. Digital literacy can contribute to the green transition of food production by enhancing farmers’ environmental awareness.
Materials and Methods
Data Sources
The data were collected from household surveys conducted by the research group between July and September 2022 in the Hunan, Shandong, and Henan provinces. These provinces were chosen for their prominence in China’s agricultural production: Hunan for rice, Shandong for wheat, and Henan for maize. Each province represents a key agricultural sector, making them ideal for understanding diverse farming practices and rural development challenges. Within these provinces, we selected 18 counties based on varying levels of economic development (high, medium, and low). Two townships were randomly selected per county, and three villages per township. In each village, 10-12 farming households were surveyed, ensuring a comprehensive representation of local agricultural conditions. A total of 1,300 questionnaires were distributed, yielding 1,182 valid responses, with a high response rate of 91%. The survey covered major agricultural areas in these provinces, including Changsha, Hengyang, Zibo, Binzhou, Anyang, and Nanyang. This sample structure provides valuable insights into the common issues faced by farmers in different agricultural regions.
Variables
Dependent Variable
This paper selects the green transition of food production by farmers as a dependent variable. Considering the relatively slow adjustment of farmers’ inputs to food production factors in the short term and the fact that the focus of this paper’s analysis is on the impact of digital literacy on the green transition of food production rather than on the formal aspects of specific production technologies, the classical C-D production function with its concise form and clear economic implications is used [41]. This paper presents a latent category stochastic frontier model based on the basic form of the C-D production function to describe the input-output relationship in farmers’ food production chains. The specific form of the model is:
Here, Yi represents the annual income per acre of the farmeri; Ki represents the capital input per acre of the farmeri; Li represents the labor input per acre of the farmeri; A represents the level of integrated technology; and represents the random error term. The equation is transformed into a logarithmic form to obtain:
In selecting the covariates needed for the FMM, with reference to the specific requirements of the “Key Points of Cultivation Industry in 2023” issued by the Ministry of Agriculture and Rural Development and the proper characteristics of green production methods for food, this paper selects six indicators from input reduction and efficiency, green production technology adoption, and waste resource utilization, namely, chemical fertilizer application intensity, organic fertilizer application rate, pesticide application intensity, pest and disease prevention and control inputs, environmentally friendly technology adoption rate, and waste resource utilization rate, as the basis for judging which production method the sample farmers belong to [8]. Of course, the above indicators are only a few expressive features of farmers’ green food production methods and cannot fully represent green production methods. However, when utilizing the relationship between these covariates, which are closely related to output, it is possible to indirectly calculate the probability that a farmer’s food production belongs to a green production method and thus obtain a proxy variable for the green transition of food production. Table 1 displays the definitions of the pertinent variables.
Core Independent Variable
In this paper, the digital literacy of farmers is selected as the core independent variable. Digital literacy refers to the comprehensive literacy of farmers who use digital tools to appropriately access, integrate, communicate, manage, and create digital resources in a digitalized living environment, thus forming a comprehensive literacy about digital competence [42]. This study, based on existing studies and concerning the Global Digital Literacy Framework released by UNESCO in 2018, constructs the evaluation index system of digital literacy of farmers from four dimensions: digital technology access, digital information access, digital financial use, and digital production and management, which reflect the digital general literacy, information literacy, financial literacy, and specialized literacy of farmers, respectively, as shown in Table 2 [43].
(1) Digital technology access is the basic condition for farmers to access digital information, mainly including Internet access and hardware facilities required for Internet access. Therefore, this paper selects whether the head of household uses cell phones and whether the family has access to broadband, Internet broadband, or a wireless network (Wi-Fi) to reflect the level of farmers’ digital technology access. (2) Digital information access is an important part of the digital capability of farm households, which can effectively avoid the social phenomena that farm households face: the risk of marginalization and the lack of basic rights. In this paper, whether the head of household can search for information and browse news through the Internet and whether the head of household can use the Internet to show himself and communicate with others are two questions that reflect the digital information access ability of farmers. (3) Digital financial use is an important channel for farmers to access financial services for agricultural production so that they can fully enjoy the opportunities brought by digital financial inclusion. In this paper, two question items are selected to react to farmers’ level of digital financial use: whether the head of household will conduct transactions through the Internet and whether the head of household will use the Internet to borrow and purchase Internet financial products [44]. (4) Digital production and management are the resultant manifestation of farmers’ digital capability and an important behavioral way to influence the development of the food industry. In this paper, we choose whether the head of household has received agricultural production training through the Internet and whether the family operates agricultural products through online trading that reflects the farmer’s digital production and management abilities.
Table 1.
Indicator system for measuring the green transition in food production.
Table 2.
Digital literacy evaluation indicator system for farmers.
Principal component factor analysis was used to construct the family digital literacy index, following the principle of cumulative variance contribution rate >80%. A total of five public factors were extracted, and the cumulative variance contribution rate was 82.23%. The KMO value of the sample adequacy test was 0.724, indicating a strong correlation between the variables, and the significance p-value of the Bartlett sphericity test statistic was 0.000, indicating that it was suitable for factor analysis and the results were valid. The method of directly summing the scores of each question item was also used to measure the digital literacy of farmers, and this result will be used for the robustness test [45].
Mechanism Variables
Based on the previous analysis of the theoretical mechanism of digital literacy to promote the green transition of food production in farm households, the mechanism variables selected in this paper include green technology options, the adoption of service outsourcing, and the level of green awareness.
(1) The green technology options for farmers are measured by the number of green production technologies adopted by farmers in the three stages of production: pre-production, production, and post-production. (2) The level of service outsourcing adoption is measured by the number of projects participating in agricultural outsourcing services. (3) The level of green cognition is measured by the farmers’ green production cognition, environmental pollution cognition, and environmental policy cognition. Among them, green production awareness was measured by asking farmers, “How much do you know about environmentally friendly behavior?”; environmental pollution awareness was measured by asking, “How much do you think food production negatively affects the ecological environment?”; and environmental policy awareness was measured by asking, “How much do you know about environmental policies for food production?” On this basis, the entropy weighting method was used to calculate the weights of each indicator, which were weighted and summed to get the level of farmers’ green cognition. After calculation, the weights of green production cognition, environmental pollution cognition, and environmental policy cognition are 0.45, 0.25, and 0.30, respectively.
Control Variables
Taking into account existing research and the actual situation of food production, 14 control variables were selected from the characteristics of individual characteristics, household characteristics, and food production and operation characteristics [28]. Sex, age, health status, political identity, and education level of the head of household are selected for individual characteristics; whether the household is a cadre household, size of agricultural labor force, crop specialization, and organizational participation are selected for household characteristics; and production and operation characteristics include scale of operation, cropland fragmentation, soil fertility, family farms, and food disaster. See Table 3 for specific variables.
Methods
China’s grain production is in the process of transitioning from traditional to green production methods; some farmers have begun to apply advanced production concepts and green production techniques to food production, and some are in the transition from traditional rough production to green production, but a large proportion of farmers are still in the rough production stage [8]. The green transition of food production is a dynamic process that is difficult to measure using specific data [7]. In recent years, FMM, a method that can model unobserved sample heterogeneity, has been gradually applied to the field of economics, which can solve the difficulty of the green transition in food production that is difficult to portray with data [46]. Therefore, this paper will use the FMM to construct an indicator to measure the a posteriori probability of farmers choosing green food production methods as a proxy variable for the green transformation of food production and then incorporate it into the Tobit model as a dependent variable to examine the impact of farmers’ digital literacy on the green transition of food production and the specific mechanisms.
FMM: A means to Assess Farmers’ Food Production Approaches
The FMM is capable of adapting to various data types and distribution patterns, enabling economies to have differential growth paths. Additionally, it can accurately identify unobservable heterogeneity in the samples and divide them into several subgroups for description. This effectively compensates for the limitations of traditional growth models and has gained popularity among scholars since being introduced into the field of economics. In this paper, we refer to the existing literature on categorizing the potential classes of samples by splitting the distribution function of all samples into several sub-probability density functions [46].
In Equation (3), f(Y | X, θk) represents the conditional probability density distribution of sample y when it belongs to the potential category k. X is a vector of explanatory variables and is the parameter to be estimated. πk denotes the proportion of mixing, and is also referred to as the weight corresponding to each sub-density, and ∑πk = 1.
Amidst mounting resource constraints and environmental pollution, Chinese farmers are embracing a green transition. This paper introduces indicators that characterize the green production method as covariates in the FMM to reflect the probability distribution of the input-output relationship in the food production process. The distribution function of the entire sample can be characterized by the following equation, assuming that the sample farmers can be divided into two potential categories: traditional production and green production:
Table 3.
Descriptive statistical summary of the variables.
Equation (4) is used to calculate the posterior probability of each sample farmer belonging to the jth category.
In Equation (5), j = (I, E), PI and PE represent the a posteriori probabilities of sample farmers falling into the potential categories. This paper divides food production methods into two categories: traditional production and green production. Therefore, if the a posteriori probability of a sample farmer belonging to the category of green production methods is P, then the a posteriori probability of belonging to the category of traditional production methods is 1-P. In fact, since the transition to green production of food is not a clear-cut technology but a long-term and systematic process, the a posteriori probability of a sample farmer falling into the category of green production methods reflects, to some extent, the degree of green transition in farmers’ food production.
Tobit Model
Considering that the dependent variable, i.e., the probability of green transition of food production by farmers, is a restricted variable taking the value of 0 to 1, this paper further constructs a Tobit model to explore the impact of digital literacy of farmers on green transition of food production. The form of the model is as follows:
Where Ti is the degree of the green transition of food production, the size of the a posteriori probability that a sample farmer household falls into a green production method reflects the degree of green transition of food production of the farmer household. The larger the value of the probability, the stronger the degree of green transition of food production of the farmer household, and the smaller the value of the probability, the weaker the degree of green transition of food production of the farmer household. Ci denotes control variables, including individual characteristics of the ith farm household (gender, age, health status, political identity, and education level); household characteristics (whether or not it is a cadre household, size of the agricultural labor force, crop specialization, and organizational participation); and production and operation characteristics (scale of operation, degree of finesse, soil fertility, family farms, and food disaster). α0 is the constant term; θ1 and θ2k is the coefficient that needs to be estimated; and εi is the random perturbation term.
Intermediary Effects Model
To further analyze through which mechanism farmers' digital literacy influences their decision-making on the green transition of food production, this study constructs a mediating effect model as follows:
Where: Mi represents the above three types of mediating variables, i.e., green production skill level, participation in service outsourcing, and farmers’ environmental awareness; DLi is the level of digital literacy of farmers; and Ti is the degree of green transition of farmers’ food production; Ci denotes control variables, including individual characteristics of the ith farm household (gender, age, health status, political identity, and education level); household characteristics (whether or not it is a cadre household, size of the agricultural labor force, crop specialization, and organizational participation); and production and operation characteristics (scale of operation, degree of finesse, soil fertility, family farms, and food disaster). σ0 and φ0 is the constant term; λ1, λk, φ1 and φk is the coefficient that needs to be estimated; and εi, ξi is the random perturbation term.
Results and Discussion
Determination of Farmers’ Food Production Methods
Calculation of The Posterior Probability that Sample Farmers Belong to a Potential Category
Determination of the number of farmers’ food production methods. To determine the number of potential categories in the sample, the Bayesian Information Criterion (BIC) index is used, i.e., the number of categories corresponding to the smallest value of the BIC is selected, and the results of model fitting are shown in Table 4. When the number of categories is 2, the value of the BIC is -1243.27, which is lower than the number of categories of 1 and the number of categories of 3. Therefore, we believe that dividing the sample into two major categories is statistically optimal. In this paper, we classify farmers’ food production methods into two categories: traditional production methods and green production methods.
The probability of a sample farmer falling into a potential category is calculated. According to the modeling idea of FMM, the posterior probability that a sample falls into a potential category determines the potential category to which the sample belongs. China’s food production is shifting from traditional to green methods. The results of the BIC suggest dividing the samples from the study into two potential categories. If the posterior probability that a sample belongs to category A is P, then the posterior probability that it belongs to category B is 1-P. Thus, the probability analysis of a sample belonging to category A, based on its probability, is equivalent to that based on category B. The results of the probability analysis remain unchanged. This paper presents the organization of the probability of samples falling into category A, as shown in Table 5. The results show that out of 1182 samples, the number of samples with posterior probability P>0.5 is 667 with a probability mean of 0.572, while the number of samples with posterior probability P≤0.5 is 515 with a probability mean of 0.427, and most of the samples belong to the former group.
Analysis of Planting Characteristics of Each Potential Category of Farmers
The paper utilized the sample mean t-test to determine the significance of differences between categories for the six main indicators of green production methods (see Table 6). The results show that the six indicators characterizing the green production approach exhibit significant differences between the categories. Based on the differences in the means of the indicators characterizing green production methods between the two categories, the following conclusion can be drawn: The higher the a posteriori probability that the sample farmers fall into category A, the more obvious the green characteristics of their food production. Therefore, this paper concludes that the a posteriori probability of sample farmers falling into category A as measured by the FMM is highly correlated with the green transition of farmers’ food production. A smaller a posteriori probability indicates that the farmer is still using traditional production methods, while a larger a posteriori probability means that the farmer has a higher degree of green production. In the subsequent analysis, the a posteriori probability P of falling in the green production method is used to measure the degree of green transition in the farmers’ food production.
The Impact of Digital Literacy on The Green Transition of Farmers’ Food Production
Benchmark Regression Results
The estimation results of the baseline model are shown in Table 7, where digital literacy is added in column (1), which shows that digital literacy positively affects the green transition of food production for farmers and is significant at the 1% statistical level. To eliminate the interference of other variables, columns (2) to (4) add personal characteristic variables, household characteristic variables, and production and business characteristic variables in turn. All regression results show that digital literacy positively affects the green transition of food production for farmers, and all of them are significant at the 1% statistical level. The results of column (4) show that for every 1% increase in digital literacy, the probability of farmers implementing a green transition of food production will increase by 188.60%, indicating that having higher digital literacy will significantly increase the probability of a green transition of food production in farmers, and the research hypothesis H1 is verified. Ths is because, as analyzed in the previous theory, the increase in farmers’ digital literacy is conducive to their access, communication, and application of network information. On the one hand, farmers can improve their green production skills and willingness to protect the environment through abundant network information and then uphold the concept of green development and adjust their food production behaviors and decision-making; on the other hand, highly digitally literate farmers are more inclined to choose e-commerce sales of agricultural products, which can obtain timely changes in consumer demand, realize the organic connection between production and marketing, and force farmers to realize the green transition of food production.
Table 6.
Comparison of input indicators for potential farmer categories.
Table 7.
Estimated results of farmers’ digital literacy on the green transition of food production.
Robustness Test
To further test the robustness of the findings, this study uses three methods of robustness testing: replacing the dependent variable, changing the way the core independent variable is measured, and applying a 1% truncation to the variables. First, replace the dependent variable. In this paper, the green production behavior of farmers' food, i.e., whether farmers' food production belongs to the category of green production methods, is included in the regression model as a proxy variable for the green transition of food production, and the results are shown in column (1) of Table 8. The results show that digital literacy significantly positively affects farmers’ food green production behavior, which is consistent with the baseline regression results. Second, we need to change the way we measure digital literacy among farmers. The method of directly summing the scores of each question item is used to measure farmers’ digital literacy, and regression is re-conducted. The results are shown in column (2) of Table 8, which indicates that digital literacy has a sustained and significant positive impact on farmers' green transition food production, consistent with the baseline regression results. Third, the variables were analyzed by re-regression after 1% truncation. In order to exclude the effect of extreme values, continuous variables are re-estimated after 1% truncation, and as shown in column (3) of Table 8, the impact of digital literacy on the green transition of food production by farmers is still consistently positive. Combining the results of the robustness analysis of the above three approaches, the empirical results of this study are relatively robust.
Endogeneity Test
Farmers with a relatively high degree of green transition in food production may also have relatively high digital literacy, so there may be a certain endogeneity between digital literacy and green transition in food production. Therefore, there may be the problem of self-selection bias and endogeneity in the previous discussion, and this study chooses the instrumental variable (IV) method and the propensity score matching (PSM) method to solve this problem [47].
Instrumental variable method. In this paper, we try to use the IV method to test the estimation bias caused by the endogeneity problem, adopt the “digital literacy level of other farmers in the same village” as the IV, and use the 2SLS estimation method to further analyze the impact of digital literacy on the green transition of farmers' food production. The main reason for selecting the “digital literacy level of other farmers in the same village” as an IV is to consider the similarity of the digital development environment and network infrastructure in the same village and the formation of a complex social network among farmers in China's traditional “society of acquaintances” so that the level of digital literacy of farmers will be affected by the level of digital literacy of the acquaintances in the surrounding area and the production decisions and behaviors of the farmers will not be directly affected by the level of digital literacy of other farmers. Farmers' own production decisions and behaviors will not be directly affected by the digital literacy level of other farmers, which satisfies the requirements of relevance and exogeneity of IV.
The estimation results are shown in Table 9, and the diagnosis of the endogeneity problem of the model shows that the p-value of the DWH test is 0.013, the model has some endogeneity problems, and the instrumental variable method should be adopted for model correction. The results of the first stage of regression show that there is a significant positive correlation between IV and farmers’ digital literacy. The p-value of the F-statistic value of the weak instrumental test is 0.002, which means that the IV selected in this paper satisfies the conditions of correlation, and there is no weak instrumental variable problem. The results of the second-stage regression show that the estimated coefficient of digital literacy on the green transition of farmers’ food production passes the significance test and is consistent with the baseline regression results.
Table 8.
Robustness analysis results.
Table 9.
Results of the instrumental variables method.
Propensity score matching. This paper attempts to use PSM to decipher the possible endogeneity between digital literacy and the green transition of food production in farm households. In Table 10, you can see the PSM estimation results for the 1-1 nearest neighbor matching method, the 1-3 nearest neighbor matching method, the radius matching method, and the kernel function matching method. They all show that digital literacy significantly positively affects the green transition of food production in farm households. This means that improving digital literacy is good for the green transition of food production in farm households. In summary, the PSM estimation results are basically consistent with the findings of the previous study, indicating the robustness of the benchmark regression results.
In addition, this paper hopes to assess whether the PSM results can balance the data better through the balance test method, so the near-neighbor matching method with caliper is used as an example for the balance test, and the results are shown in Table 11. The results show that the standardized deviations of most variables are reduced compared with those before matching, and the standardized deviation rates after matching are all lower than 10%; moreover, the t-test results of most variables do not support the hypothesis that there are systematic differences between the experimental group and the control group, and thus the PSM results pass the balancedness test. The above-mentioned two-method estimation results once again verify the robustness of the empirical results of this study.
Mechanism Validation
The results of the benchmark regression verified that digital literacy enhancement significantly contributed to the green transition of food production in farm households, so what is the specific mechanism of its influence? In other words, what are the key variables through which the digital literacy of farm households affects the green transition of food production? Based on the previous theoretical analysis, this paper argues that an explicable reason is the positive impact of digital literacy on green technology choice, service outsourcing adoption, and the level of green perceptions as the main mechanism of action to promote the green transition in farmers' food production.
Table 12 reports the regression estimation results of digital literacy on the green transition of food production by farmers, where columns (1) - (3) correspond to the (5) setting and column (4) corresponds to the (6) setting. From columns (1) - (3) of Table 12, it is clear that digital literacy significantly contributes to farmers’ green technology selection, service outsourcing adoption, and green awareness. From column (4), it can be seen that farmers’ green technology selection, service outsourcing adoption, and green awareness level significantly contribute to the green transition of farmers’ food production. Further, compared with the model estimation results in column (4) of Table 12, the absolute value of the estimated coefficients of the core explanatory variables decreases from 1.886 to 1.702 when the baseline model incorporates the mechanism variables, which indicates that the facilitating effect of digital literacy on the green transition of food production in farm households has been reduced. Based on the principle of mediated effect analysis, part of the facilitating effect of digital literacy on the green transition of farmers’ food production is realized through three mechanism paths: increasing farmers’ green technology choices, service outsourcing adoption, and green cognitive level enhancement, and thus the above influence mechanism can be verified.
Table 10.
PSM estimation results for DL in GTGP.
Table 11.
Equilibrium test of the near neighbor matching method with caliper.
Table 12.
Results of the Mechanism Test of DL on GTGP.
This paper quantifies the above-mentioned impact mechanisms with reference to existing studies [48]. The calculations yielded that 13.02% of the facilitating effect of digital literacy on the green transition of farmers' food production can be explained by three pathway mechanisms: farmers' green technology choices, service outsourcing adoption, and green cognition level. Among them, the explanatory weight brought by the green technology choice of farmers is 6.45%, the explanatory weight brought by the increase in the adoption of service outsourcing is 4.47%, and the explanatory weight brought by the green cognition level of farmers is 2.09%. Therefore, compared to other farmers, farmers with high digital literacy will contribute to the scientific and standardized use of chemical inputs for the green production transition through their own efficient agricultural production skills, learning and experience accumulation, reasonable improvement of land fertility, and mechanized agricultural production activities.
Heterogeneity Analysis
Farm households are highly heterogeneous groups, differing in their business objectives and capital endowments, and this subject heterogeneity often leads to behavioral differences. In order to further refine the differences in the impact of digital literacy on the green transition of food production in different groups, this study combines the production of food crops with the actual production of food crops and carries out a classification and comparison study of farmers based on crop category, business scale, and risk preference [49].
Impact of Farmers’ Digital Literacy on The Green Production Transition of Farmers of Different Crop Types
In order to test the differences in the impact of digital literacy on the production of different food crops, three major staple crops – rice, corn, and wheat – were selected for testing. The results in Table 13 show that the estimated coefficients of digital literacy on the green transition of rice, corn, and wheat growers’ production are 2.094, 1.501, and 1.681, respectively, and all of them pass the 1% significance level, which indicates that digital literacy has a significant effect on the green transition of the production of all types of staple food crops and that digital literacy promotes the green transition of rice production more strongly. This result is explained by the fact that, compared with wheat, corn, and other crops, rice cultivation requires more refined management and higher requirements for farmers’ professional knowledge and technology, while digital literacy can effectively improve the professional knowledge reserve and green production capacity of rice farmers [50]. Therefore, the supply of digital literacy policies needs to be based on the universalization of infrastructure and the application of more attention to groups such as rice growers.
Impact of Farmers’ Digital Literacy on The Green Production Transition of Farmers with Different Scales of Operation
Considering that many differences in the business model, management style, and development goals of farmers with different business scales may affect their choice of food production methods, this paper divides farmers into two groups, small-scale farmers and large-scale farmers, according to the area of food crop cultivation. It carries out the model test on the data of the two groups, respectively, and the results are shown in Table 14. The results show that farmers’ digital literacy has a significant positive impact on the green production transition of both small-scale and large-scale farmers, indicating that improving digital literacy can effectively promote the green transition of farmers’ food production. We found that digital literacy among small-scale farmers to promote the green transition of food production is more obvious, which may be due to China’s current agrotechnology extension department manpower shortage. Sometimes, technicians can only focus on working with large households to give targeted guidance, resulting in insufficient guidance for small farmers. Improving digital literacy can compensate for the backwardness of green production concepts, insufficient knowledge of pesticides, and the lack of opportunities to learn green technology in the traditional mode of small-scale farmers, thus having a more significant impact on the green transition of small-scale farmers’ food production.
The Impact of Farmers’ Digital Literacy on The Green Production Transition of Farmers with Different Risk Preference Types
In order to test the difference in the impact of digital literacy on the choice of food production methods of farmers with different risk preferences, this paper divides farmers into two groups, risk-preferring and risk-averse farmers, according to their risk preferences, and carries out a modeling test on the data of the two groups, respectively. The results are shown in Table 15. Digital literacy can positively influence the decision-making of green transformation of food production for farmers with different risk preferences, and the positive influence effect is greater for risk-preferring farmers. The main reason is that risk-averse farmers tend to be more cautious in choosing green production methods and participating in e-commerce because they prefer stable returns and risk avoidance, while risk-preferring farmers tend to “seek the riches of the rich and powerful” and fully mobilize their existing resources to participate in e-commerce and the green production transition in order to pursue the maximization of food profits.
Table 14.
Differences in the impact of farmers’ DL on GTGP of different business types.
| VARIABLES | Small-scale farmers | Large-scale farmers |
|---|---|---|
| DL | 1.921*** | 1.708*** |
| (9.64) | (7.78) | |
| Control | Y | Y |
| Constant | 1.320*** | 2.397*** |
| (3.28) | (4.32) | |
| R2 | 0.1329 | 0.2366 |
| Observations | 834 | 348 |
Conclusions
This study utilizes data from 1,182 micro-surveys of food farmers in China in 2022 and quantitatively investigates the impact of digital literacy on the green transition of food production of farmers based on the use of an FMM to measure the degree of green transition of food production of farmers. The main research conclusions are as follows: First, overall, digital literacy will significantly contribute to the green transition of farmers’ food production. Second, digital literacy promotes the green transition of farmers’ food production mainly through three paths: increasing farmers’ green technology selection, service outsourcing adoption, and green awareness level. Third, digital literacy has a more significant effect on the green transition of food production for rice farmers, small-scale farmers, and risk-averse farmers.
Based on the above findings, this study has the following insights: First, infrastructure construction should be strengthened to improve farmers’ digital literacy. On the one hand, governments in China should enhance rural digital infrastructure, including AI and big data centers, to ensure digital resources are widely accessible; on the other hand, a government-led, multi-stakeholder digital education system should be established. Internationally, both developing countries (e.g., in Africa or Southeast Asia) and developed nations can draw on this approach to enhance rural digital inclusion and education. Second, access to digital tools and accurate information for the “three rural areas” must be improved. This includes expanding access to digital devices and providing relevant agricultural information through digital platforms. Globally, this model can help developing countries bridge the digital divide in rural areas, while in developed countries, it can streamline agricultural market communication and improve efficiency. Third, diversified digital technology should be used to innovate agricultural technology promotion. The Internet can support digital platforms for agricultural knowledge sharing, enabling faster technology diffusion and better communication between farmers and experts. This approach could help developing countries overcome geographical barriers to agricultural technology, while in developed countries, it can assist in modernizing farming practices and promoting sustainable agriculture.
This study uses cross-sectional data, which reveals the relationship between agricultural socialization services and green transformation, but it has certain limitations. Cross-sectional data can only reflect the situation at a specific point in time and cannot capture the long-term or cumulative effects of agricultural socialization services on green transformation. Therefore, future research could use longitudinal data to track the long-term effects of agricultural socialization services and further explore the impact of farmers’ digital literacy on green transformation in different regions through regional analysis.

