

Introduction
In recent years, with the rapid economic development, ozone pollution has emerged as one of the key factors affecting air quality. According to the relevant data released by the government, O3 pollution, along with PM2.5, is responsible for some of the most severe air pollution issues in China [1]. In regions such as the Beijing-Tianjin-Hebei area, the Pearl River Delta, and the Yangtze River Delta, ozone has become the primary air pollutant, significantly impacting the health of local populations [2].
Volatile organic compounds (VOCs) are key precursors to O3 formation in ambient air, as they photochemically react with nitrogen oxides and sunlight, leading to the production of ozone and secondary organic particulate matter, thus contributing to secondary air pollution [3, 4]. VOCs encompass a wide range of compounds with diverse chemical structures, multiple sources, and complex interactions. Based on their chemical properties, VOCs in the atmosphere can be categorized into alkanes, olefins, alkynes, aromatic hydrocarbons, halogenated hydrocarbons, and oxygenated organic compounds [5, 6]. Among these, aromatic hydrocarbons (e.g., benzene) and aldehydes (e.g., formaldehyde) in oxygenated organic compounds are particularly hazardous to human health and are classified as carcinogens. Alkenes and alkanes in the atmosphere are the primary precursors to the formation of both O3 and PM2.5 near the Earth’s surface [7, 8]. Understanding the source characteristics of VOCs is crucial for comprehending ozone formation mechanisms and is a key factor in implementing targeted management strategies to effectively mitigate ambient ozone pollution.
To better understand ozone formation, analyzing pollution status and sources of urban VOCs has become an important area of research in recent years. Previous studies have primarily focused on southeastern coastal cities or highly industrialized cities, such as those in the Yangtze River Delta [9, 10], the Pearl River Delta [11, 12], and cities within the Beijing-Tianjin-Hebei region, including Tianjin [13], Shijiazhuang [14] and others. Henan Province, which borders the Beijing-Tianjin-Hebei region, has gradually increased ozone pollution. Consequently, VOC-related research has been conducted in cities like Zhengzhou [15, 16], Xinxiang, and others [17]. The Beijing-Tianjin-Hebei air pollution transmission corridor also includes Kaifeng, a city located in the middle and lower reaches of the Yellow River, the southeastern Taihang Mountains, and the central part of the eastern Henan Province. Kaifeng is a typical warm-temperate plain area. Ozone pollution in Kaifeng has become more frequent in recent years, but research on the status and sources of VOC-important precursors of O3 pollution remains limited. Furthermore, previous studies on VOC source apportionment have generally focused on the overall process of ozone pollution, often overlooking the varying contributions of VOC sources in different stages of ozone variation.
To better elucidate the formation mechanism of ozone pollution and the sources of VOCs in a typical warm-temperate plain region, this study focuses on the ozone pollution process in Kaifeng City. The process is divided into different stages, including the rising, sustained, and dissipating periods. The ozone generation potential model and orthogonal matrix factor analysis method were used to analyze the ozone generation potential and the sources of VOCs at each stage of the ozone pollution cycle. The results indicate that four types of VOCs-oxygenated VOCs (OVOC), olefin, aromatic hydrocarbon, and alkanes, are the primary contributors to the tropospheric ozone formation potential (TOFP) during each stage of the pollution event. During the rising period, the main sources of pollution are industrial emissions and background species, followed by mobile sources, solvent volatilization, and plant emissions. Over a sustained period, the dominant sources are biomass and fossil fuel combustion, followed by background species, mobile sources, industrial emissions, and plant sources. During the dissipating period, pollution mainly comes from mobile sources, industrial emissions, solvent volatilization, oil and gas evaporation, and biomass combustion.
Materials and Methods
Research Framework
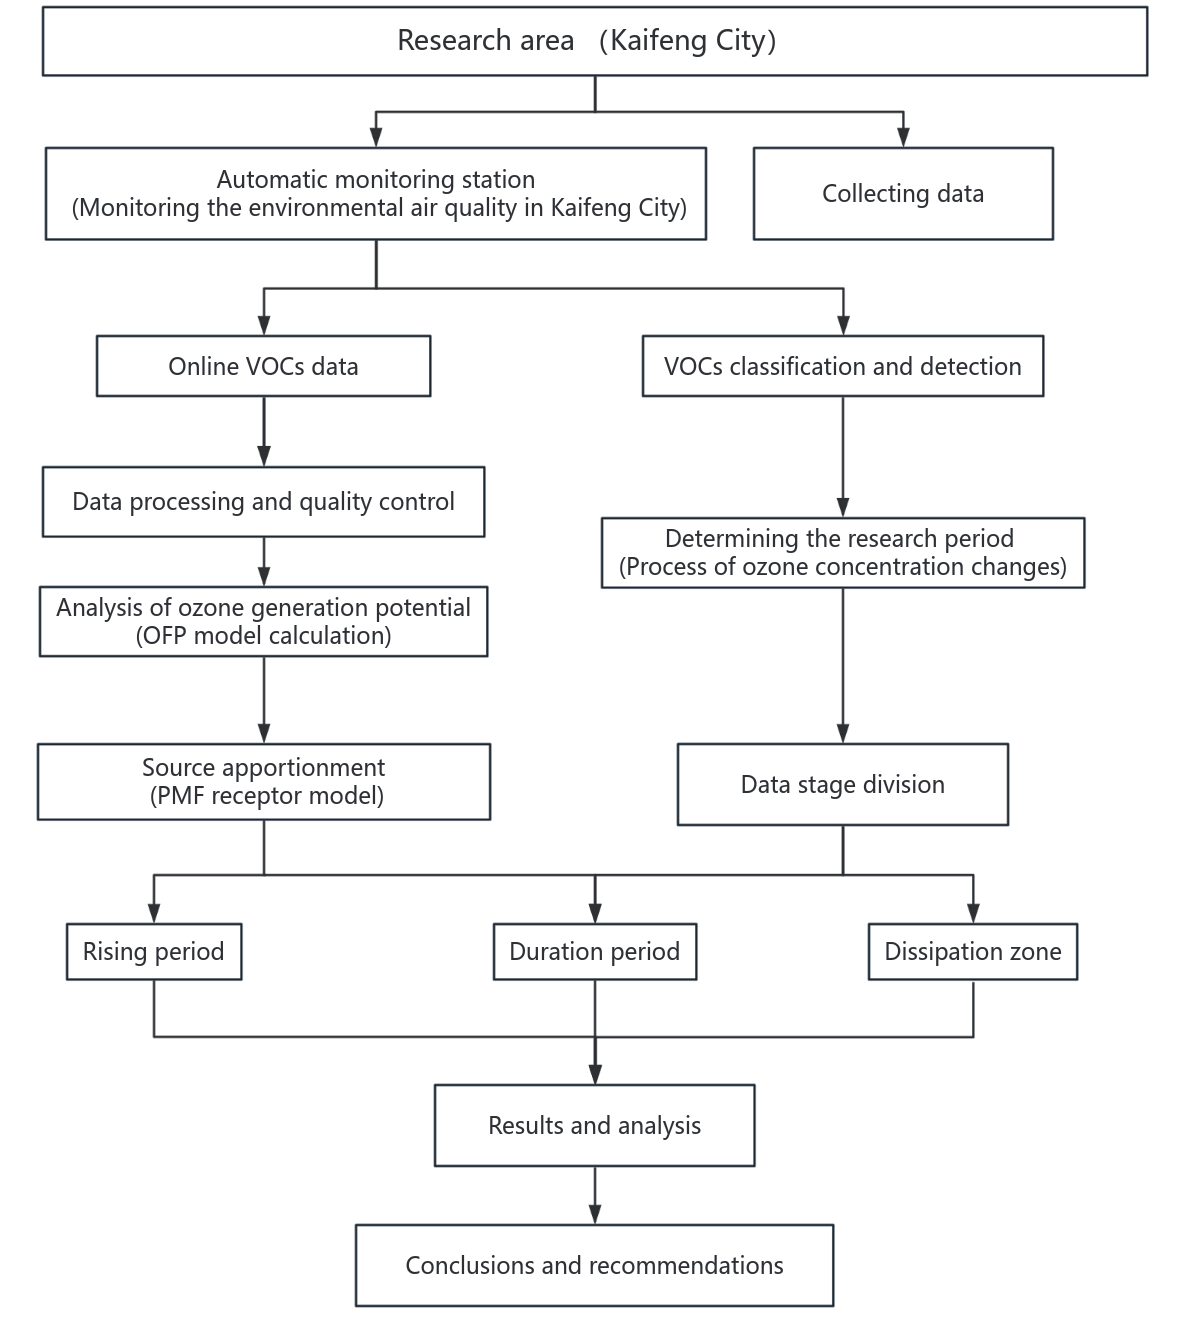
To understand the characteristics of VOCs at different stages of pollution and their specific contributions to ozone formation, a graphic illustration of the research was presented in Fig. 1.
Research Background and Data Source
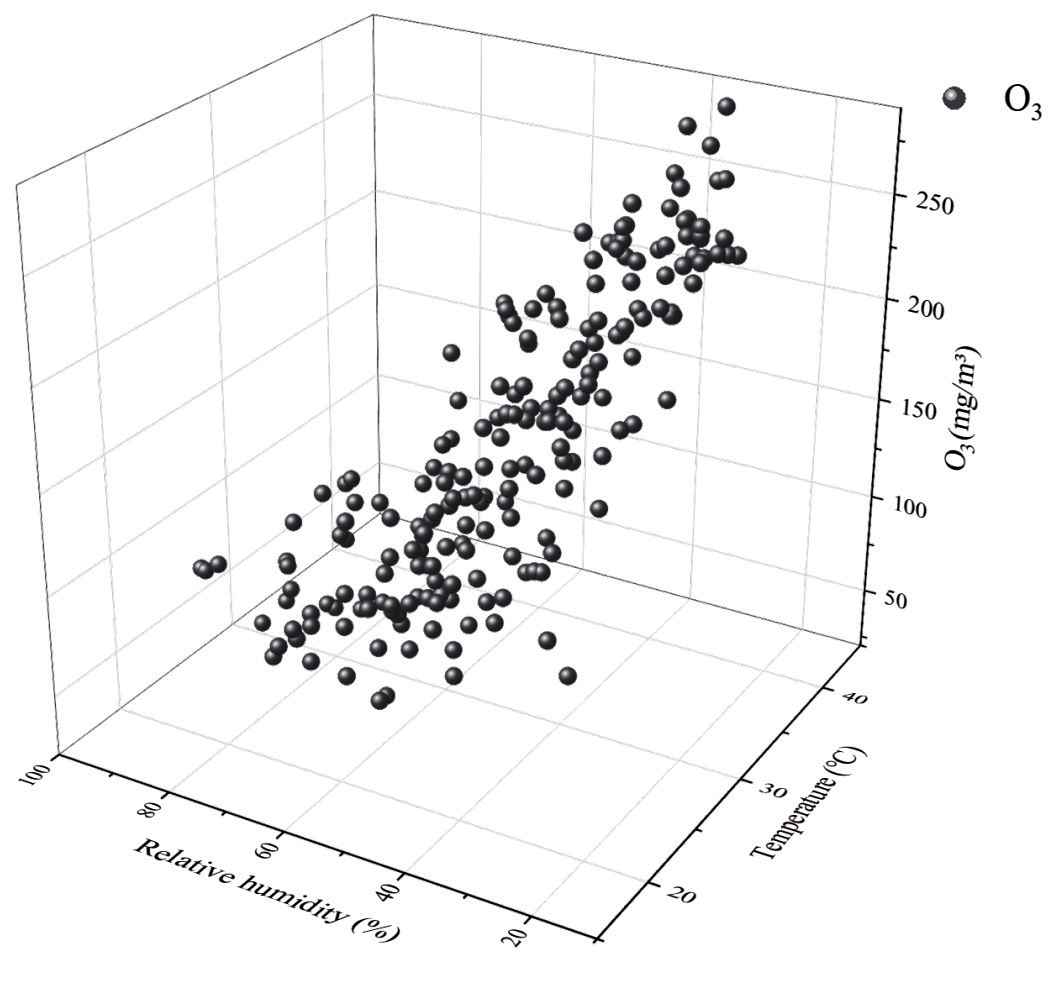
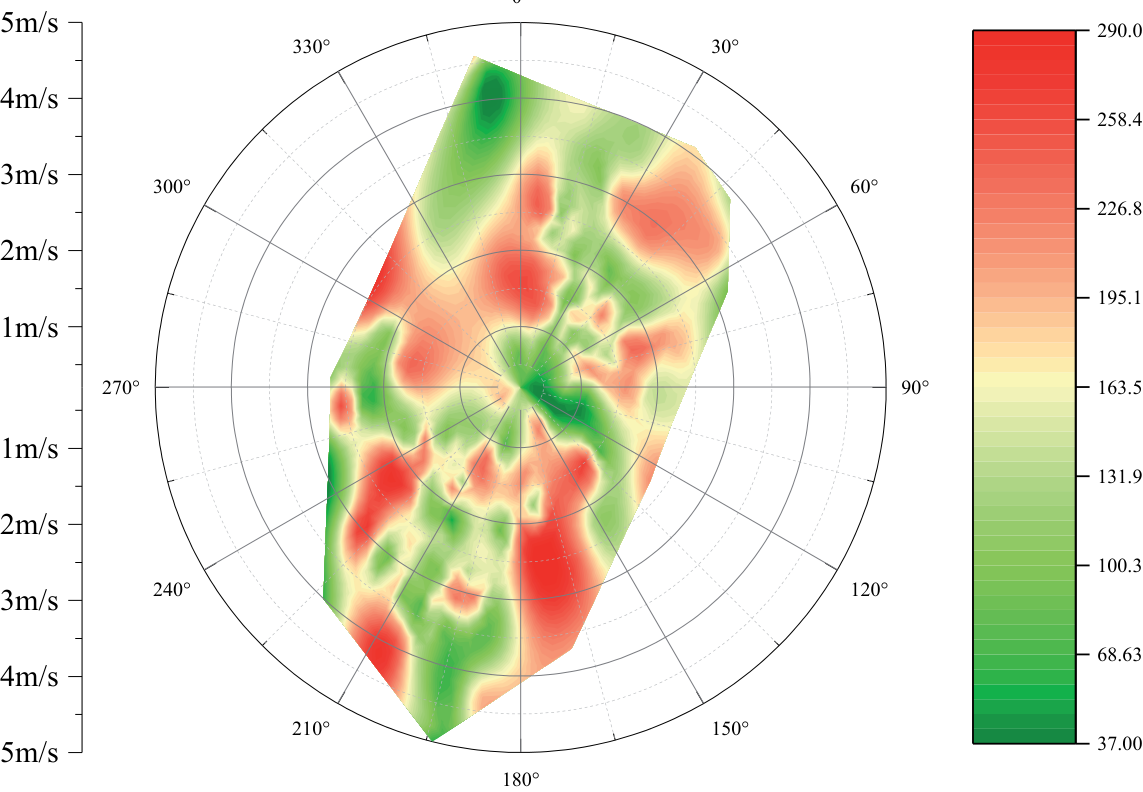
In this study, VOC concentrations were collected from the automatic monitoring station of the Kaifeng Environmental Air Quality Monitoring Network (Kaifeng Environmental Protection Bureau Station). A total of 115 VOC components were detected at the monitoring sites in Kaifeng city, categorized into 7 groups based on their chemical structure: 29 alkanes, 11 olefins, 1 alkyne, 17 aromatic hydrocarbons, 21 oxygenated volatile organic compounds (OVOCs), 35 halogenated hydrocarbons, and 1 organic sulfide. Continuous online VOC data were obtained from the regional atmospheric comprehensive observation and management platform of Henan Province (http://1.192.88.18: 51234/henan/ login.jsp). Temperature, humidity, wind speed, and wind direction data were sourced from the Henan Province Urban Air Quality Big Data Comprehensive Application System (http://10.41.109.141:8081/AirCloudData/login. html). High temperature and low humidity promote higher ozone levels, and ozone pollution is influenced by various wind directions, with the south wind having a greater impact (Fig. 2 and 3). Given the generally low wind speeds (<5m/s), ozone pollution in Kaifeng City during the study period was primarily driven by local sources, with minimal influence from long-distance transmission. In summary, the selected research period was characterized by typical ozone formation conditions, strongly influenced by local pollution, and holds significant practical value for studying and managing ozone pollution in the region.
Testing Methods and Quality Control Measures (QA/QC)
Detection Methods
The automatic monitoring station for VOCs in Kaifeng City’s ambient air quality utilizes XHVOC6000 for pre-treatment and the Shimadzu GC/MS gas chromatography-mass spectrometer for post-treatment, enabling real-time continuous monitoring with a sampling frequency of 1 hour. The pre-treatment process involves enriching the gas sample using a capture tube, followed by thermal desorption into a cold trap for aggregation and subsequent thermal desorption into the gas chromatography-mass spectrometer for analysis. Ethane, ethylene, acetylene, propane, and propylene were detected by gas chromatography, where different substances are separated based on the partition coefficient differences between the stationary and mobile phases. These compounds are then qualitatively and quantitatively analyzed using retention time and other parameters. The remaining 110 substances were detected by the mass spectrometry detector, with a mass-to-charge ratio (m/z) range of 1.5 to 1100. Sample molecules are ionized using an inert high-sensitivity ion source, producing ions and fragment ions, which are separated by the mass analyzer according to their mass-to-charge ratios. Finally, the signals are detected, amplified, and recorded to generate the mass spectrum. The entire system is capable of detecting a total of 115 VOCs.
Quality Control Measures (QA/QC)
During the monitoring period, the testing instruments and quality control system adhered to the relevant quality assurance requirements for sample collection, analysis pre-treatment, and standard sample preparation as outlined in the “Technical Requirements and Testing Methods for Continuous Gas Chromatography Monitoring System of Volatile Organic Compounds in Environmental Air (HJ1010-2018)” and the “Technical Regulations for Continuous Automatic Monitoring of Volatile Organic Compounds in Environmental Air of the National Environmental Air Monitoring Network”. The main quality control measures included system-wide blank and single-point quality control checks, as well as sampling flow inspection, all performed weekly. A total of 6 quality control tests were conducted throughout the study period, covering all research phases.
Single-point quality control checks were conducted as follows: after completing the zero gas blank inspection, a 2 nmol/mol standard gas (national standard substance) was introduced. Upon completion of the analysis, the concentration of each compound was recorded, and its relative error compared to the standard gas was calculated. A relative error of ≤30% was considered unacceptable. The qualification rates for each tested component across the 6 single-point quality control checks ranged from 92.2% to 96.5%. Components that did not meet the required standards were excluded from subsequent analysis.
In terms of standard curve construction, the system sampling setting should be consistent with those for ambient air sampling. Concentration points should be introduced sequentially from low to high, and the response for each point should be recorded. A standard curve for forced zero crossing should be generated, with the correlation coefficient R for all components required to be ≥0.99 (corresponding to a determination coefficient, R², of ≥0.98).
During data review, valid data is retained directly. Doubtful data requires verification of equipment status, operation and calibration records, and spectrograms. If data anomalies are identified due to retention time issues, the data should be re-integrated and uploaded again. The data will be invalidated and deleted if the instrument performance fails to meet the required standards. For other questionable data where the cause cannot be confirmed, it should be marked, and the reason should be noted for reference by data analysts. Invalid data should be deleted directly, with the reason for invalidation clearly stated. After filtering and removing abnormal data, valid data should be uploaded and stored.
Analytical Methods
Determination of Study Period
In summer, the photochemical activity in the ambient air is high, and VOCs are prone to volatilization. VOCs can significantly impact ozone formation and other secondary pollutants, making the study of VOC pollution characteristics in summer particularly representative. The monitoring period for this study spanned from May to July 2022, when ozone pollution is most prevalent in Kaifeng. During these 3 months, the hourly ozone concentration gradually increases, reaching peak levels above 200 μg·m-3 (according to the “Ambient Air Quality Standard” (GB3095-2012), the second-level standard for the 1-hour average ozone concentration), and then declines to a lower concentration, completing the full cycle of ozone pollution. This study identified 8 typical ozone pollution episodes. Each episode was divided into 3 stages based on the changes in ozone concentration: the rising period, the duration period, and the dissipating period. The rising period is characterized by ozone concentrations above 200 μg·m-3. The duration period involves concentrations remaining above 200 μg·m-3, and the duration period involves concentrations remaining above 200 μg·m⁻³, and the dissipating period is marked by a decrease from 200 μg·m⁻³ to lower levels, as shown in Table 1.
Ozone Generation Potential
In the photooxidation reaction, the VOC reaction rate varies depending on the species and their contribution to ozone formation. The ozone formation potential (OFP) is commonly used to quantify the contribution of different VOC species to O3 generation. The OFP is calculated as the product of the atmospheric environmental concentration of a VOC species and its maximum incremental reactivity (MIR). The MIR values are based on the coefficients developed by Carter [18], and the calculation is presented in formula (1).
In formula (1), OFPi represented the maximum OFP of a specific VOC in μg·m-3, VOCi denoted the mass concentration of a species in μg·m-3, and MIRi was the maximum incremental reactivity coefficient of the VOC species.
Orthogonal Matrix Factor Analysis (PMF Receptor Model)
In this study, the EPA-PMF5.0 model, widely used in the source apportionment of environmental VOCs, was used for calculation [19]. The detection limit (MDL) and uncertainty (Unc.) of VOCs required for the source analysis using the EPA-PMF5.0 model were determined through the following methods:
VOC species MDL: In accordance with the relevant requirements outlined in the “National Environmental Air Monitoring Network: Technical regulations for Continuous Automatic Monitoring of Volatile Organic Compounds (Trial)”, the instrument’s detection limit is determined annually under normal operating conditions.
The missing values in this study were replaced by the median of the corresponding species, with a median uncertainty of 4 times the value. Data below or equal to the detection limit
(MDLs) were replaced by 1/2 MDLs, with an uncertainty of 5/6 MDLs. The uncertainty for data exceeding the detection limit (Unc.) was calculated using formula (3):
Where the error fraction represented the error coefficient, the concentration referred to the VOC concentration (μg·m-3), and the error coefficient was set between 10% and 50% [20].
The error percentage in this study was 20%. The residuals of VOCs calculated by the model ranged from -3.0 to 3.0. VOC components with a signal-to-noise ratio greater than or equal to 2.0 were selected. The final source apportionment of VOC species during the rising, duration, and dissipating periods included 47, 38, and 45 species, respectively. The model ran 20 baseruns and ultimately set the number of factors to 4, 5, and 5 for each period. The ratios of q_true to q_robust were 0.9, 0.8, and 0.9, respectively.
Table 1.
Phase decomposition of 8 ozone pollution processes during the monitoring period.
Results and Discussion
Characteristics of VOCs during Typical Ozone Pollution in Kaifeng City
Changes in VOC Concentrations at Each Stage of a Typical Pollution Process
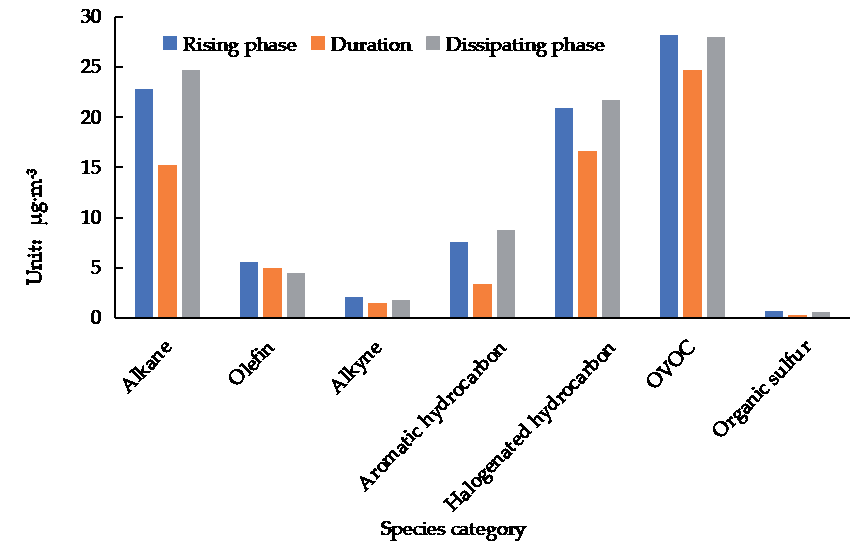
To investigate the characteristics of VOC pollution in Kaifeng city, our first objective was to track the changes in VOC concentrations at each stage of the pollution process. Subsequently, we analyzed the variations in VOC concentrations during each phase of a typical pollution event. Fig. 4 shows the changes in VOC concentrations at each stage of the selected typical pollution event. Except for olefins, most VOC categories show a gradual decline in concentration. Other categories exhibit a U-shaped trend, including alkanes, alkynes, aromatics, halogenated hydrocarbons, OVOCs, and organic sulfur compounds. This means that concentrations are higher during the rising and dissipating periods and lower during the sustained period. This pattern reflects the accumulation-consumption-reaccumulation cycle of VOC pollutants during the pollution process in Kaifeng City.
The average concentrations of TVOC during the ascending, sustained, and dissipating periods were 87.78 μg·m-3, 66.81 μg·m-3, and 89.98 μg·m-3, respectively. Among the various VOC categories, OVOCs had the highest concentrations in all three periods, with values of 28.21 μg·m-3, 24.72 μg·m-3, and 27.98 μg·m-3, respectively. This may be attributed to the primary emissions of human activities and the secondary formation of pollutants from primary sources. The concentrations of alkanes, olefins, aromatic hydrocarbons, and halogenated hydrocarbons were also relatively high. The primary sources of alkanes and alkenes include vehicle exhaust emissions, fuel volatilization, and incomplete combustion [21]. Aromatic hydrocarbons mainly originate from the generation and use of coatings, organic solvents, and industrial production [22]. Halogenated hydrocarbons are predominantly emitted by industrial activities and refrigerants in residential areas [23]. Alkyne and organic sulfur compound concentrations were relatively low, as each category includes only one species (acetylene and carbon disulfide, respectively).
This finding differs from the VOC concentration data for winter in Kaifeng City [24], where alkanes represent the highest proportion of VOCs, accounting for 37.7%, followed by halogenated hydrocarbons at 23.5%, aromatic hydrocarbons at 16.8%, and OVOCs at 12.6%. The higher proportion of alkanes in winter may be attributed to combustion emissions from residential heating, while the elevated proportion of OVOCs in summer could be linked to solvent volatilization and the secondary formation of pollutants. When comparing VOC concentration proportions across different regions during the same season, Kaifeng City shows notable differences from Handan City [25] and Qingdao City [26]. In both Handan and Qingdao, alkanes constitute the largest proportion of VOCs during ozone pollution episodes. These differences may be due to variations in energy sources, industrial structures, and pollutant emissions between Kaifeng, Handan, and Qingdao.
Trends in Top 10 VOCs
A statistical analysis was conducted on the average VOC concentration at each stage to investigate the concentration dynamics of VOCs during the rising, sustained, and dissipating stages and provide a foundation and general direction for future research. As shown in Fig. 5(a-c), the total concentrations of the top 10 VOC species accounted for 53.1%, 58.8%, and 53.3% of the TVOC concentrations during the rising, duration, and dissipating stages, respectively.
Nine VOC species, including acetone, ethane, acetaldehyde, propane, dichloromethane, chloromethane, freon-12, n-butane, and toluene, were consistently among the TOP 10 VOCs during both the rising and dissipating periods. This consistency suggests that the pollution sources impacting environmental receptors were primarily associated with solvent usage, fossil and biomass combustion, and background environmental pollutants. Notably, ethyl acetate appeared in the top 10 during the rising stage, while isopentane emerged during the dissipating stage, indicating additional influences from solvent usage and traffic emissions on environmental receptors.
During the sustained stage, 8 VOC species, including acetone, ethane, acetaldehyde, propane, dichloromethane, chloromethane, freon-12, and n-butane, remained consistent with the TOP 10 species observed during both the rising and dissipating stages. This consistency indicates that the pollution sources affecting environmental receptors were primarily related to solvent use, fossil and biomass fuel combustion, and background environmental pollutants. In contrast, the presence of isopentane and ethylene highlights the additional impacts of fossil fuel combustion and transportation emissions on environmental receptors.
Fig. 5.
Comparison of the TOP10 concentrations of VOC species in different stages of typical pollution processes a) rising period; b) duration; c) dissipating period.
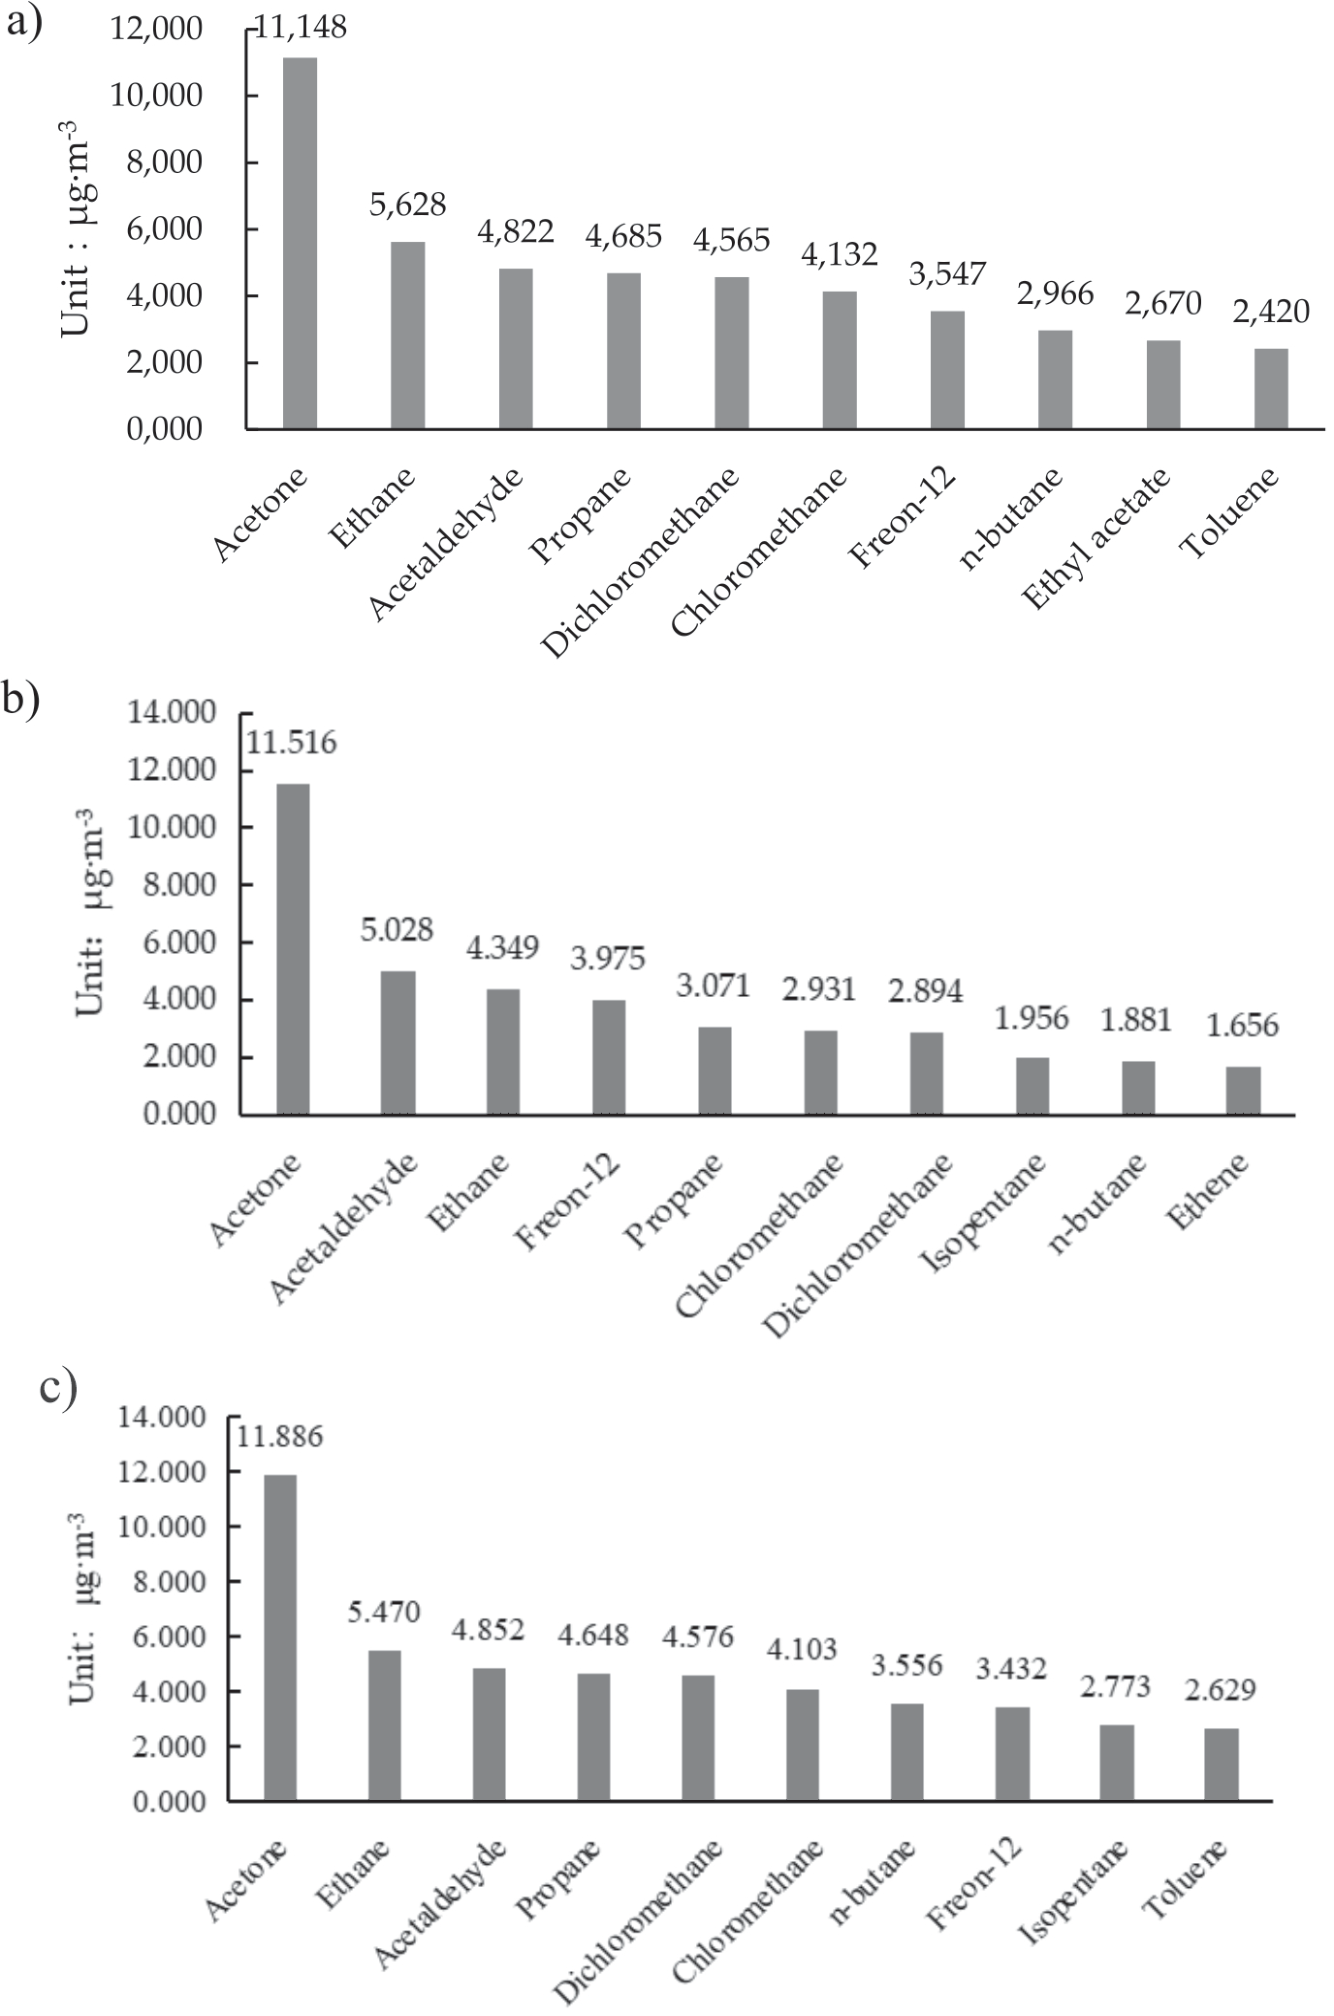
The acetone concentration exhibited minimal variation across the three stages, ranging from 11.148 to 11.886 μg·m⁻³. Acetone in environmental receptors is primarily considered to originate from photochemical reactions and solvent use in the coating industry [27, 28]. Due to its low reactivity in the atmosphere and relatively long atmospheric lifetime, approximately 53 days for removal by hydroxyl radicals (·OH) and around 60 days for photolysis [29], acetone can persist and accumulate in ambient air. This accumulation contributes to a gradual increase in its concentration. The concentrations of ethane, propane, n-butane, isopentane, ethylene, chloromethane, and dichloromethane showed a decreasing trend during both the rising and dissipating stages. Specifically, ethane decreased by 22.7% and 20.4%, propane by 34.5% and 33.9%, n-butane by 36.6% and 47.0%, isopentane by 17.5% and 29.5%, and ethylene by 25.0% and 23.0%, respectively. Chloromethane concentrations declined by 29.1% and 28.6%, while dichloromethane decreased by 36.6% and 36.8%, respectively. Previous studies have indicated that ethane, propane, n-butane, and other low-carbon alkanes and ethylene primarily originate from vehicle emissions, whereas isopentane is largely attributed to oil and gas volatilization. These species possess high MIR coefficients [18], making them more susceptible to atmospheric photochemical consumption. Chloromethane plays a significant role in ozone depletion within the troposphere [30], while the increasing emissions of dichloromethane have been linked to the delayed recovery of the ozone hole [31]. Over time, the observed decreases in chloromethane and dichloromethane concentrations are likely attributable to their active participation in ozone-depleting reactions.
The ethyl acetate and toluene concentrations during the rising and dissipating phases did not rank among the top ten in the sustained stage. Specifically, ethyl acetate concentration during the sustained phase decreased by 66.1% and 50.0% compared to the rising and dissipating phases, respectively. Similarly, the concentration of toluene during the sustained phase decreased by 63.8% and 66.6% compared to the rising and dissipating phases, respectively. The presence of ethyl acetate and toluene in environmental receptors is primarily attributed to the volatilization and usage of solvents [31]. The off-peak production periods for solvent users may contribute to a reduction in emissions during the duration phase, while emissions accumulate during the rising and dissipating phases and are significantly mitigated by photochemical reactions during the duration phase.
The concentration of freon-12 in the duration phase increased by 12.1% and 15.8% compared to the rising and dissipating periods, respectively. Freon-12 is relatively stable in the atmospheric environment and is typically considered a background pollutant. Its increase during the duration phase may be attributed to anthropogenic activities in high-temperature environments and potential transmission effects.
The ratios between the characteristic components are commonly used to identify the primary sources of VOC emissions. The benzene/toluene (B/T) ratios of the rising, duration, and dissipating phases of the typical O3 pollution process are 0.9, 1.6, and 0.8, respectively. According to previous studies [32, 33], the sources of aromatic hydrocarbons during the rising and dissipating periods are not limited to motor vehicle exhaust but also include petrochemical processes and fossil fuel combustion. This finding is consistent with the results of Han Meng et al. [34] from a study conducted in Tianjin during the summer (B/T ratio of 0.75). In contrast, the aromatic hydrocarbons observed during the sustained phase are primarily attributed to the combustion of biofuels and charcoal, a pattern similar to that reported by Hsieh [35], and may be linked to biomass fuel power generation in Kaifeng City.
The sources of pentane in the environment are diverse, and the isopentane/pentane ratio (i/n) is commonly used to approximate the source of VOCs. The isopentane/pentane ratios during typical ozone pollution’s rising, duration, and dissipating periods are 1.9, 2.7, and 2.0, respectively. Pentane-derived emissions from natural gas and liquid gasoline are described in the rising and dissipating phases [36], with a source profile similar to that indicated by the B/T ratio. The i/n ratio during the rising and dissipating periods is consistent with the findings of Li [37] in Tai’an City (2.06). However, the i/n ratio during the sustained phase in Kaifeng City is notably higher than in Tai’an City. While both cities share common VOC sources, Kaifeng City exhibits distinct characteristics associated with combustion sources.
In summary, during the duration and the dissipating phases, the pollution affecting environmental receptors may originate from a variety of sources, including solvent use, fossil and biomass fuel combustion, environmental background pollutants, and traffic emissions. However, during the duration phase, the primary sources of pollution are largely attributed to solvent use, fossil and biomass fuel combustion, and environmental background pollutants. Isopentane and ethylene, in particular, serve as indicators of the influence of fossil fuel combustion and transportation emissions on environmental receptors.
Analysis of OFP of Atmospheric VOCs in Different Stages
In order to investigate the impact of VOCs on various phases of ozone pollution, the OFP of atmospheric VOCs was analyzed. As shown in Table 2, the TOFP during the rising, duration, and dissipating phases of the typical pollution period were 182.83 μg·m-3, 146.31 μg·m-3, and 182.11 μg·m-3, respectively. This reflects an overall accumulation pattern during the rising phase, consumption during the duration phase, and reaccumulation in the dissipating phase. The OFP distribution of various VOCs during the rising phase followed the order: OVOC>olefin> aromatic hydrocarbon >alkane>halogenated hydrocarbon>alkyne>organic sulfur compounds. During the duration phase, the order was: OVOC>alkenes>alkanes>aromatics >alkynes>halogenated hydrocarbons > organic sulfur. During the dissipating period, the order was: OVOC >olefin>aromatic hydrocarbon>alkane>halogenated hydrocarbon>alkyne>organic sulfur compounds. The OFPs from the four VOC groups, OVOCs, olefin, aromatic hydrocarbon, and alkanes, were the primary drivers of TOFP. Therefore, controlling the sources of these VOCs during the rising and dissipating periods is crucial for mitigating the formation of high ozone concentrations during the sustained phase.
The OFP ratio of OVOCs ranged from 38.5% to 45.5%, which was the highest among all VOC categories across each phase. OVOCs were significant contributors to ozone production throughout all phases. During the duration phase, the OFP of OVOC represented the largest proportion of the total TOFP, although its value is lower compared to the rising and the dissipating phases. This decrease might be attributed to the fact that OVOCs in environmental receptors originated not only from primary emissions but also from secondary formation through photochemical reactions.
The OFP ratio of olefins ranged from 25.8% to 35.9%. Olefins generally had high MIR values, making them a key VOC category that warranted focused management and control. The OFP proportion of aromatic hydrocarbons ranges from 7.8%-21.0%, with a significant decrease observed during the duration phase. The higher OFP values during the rising and dissipating phases might be attributed to the peak emissions from certain solvent-using industries. However, the aromatic pollutants released by these industries were largely consumed through photochemical reactions during the sustained phase.
The OFP contribution rates for alkanes and halogenated hydrocarbons were highest during the dissipating phase, followed by the rising and the duration phases. This suggests that while alkanes and halogenated hydrocarbons undergo some consumption during the sustained phase, their primary sources are likely transportation and industrial production. In contrast, the OFP and contributions from alkynes and organic sulfur compounds were relatively low, indicating that these VOCs have a minimal impact on ozone formation.
In summary, the OFP contribution rates of the top 10 VOC species during the three phases were 65.8%, 71.8%, and 64.2%, respectively, significantly influencing the OFP levels during each phase. The top 10 VOCs during each stage belonged to OVOCs, olefin, and aromatic hydrocarbons. The high levels of ethylene, propylene, and acrolein during the rising phase indicated that fossil fuel combustion and industrial production might considerably impact ozone formation during the rising phase. In the sustained phase, elevated concentrations of acetaldehyde, propionaldehyde, methylacrolein, and isoprene indicate that industrial activities, plant emissions, and combustion sources may play a major role in ozone generation. During the dissipating phase, VOCs such as m/p-xylene, toluene, o-xylene, acetone, and n-butyl aldehyde showed high concentrations, suggesting that industrial production and solvent use significantly contribute to ozone formation.
Overall, the OFP contributions from four major VOC categories – OVOCs, olefins, aromatic hydrocarbons, and alkanes – accounted for the majority of the TOFP during the typical pollution period. In contrast, alkynes and organic sulfur compounds contributed less, having a minimal effect on ozone generation. OVOCs made the largest contribution to TOFP in all three phases, followed by olefins in the sustained phase and aromatic hydrocarbons in the rising and dissipating phases. These findings align with previous research conducted during the summer in Shijiazhuang [38] and Yinchuan [39]. OVOCs, as intermediate products of photochemical reactions, are primarily secondary pollutants in Kaifeng City, highlighting the significant role of secondary formation in atmospheric ozone generation. Despite the relatively low concentrations of olefins and aromatic hydrocarbons across all stages, their high MIR values and reactivity underscore their substantial contribution to the overall OFP.
Table 2.
OFP contribution rates of the main species during different phases.
Analysis of VOC Sources in Typical Ozone Pollution Processes
Orthogonal Matrix Factor Analysis of Rising Phase VOCs
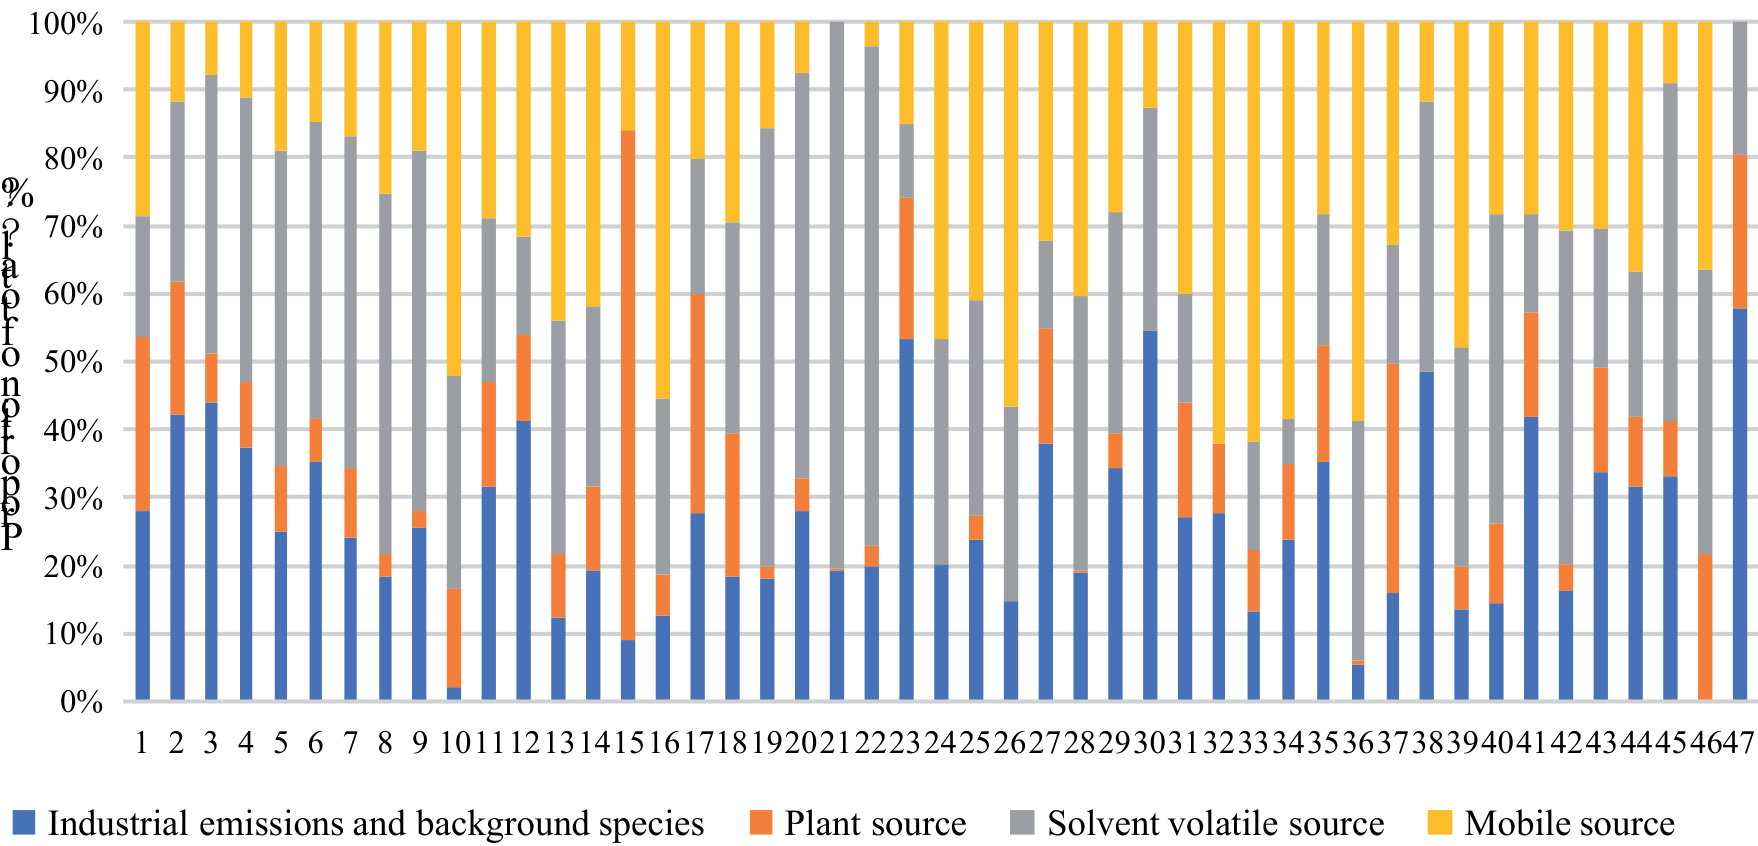
To explore the sources of VOCs during each phase of typical ozone pollution process, the hourly VOC data were analyzed using the Positive Matrix Factorization (PMF) receptor model. The source analysis results for the rising phase are shown in Fig. 6. Four potential pollution factors were identified. Factor 1, which was dominated by carbon disulfide, accounted for the largest proportion, followed by 1,2-dichloropropane and freon-12. Carbon disulfide is commonly used in the polymer material industry and is relatively stable in the environment. Freon-12, with its high concentration and significant contribution from regional background emissions, also played a key role. 1,2-dichloropropane, which is utilized as a raw material and organic solvent in industrial processes [40], contributed to this factor. The ratio of acetaldehyde to propanaldehyde (C2/C3) in this factor was 4.8, indicating that human activities significantly influence aldehydes and ketones during the rising phase. Therefore, Factor 1 is attributed to industrial emissions and regional background sources. Factor 2, with isoprene as the dominant contributor, is identified as a source of plant emissions, as isoprene is a well-known biogenic VOC [41]. Factor 3, characterized by the highest concentrations of M-/p-xylene, o-xylene, and ethylbenzene, was identified as a source of solvent volatilization, supported by the B/T ratio of 0.45, which suggests that, in addition to traffic exhaust, sources like paint and solvent evaporation also contribute aromatic hydrocarbons to the atmosphere.
In addition, Factor 4, which showed the highest contribution from n-butanal, followed by acrolein, methyl tert-butyl ether (MTBE), propionaldehyde, chloroethane, 1,3-butadiene, and 2,4-dimethylpentane, was identified as a source of motor vehicle emissions. Previous studies have shown that n-butanal is primarily associated with gasoline and diesel vehicle exhausts [42, 43], while MTBE is a gasoline additive, and 1,3-butadiene is a typical pollutant emitted by medium-sized trucks. Therefore, Factor 4 is linked to motor vehicle emissions. In summary, the main sources of VOCs during the rising period include industrial emissions (with a significant contribution from background sources), plant emissions, solvent volatilization, and motor vehicle emissions.
Fig. 6.
Fingerprint analysis of VOC sources during the rising period of typical ozone pollution processes. Notes: Species 1-47: 1. ethane, 2. propane, 3. isobutane, 4. normal butane, 5. isopentane, 6. n-pentane, 7. 2-methylpentane, 8. 3-methylpentane, 9. n-hexane, 10. 2,4-dimethylpentane, 11. ethene, 12. propylene, 13. trans-2-butene, 14. cis-2-butene, 15. isoprene, 16. 1,3-butadiene, 17. acetylene, 18. benzene, 19. toluene, 20. ethylbenzene, 21. M-p-xylene, 22. O-xylene, 23. freon-12, 24. chloromethane, 25. bromomethane, 26. chloroethane, 27. freon-11, 28. dichloromethane, 29. 1,2-dichloroethane, 30. 1,2-dichloropropane, 31. acetaldehyde, 32. n-butyraldehyde, 33. acrolein, 34. propanal, 35. acetone, 36. methyl tert-butyl ether, 37. methylacrolein, 38. valeraldehyde, 39. caproaldehyde, 40. isopropyl alcohol, 41. vinyl acetate, 42. ethyl acetate, 43. 2-butanone, 44. tetrahydrofuran, 45. crotonal, 46. benzaldehyde, 47. carbon disulfide.
Orthogonal Matrix Factor Analysis of Duration Phase VOCs
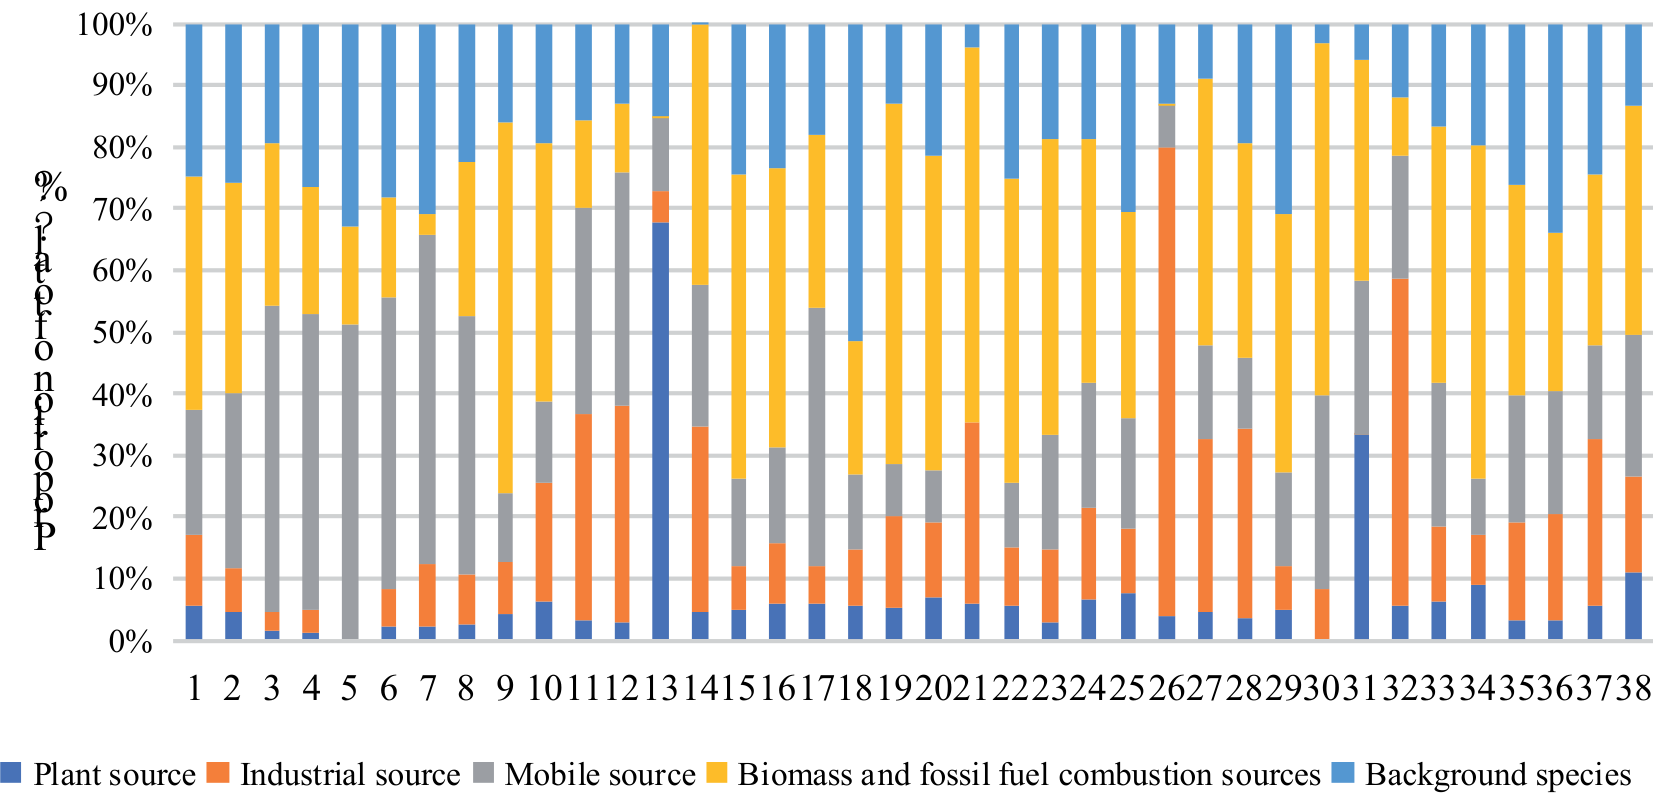
The analysis results of VOC sources during the duration phase, as shown in Fig. 7, revealed five possible pollution factors. Factor 1 was primarily characterized by a high proportion of n-butanal, with notable concentrations of hexal, cis-2-butene, and trans-2- butene. Studies have shown that n-butanal is associated with the fine chemical industry [44], while hexal, cis- 2-butene, and trans-2-butene are typical components of industrial emissions [45]. Therefore, Factor 1 is identified as an industrial source. Factor 2 was dominated by high concentrations of freon-12, which contributed significantly as a regional background substance. Additionally, acetaldehyde and acetone were prominent in this factor, indicating its association with background sources [24]. Factor 3, which was characterized by alkanes in the C4-C6 range, with 2-methylpentane as the dominant compound, is identified as a mobile source. 2-Methylpentane is a well-known marker of gasoline vehicle emissions and further supports this identification.
Factor 4, in which isoprene was the predominant contributor, is recognized as a source of plant emissions, consistent with the biogenic origin of isoprene [41]. Finally, Factor 5 was characterized by a variety of compounds, including chloroethane, ethylene, chloromethane, methyl tert-butyl ether, acetylene, and benzene. Chloroethane and dichloromethane are known tracers of biomass combustion (USEPA, 1989), while acetylene is the signature compound of combustion processes [44]. Ethylene is typically emitted from incomplete combustion or petrochemical activities [24, 45], and dichloromethane also serves as a marker for combustion sources. The benzene/toluene ratio in this factor exceeded 1, a characteristic indicative of biomass combustion. Methyl tert-butyl ether, a gasoline additive, is also released during combustion. Therefore, Factor 5 is identified as a source of biomass and fossil fuel combustion. In summary, the main VOC sources during the duration phase can be attributed to industrial emissions, regional background species, mobile sources, plant emissions, and biomass and fossil fuel combustion.
Orthogonal Matrix Factor Analysis of Dissipating Phase VOCs
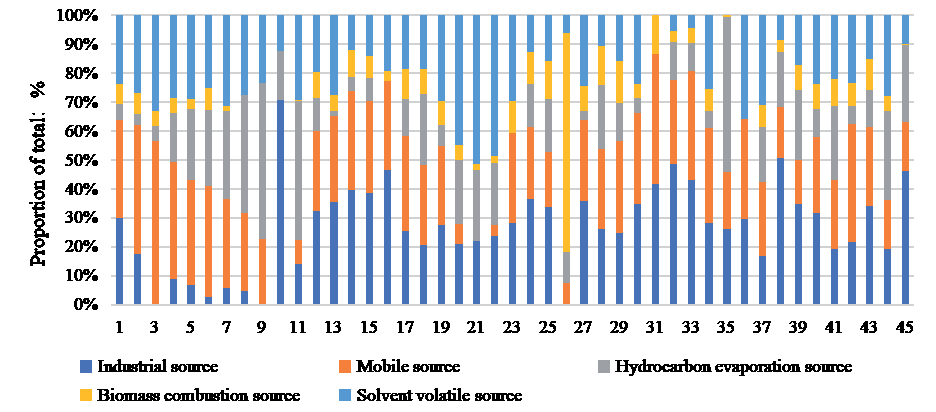
The analysis of VOC sources during the dissipating phase, shown in Fig. 8, identified five potential pollution factors. Factor 1 was predominantly characterized by 2,4-dimethylpentane, followed by hexal, 1,3-butadiene, cis-2-butene, and trans-2-butene, all exhibiting high concentrations and proportions. Studies have indicated that n-butanal comes from the fine chemical industry [44], while hexal, 1,3-butadiene, cis-2-butene, and trans-2-butene are typical components of industrial emissions [45]. Therefore, Factor 1 is attributed to industrial sources. Factor 2 had the highest proportion of isobutane, with notable contributions from n-butanaldehyde and 2-butanone. Both isobutane and n-butanaldehyde are well-established tracers of gasoline vehicle emissions, and 2-butanone is also commonly detected in automobile exhaust. Thus, Factor 2 is identified as a mobile source. Factor 3 was primarily composed of n-hexane, n-heptane, and methyl tert-butyl ether. N-hexane and n-heptane are long-chain alkanes primarily associated with gasoline volatilization, while MTBE is a gasoline additive. Consequently, Factor 3 is attributed to oil and gas evaporation. Factor 4 was dominated by chloroethane, a known tracer of biomass combustion [43], indicating that this factor is associated with biomass combustion sources. Finally, Factor 5, characterized by M-/p-xylene, o-xylene, and ethylbenzene, is linked to solvent volatilization. Therefore, Factor 5 is identified as a source of solvent emissions. In summary, the primary sources of VOCs during the dissipating period include industrial emissions, mobile sources, oil and gas evaporation, biomass combustion, and solvent volatilization.
Fig. 7.
Fingerprint analysis of VOC sources during the duration of typical ozone pollution processes. Notes: 1. ethane, 2. propane, 3. isobutane, 4. normal butane, 5. isopentane, 6. n-pentane, 7. 2-methylpentane, 8. n-hexane, 9. ethene, 10. propylene, 11. trans-2-butene, 12. cis-2-butene, 13. isoprene, 14. 1,3-butadiene, 15. acetylene, 16. benzene, 17. toluene, 18. freon-12, 19. chloromethane, 20. bromomethane, 21. chloroethane, 22. freon-11, 23. dichloromethane, 24. 1,2-dichloroethane, 25. acetaldehyde, 26. n-butyraldehyde, 27. acrolein, 28. propanal, 29. acetone, 30. methyl tert-butyl ether, 31. methylacrolein, 32. caproaldehyde, 33. isopropyl alcohol, 34. vinyl acetate, 35. ethyl acetate, 36. 2-butanone, 37. tetrahydrofuran, 38. Benzaldehyde.
Analysis of the Contribution of Various VOCs Sources
Key VOC Sources during Each Phase
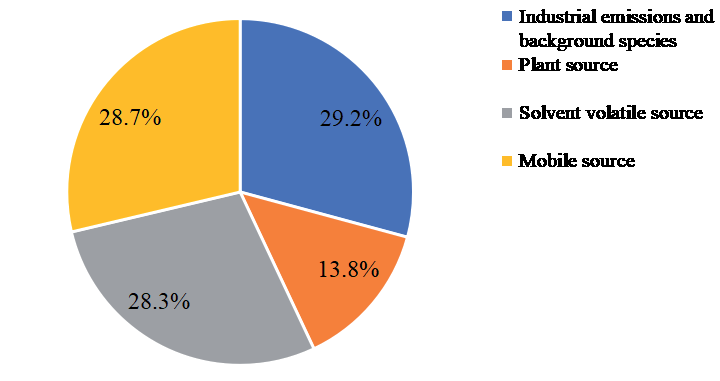
Based on the analysis of various VOC emission sources across different phases, the contributions of these sources during the rising, duration, and dissipation phases were calculated to identify the key VOC contributors during each phase. As shown in Fig. 9-11, the proportion of VOC sources during each phase is as follows: During the rising phase, industrial emissions and background species contribute the most, followed by mobile sources, solvent volatile sources, and plant emissions. During the duration phase, biomass and fossil fuel combustion sources make the largest contribution, followed by background species, mobile sources, industrial emissions, and plant emissions. During the dissipating phase, mobile sources contribute the most, with solvent volatilization, oil and gas evaporation, and biomass combustion sources being important. In summary, the VOC sources with the highest contribution during each phase are as follows: industrial emission and background species dominate during the rising phase, biomass and fossil fuel combustion sources prevail during the duration phase, and mobile sources are the primary contributors during the dissipation phase.
The Contribution Characteristics of VOC Sources to Typical Phases of Ozone Pollution
Different VOC sources exhibit varying contribution characteristics during each phase. Fig. 9-11 show that mobile sources contributed 28.7%, 19.1%, and 28.3% during the rising, duration, and dissipating phases, respectively. The higher contributions observed during the rising and dissipating phases can likely be attributed to the morning and evening peak traffic hours, when traffic is heavier and vehicle emissions increase due to slower speeds or idling. In contrast, during the duration phase, traffic volumes are lower, flow is smoother, and vehicle emissions are reduced. Therefore, it is necessary to decrease the number of gasoline-powered vehicles further, optimize traffic flow, and minimize vehicle idling during periods of congestion.
During the rising phase, there was a notable difference in the contribution of industrial sources (11.1%) and background species (25.1%). In contrast, during the dissipating phase, the proportion of industrial sources increased to 27%. This change may be attributed to the off-peak production schedules of industrial enterprises, which likely accumulated emissions during the phases with poor ozone formation conditions. As photochemical reaction conditions improved, the more reactive pollutants from the rise and duration phases were gradually consumed, leading to an increased contribution from background species with low reactivity. Therefore, despite peak industrial production, it remains crucial to strengthen the pollution control measures for VOC-emitting industries to further reduce emissions. Solvent volatile sources contributed significantly in both the rising phase (28.3%) and the dissipating phase (23.6%). This can be attributed to the night-time production schedules of relevant industrial enterprises using solvents, which increase the concentration of VOC emissions. As solvent-based emissions are a major source of pollution, efforts should be made to promote the environmentally friendly substitution of solvent materials, improve the collection and treatment of unorganized pollutants during solvent use, and reduce VOC emissions resulting from volatilization.
Fig. 8.
Fingerprint analysis of VOC sources during the dissipating phase of typical ozone pollution processes. Notes: 1. ethane, 2. propane, 3. isobutane, 4. normal butane, 5. isopentane, 6. n-pentane, 7. 2-methylpentane, 8. 3-methylpentane, 9. n-hexane, 10. 2,4-dimethylpentane, 11. normal heptane, 12. ethene, 13. propylene, 14. trans-2-butene, 15. cis-2-butene, 16. 1,3-butadiene, 17. acetylene, 18. benzene, 19. toluene, 20. ethylbenzene, 21. m-p-xylene, 22. O-xylene, 23. freon-12, 24. chloromethane, 25. bromomethane, 26. chloroethane, 27. freon-11, 28. dichloromethane, 29. 1,2-dichloroethane, 30. acetaldehyde, 31. n-butyraldehyde, 32. acrolein, 33. propanal, 34. acetone, 35. methyl tert-butyl ether, 36. methylacrolein, 37. valeraldehyde, 38. caproaldehyde, 39. isopropyl alcohol, 40. vinyl acetate, 41. ethyl acetate, 42.2-butanone, 43. tetrahydrofuran, 44.crotonal, 45. Benzaldehyde.
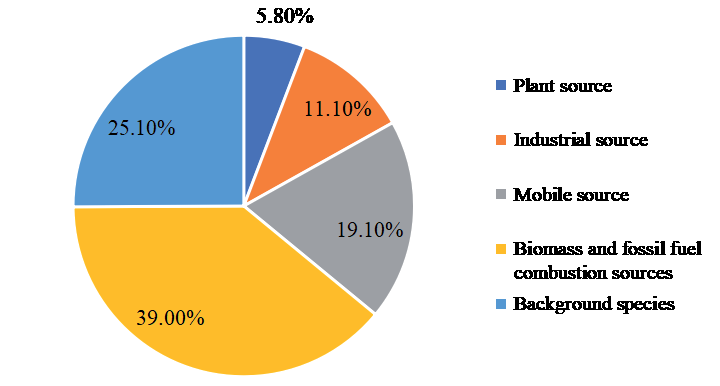
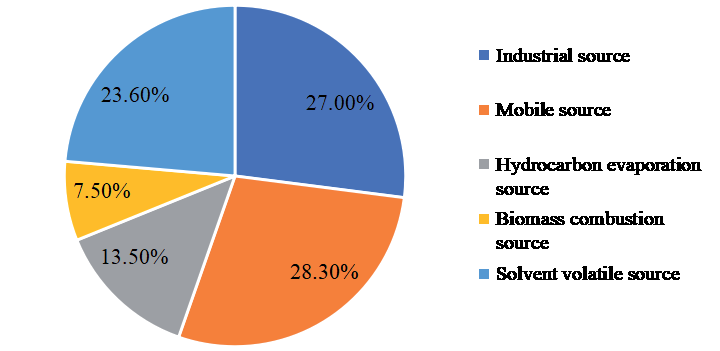
During the duration phase, biomass and fossil fuel combustion sources had the highest contribution (39.0%) to VOC levels, with biomass combustion contributing 7.5% during the dissipating phase. These results show that biomass and fossil fuel combustion significantly influence VOC levels in Kaifeng. Given this, efforts to improve exhaust gas purification and reduce emissions from these combustion sources should be prioritized. Plant emissions were particularly prominent during the rising and duration phases, likely due to the strong photosynthetic activity of plants during the daylight hours.
In summary, mobile sources and industrial emissions consistently contribute to VOC pollution throughout the ozone formation process. Solvent volatilization sources are particularly influential during the rising and dissipating periods, while biomass and fossil fuel combustion contribute significantly during the duration period and continue to impact the dissipating stage. Plant emissions are mainly observed during the rising and duration periods. Mobile sources, industrial emissions, and solvent volatilization are common VOC contributors in many cities during the summer months [14, 34, 36, 46]. The role of plant emissions has also been highlighted in studies conducted in Qingdao [26] and Tianjin [34], while the influence of biomass combustion aligns with findings from Shanghai [46].
This study focused on the impacts of VOC emissions from Kaifeng City, considering the high temperatures and stable weather conditions during the research period. External factors were not analyzed, which represents a limitation of the study. Additionally, VOCs undergo secondary transformation under photochemical conditions, and the interconversion of VOC species requires further investigation. Future research could address these gaps to provide a deeper understanding of the complex dynamics of VOC transformation. Nonetheless, the findings of this study offer valuable insights for ozone pollution control and mitigation strategies.
Conclusions
This research investigates VOC sources during typical ozone pollution events in Kaifeng City, elucidating their characteristics and contributions to ozone formation. The key findings are as follows:
(1) VOC concentrations exhibit a clear accumulation-consumption-reaccumulation pattern, with OVOCs, alkanes, olefins, aromatic hydrocarbons, and halogenated hydrocarbons being the predominant species. Controlling emissions of these VOCs is essential for mitigating ozone pollution in the region.
(2) During the ascending and dissipating phases, acetone, ethane, acetaldehyde, propane, dichloromethane, chloromethane, freon-12, n-butane, and toluene consistently ranked among the top 10 VOCs. These compounds indicate pollution primarily from solvent use, fuel combustion, environmental background, and traffic emissions. During the duration phase, isopentane and ethylene serve as indicators of fossil fuel combustion and transportation-related emissions.
(3) OVOCs, olefins, aromatic hydrocarbons, and alkanes are the primary contributors to TOFP across all phases of the pollution event. This underscores the need for targeted control of VOC sources during the rising and dissipating periods to prevent high ozone levels during the sustained stage.
(4) The contribution of various pollution sources differs across phases. Industrial emissions, mobile sources, solvent volatilization, and biomass/fossil fuel combustion each play a dominant role during different phases of the pollution process, indicating the dynamic nature of VOC contributions over time.
(5) Mobile sources, industrial emissions, solvent volatilization, and biomass/fossil fuel combustion significantly contribute to ozone formation. To mitigate ozone pollution, effective strategies include reducing the number of gasoline vehicles, optimizing traffic flow to minimize idling emissions, controlling industrial and solvent emissions during peak hours, promoting environmentally friendly substitutes for solvent materials, enhancing the management of unorganized emissions, and improving the efficiency of biomass and fossil fuel combustion processes, including the purification of exhaust gasses.
In conclusion, this study identifies the key VOC sources and their contributions to ozone pollution in Kaifeng City. The findings provide valuable insights for developing targeted policies and control measures to reduce VOC emissions and mitigate ozone pollution. In future research, we will focus on investigating the detailed chemical mechanisms of ozone formation under varying environmental conditions, such as high humidity, low temperature, and high altitude. For instance, in high-humidity environments, the study will examine the impact of heterogeneous reactions on aerosol surfaces and the interaction between water vapor and ozone precursors. Additionally, in complex urban environments, the research will consider how multiple pollutants (including particulate matter and acid gasses) interfere with the chemical processes of ozone generation.

