

Introduction
Heavy metals exhibit toxicity and persistence, making it crucial to address their pollution and treatment [1]. Their presence in the environment is largely attributed to human activities, including the use of agricultural chemicals, industrial and domestic wastewater discharges, and exhaust emissions [2, 3].
Compared to heavy metals in the suspended particulate and sedimentary phases, the toxicity of dissolved-phase heavy metals in the aqueous environment is typically more pronounced [4]. Even at low concentrations, these metals can harm multiple organs [5]. Lead (Pb), cadmium (Cd), and arsenic (As) are among the most hazardous heavy metals, capable of causing biotoxicity in the kidneys, liver, and brain [6]. Ackmez reported that zinc (Zn) might lead to smoky fevers and pneumonia [7]. Therefore, to evaluate the risk to human health, it is crucial to understand the concentration levels and spatial distribution characteristics of dissolved heavy metals in aquatic environments.
With a long agricultural foundation and centuries of farming culture, Chaohu Lake has significantly contributed to local economic development [8]. It is crucial to monitor the water quality status of Chaohu Lake due to the recent rapid economic development in the adjoining areas, which has led to some pollution. Previous studies have investigated heavy metal pollution in the lake's water bodies. For example, Li et al. (2011) examined the spatial distribution and sources of six heavy metals: Cu, Cr, Cd, Hg, Zn, and Ni [9]. To obtain more information, in 2021, Wu et al. studied the concentration, distribution, and assessment of twelve heavy metals, namely Cr, Mn, Fe, Ni, Cu, Zn, As, Mo, Cd, Sb, Ba, and Pb [10]. So, it was critical to conduct continuous observation and evaluation. Additional information on heavy metal pollution was inadequate due to the relatively small number of heavy metal types chosen for assessment and study locations in the published research findings. In response to these concerns, this study increased the variety of heavy metal elements and the number of collection sites in the Chaohu Lake and at the entrance of the river to the lake.
Based on the above viewpoints, this study collected 33 water samples and observed 12 heavy metal elements (V, Cr, Mn, Ni, Cu, Co, Zn, As, Cd, Pb, Hg, and Fe). Heavy metal contamination and human health risks were assessed. The results would be useful for water resource management and protection.
Materials and Methods
Study Area
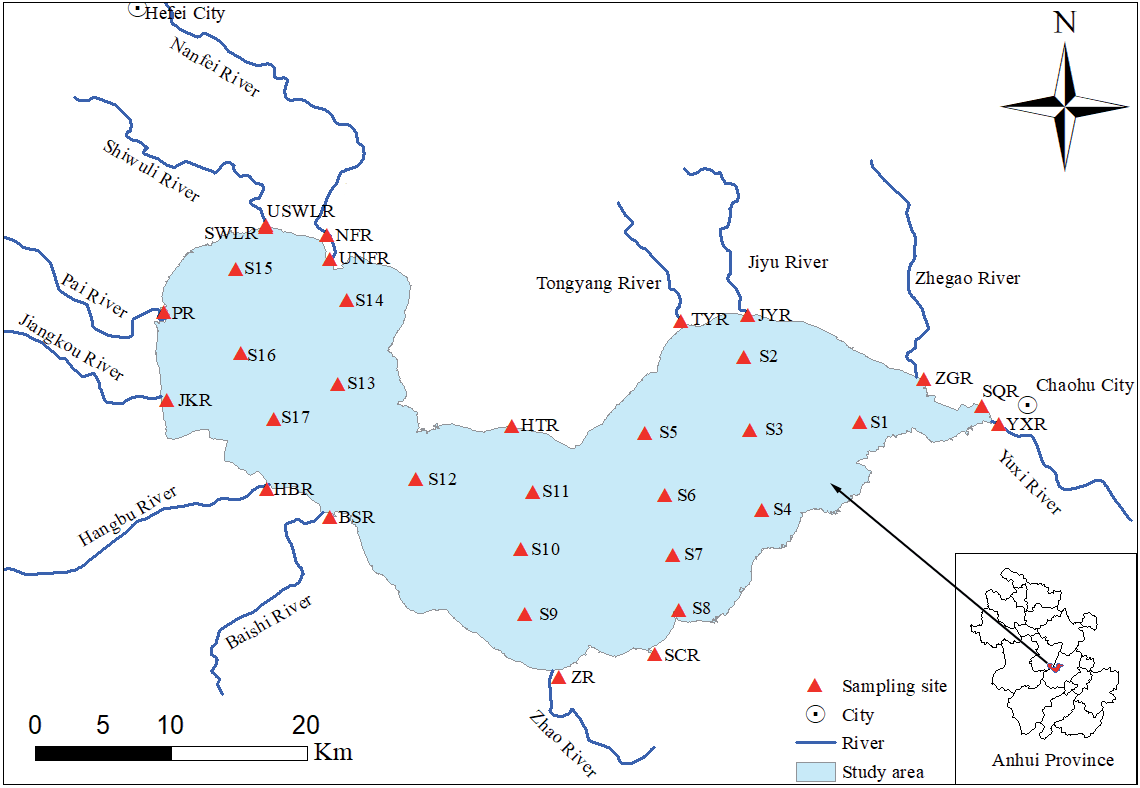
Chaohu Lake is located in the center of Anhui Province, China. Its geographic coordinates are 31°25′28″–31°43′28″ north latitude and 117°16′54″– 117°51′46″ east longitude. Situated between the Yangtze River and the Huaihe River, it has an average annual temperature of 15–16 °C, a watershed area of approximately 1.35 × 10⁵ km², and a total water storage capacity of about 2.1 billion cubic meters, making it the fifth-largest freshwater lake in China [11, 12]. It serves as a vital water resource for Chaohu, Hefei City, and the neighboring towns, and has a significant impact on irrigation, shipping, fishing, tourism, and so on [11, 13]. Due to the rapid economic development in the surrounding agricultural and urban areas, its water quality has been somewhat contaminated. As a result, a quantitative assessment of Chaohu Lake's water quality is important. It can provide a solid foundation for ensuring the safety of the basin's water quality.
Sample Collection and Test Analysis
From May 18 to 20, 2023, samples were collected from 17 lake center locations and 16 river entrances to the lake (Fig. 1). The 17 sampling points in the lake were labeled S1 to S17, while the remaining 16 entrances were labeled as follows: Nanfei River (NFR), Outlet of Nanfei River (UNFR), ShiwuLi River (SWLR), Upper ShiwuLi River (USWLR), Paihe River (PR), Jiangkou River(JKR), Hangbu River (HBR), Baishi River (BSR), Zhao River (ZR), Shici River (SCR), Yuxi River (YXR), Shuangqiao River (SQR), Zhegao River (ZGR), Jiyu River (JYR), Tongyang River (TYR), Huatang River (HTR).
Water samples were collected following the Technical Guidelines for Water Quality Sampling (HJ 494-2009). Using 5L high-density polyethylene (HPDE) containers that had been acid-washed and soaked, samples were taken at a depth of 0.5 m from the water's surface. The 0.45 μm filter membrane was used on-site to filter the water samples collected. A portable turbidimeter (HJ93703-11) was used to measure the turbidity of the water samples, and a portable multi-parameter water quality analyzer (DZB-718L) was used to measure the pH, temperature, conductivity, dissolved oxygen (DO), and oxidation-reduction potential (ORP) of the samples.
After adding nitric acid to the water sample container to adjust the pH to 2, the container was sealed, and the samples were stored at 4°C. According to the "Water Quality Determination of 65 Elements—Inductively Coupled Plasma-Mass Spectrometry," the concentrations of vanadium (V), chromium (Cr), manganese (Mn), cobalt (Co), nickel (Ni), copper (Cu), zinc (Zn), arsenic (As), cadmium (Cd), and lead (Pb) were determined. The concentration of mercury (Hg) was determined using atomic fluorescence spectrophotometry. Iron (Fe) concentrations were determined using an atomic absorption spectrometer. Recovery rates ranged from 82.1% to 108.3%, and parallel samples from the same batch had a relative deviation of less than 5%. The standard solutions used in the analysis were obtained from the National Center for Reference Materials. The standard curve generated from the standard solutions during the determination and analysis was fitted using linear regression, with its coefficient of determination (R²) exceeding 0.999.
Heavy Metal Pollution Index
The Heavy Metal Pollution Index (HPI) was a parameter that assessed the impact of heavy metal elements on overall water quality. HPI was calculated by Eq. (1).
where, Qi was the sub-index of ith heavy metal parameter, and n was the number of samples used in this study. Qi was calculated using Eq. (2).
where ci represented the concentration value (μg/L) of ith heavy metal, and Si represented the maximum permissible value of the ith heavy metal in the drinking water standard. The maximum allowable values of the World Health Organization (WHO) drinking water guidelines were chosen as the background values for Si in this study [14]. Wi was the weight assigned by HPI to the heavy metal parameter chosen by Eq. (3).
For ease of calculation, the proportionality constant k was set to 1 [15]. To better characterize pollution level of heavy metal, three corrected quantities were used: low (HPI<15), medium (15≤HPI≤30), and high (HPI>30) [16].
Human Health Risk Evaluation
The primary ways humans are exposed to heavy metals in the environment include direct ingestion, dermal contact, and oral-nasal (respiratory) pathways [17, 18]. Chronic daily intake (CDI) by ingestion and dermal absorption is defined as the amount of a contaminant consumed daily per kilogram of body weight through oral, dermal, or oro-nasal absorption [10]. Direct ingestion and dermal contact are the most significant routes of exposure to heavy metals in the aqueous environment for the human body. Therefore, ingestion and dermal contact CDIs are defined by Eqs. (4) and (5) [19, 20]. Supplementary Table S1 provides the definitions and values of additional parameters and variables.
Carcinogenic risk (CR) and non-carcinogenic risk (HQ) were used to quantify the risk characterization. The Hazard Quotient (HQ) assessed the possibility of non-carcinogenic risk. Specific calculations can be found in Eq. (6) and (7).
The RfD values for the selected heavy metals in this study (mg kg⁻1day⁻1) were obtained from the US Environmental Protection Agency, RfD for skin contact (RfDdermal) equals RfDIngestion×ABSGI (Gastrointestinal absorption index). In general, HQ>1 indicates pollution levels that may pose a non-carcinogenic risk to human health, the presence of HQ<1 indicates negligible non-carcinogenic risk. The hazard index (HI) was calculated by adding the HQ for all pathways, reflecting the total potential non-carcinogenic risk of the above pathways, the hazard index was calculated using Eq. (8) [21]. Calculations of CR for different pathways are defined in Eq (9), (10) and (11).
The carcinogenicity slope factors (SF, μg⁻1 kg day) reference values are shown in Table S1. CI value of less than 10⁻6 represents a negligible cancer risk; CI value between 10⁻4 and 10⁻6 represents an acceptable cancer risk; and CI value greater than 10⁻4 represents an unacceptable cancer risk [22].
In a 2013 report, the International Agency for Research on Cancer (IARC) identified Cr, Co, Ni, As, and Cd as carcinogenic to humans. This study assessed both the carcinogenic and non-carcinogenic risks associated with Cr and Ni, while only the non-carcinogenic risks were assessed for the remaining ten heavy metals (V, Mn, Co, Cu, Zn, As, Cd, Pb, Hg, and Fe) [23].
Statistics and Analysis
Correlation analysis was conducted to evaluate the relationships among heavy metals. Factor analysis (FA) was applied to reduce dimensionality. The Kaiser-Meyer-Olkin (KMO) test, with a coefficient greater than 0.6, and the Bartlett sphericity test, with a result less than 0.05, were required for validation. All data were analyzed using SPSS 22.0.
Results and Discussion
Kolmogorov–Smirnov Test of Data
The Kolmogorov-Smirnov (K-S) statistic was used to test the normal distribution of data. Only V, Co, and Fe followed normal distributions, whereas the other heavy metals exhibited non-normal distributions, with their normal distribution fitting curves shown in Supplementary Fig. S1. The comparisons were also done using arithmetic means.
Physicochemical Characteristics
Table 1 presents the water quality parameter values (pH, DO, EC, ORP, and turbidity) for all collected water samples. The pH of the lake water ranges from 7.30 to 8.40, indicating low alkalinity. The mean value of dissolved oxygen is 5.32 mg/L, with a range of 3.12 to 8.02 mg/L. The conductivity ranges from 253.00 to 727.00 μs/cm, with a mean value of 417.27 μs/cm. The redox potential ranges from 36.00 to 88.00 mV, with a mean value of 66.97 mV. The turbidity ranges from 8 to 122, with a mean value of 40.64. Overall, there are significant differences in the pH, DO, EC, ORP, and turbidity in Chaohu Lake and the entrance of the river to the lake.
Concentrations of Heavy Metals in Water
Table 1 lists the average concentrations of 12 heavy metals from Chaohu Lake, ranked in the following order: Zn > Fe > Mn > As > V > Cu > Ni > Cr > Pb > Co > Hg > Cd. Zn, Fe, Mn, As, V, Cu, Ni, Cr, and Pb have higher concentrations compared to the other elements, with average values of 751.62 μg/L, 327.37 μg/L, 250.54 μg/L, 70.02 μg/L, 5.45 μg/L, 3.22 μg/L, 2.87 μg/L, 2.76 μg/L, 1.47 μg/L, and 1.26 μg/L, respectively. Furthermore, the mean concentrations of all other heavy metals are below 1 μg/L, including Cr (0.45 μg/L), Co (0.39 μg/L), Hg (0.29 μg/L), and Cd (0.13 μg/L). The average concentrations of heavy metals measured in Chaohu Lake are lower than the limits set by the two standards for drinking water and surface water, except for iron (Fe).
Based on comparisons with previous studies on Chaohu Lake [9, 10, 12], Table S3 shows that the concentrations of Mn, Cu, and Zn in this study are higher than those reported in earlier research, and the concentration of Fe exceeds that reported by He et al. The concentrations of Ni, As, Cd, and Pb are at moderate levels, whereas Cr concentrations are relatively low, below those reported in the three studies. Additionally, the concentration of Hg is lower than that reported by Li et al.
Table 1.
Concentrations of dissolved heavy metals (μg/L), pH, DO (mg/L) EC (μs/cm), ORP (mV), turbidity (NTU) in Chaohu Lake.
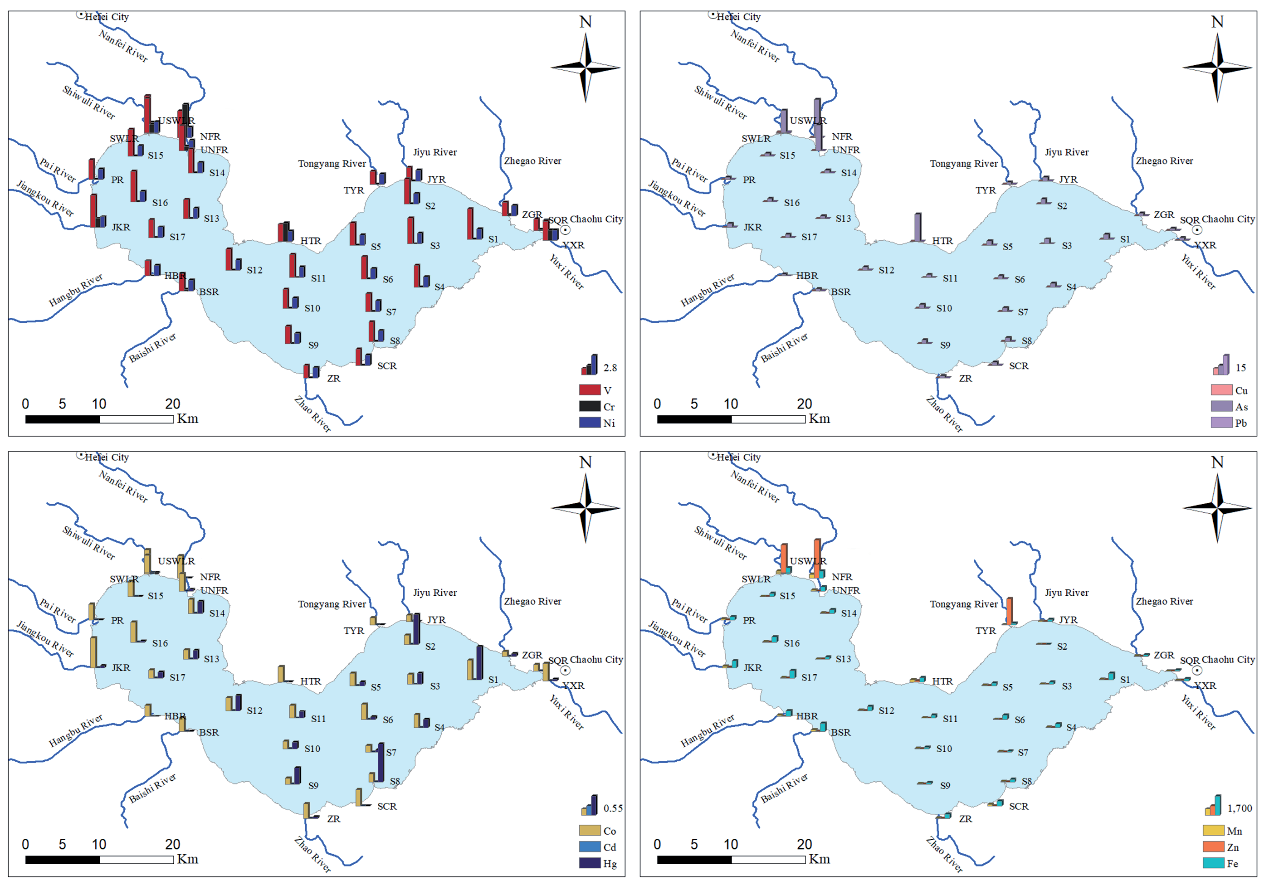
Table S2 presents the surface water classification standards (GB3838-2002). The average concentrations of heavy metals in Chaohu Lake were compared to the specified concentrations at all levels, revealing that the concentrations of Cr, Cu, As, Cd, Pb, and Hg met the standard for Class I. This indicates that the overall water quality is good. However, extremes or outliers were observed at certain sites, including HTR, SCR, HBR, JKR, SWLR, USWLR, and TYR. The concentrations of Zn in TYR, USWLR, and NFR, at river entrances to Chaohu Lake, were significantly higher than at other points and exceeded the limits for Class V surface water concentration. For As, the concentrations in HTR, SWLR, USWLR, NFR, and UNFR were abnormal. Fe exceeded the drinking water limits at HTR, SCR, ZR, BSR, HBR, JKR, SWLR, USWLR, UNFR, NFR, S1, S4, S6, S12, S14, S16, and S17. These sites may have been contaminated by anthropogenic inputs, which should be highlighted.
Spatial Distribution of Heavy Metals
Spatial Distribution of Heavy Metals at the Entrance of the River to Chaohu Lake
Fig. 2 illustrates the distribution of heavy metal concentrations at various river entrances to Chaohu Lake. Based on their distribution characteristics, five major patterns can be summarized: (1) concentrations of Cr, Mn, Cu, As, and Zn at the NFR were higher than those at other river entrances to Chaohu Lake; (2) concentrations of V and Ni in the SWLR were higher than those at other sites; (3) concentrations of Hg in the YXR were higher than those at other sites; (4) levels of Cd in the HTR water body were higher than those at other sites, and (5) concentrations of Fe in the BSR were higher than those at other sites. It is also notable that the majority of heavy metals in the NFR and UNFR show significant differences, with heavy metal concentrations in the NFR sector (near urban areas with concentrated transportation and residential zones) being significantly higher than those in the UNFR.
Spatial Distribution of Heavy Metals in Chaohu Lake
Fig. 2 illustrates the spatial distribution of heavy metals in Chaohu Lake. Based on the spatial distribution characteristics of the detected heavy metals, the concentrations of V, Mn, Co, Zn, As, Pb, and Fe exhibit similar distribution patterns. In contrast, Ni and Hg display significantly different characteristics from the other heavy metals. The lake's sampling sites are divided into three zones: the eastern, central, and western zones of Chaohu. According to the average sum of heavy metal concentrations at each site in these regions, the descending order is Western > Eastern > Central. This aligns with previous research [24].
Statistical Analysis
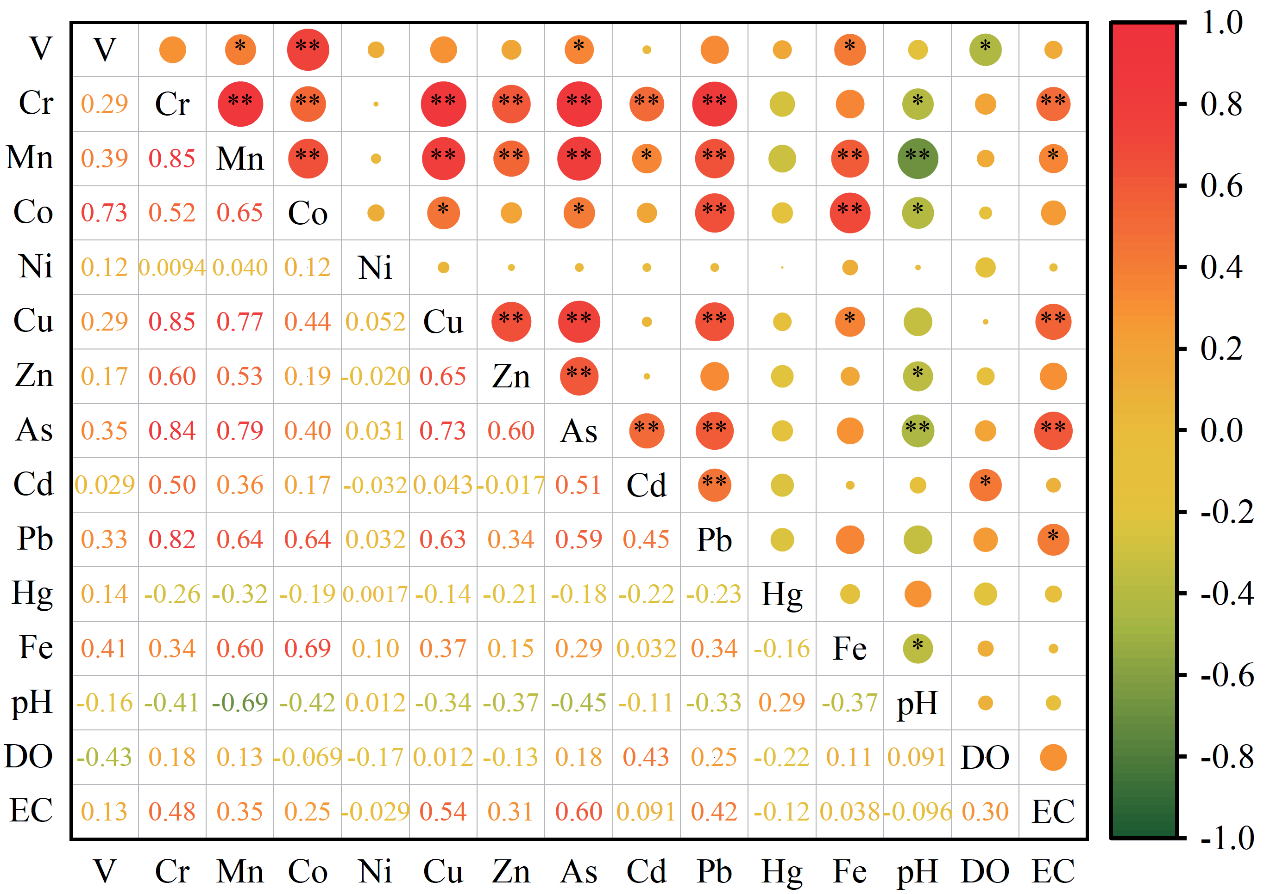
The Pearson correlation matrix was used to analyze the relationships between 12 heavy metals and to determine the potential sources of heavy metals in Chaohu Lake [25]. The results are presented in Fig. 3, which shows a positive correlation between Mn, Co, and Fe; a positive correlation between nine heavy metals (V, Cr, Mn, Co, Cu, As, Pb, Hg, Fe) and Ni; and a negative correlation between Zn, Cd, and Ni.
The factor analysis could more accurately identify heavy metal sources [26]. Several tests were required before performing the analysis. The Kaiser-Meyer-Olkin (KMO) value was 0.643, and the Bartlett sphericity test results were less than 0.01. Based on these results, principal component analysis (PCA) was deemed appropriate. Table S4 presents the results, and the five factors explained approximately 86.421% of the total variance.
Controlling Factors for Dissolved Heavy Metals
In this study, Pearson correlation analysis was used to investigate the relationship and interaction between 12 dissolved heavy metals and physicochemical properties in Chaohu Lake. The variation of the dissolved heavy metal content in water was influenced by pH, an important physicochemical parameter. At low pH, metal compounds in sediments may dissolve and release free metal ions [27]. However, only Hg showed a positive correlation with pH in this study; this was highly similar to the past finding [14]. In contrast, V, Cr, Mn, Co, Ni, Cu, Zn, As, Cd, Pb, and Fe showed a negative correlation (Fig. 3), however, some correlation coefficient is not significant. Therefore, pH might not be the primary control factor of dissolved heavy metals. EC can be used to measure the total concentration of dissolved heavy metals in water and to reflect biogeochemical conditions [28]. EC in water may correlate with an increased concentration of dissolved heavy metals [27]. According to Fig. 3, EC has a positive correlation with V, Co, Cd, and Fe, a significant positive correlation with Mn and Pb, and a highly significant positive correlation with Cr, Cu, and As. The results indicate that EC plays an essential role in the content of dissolved heavy metals in Chaohu Lake. From Fig. 3, it can also be seen that Cr has a strong positive correlation with Co, Cu, Zn, As and Pb, and Mn exhibits a similar pattern to Cr. Fe shows a strong positive correlation with Mn and Co, suggesting that they may share the same source.
Potential Source Identification
Heavy metal sources were diverse. Factor analysis (FA) was used in this study to better identify the sources of heavy metals. According to the FA results, the sources of heavy metals in Chaohu Lake might be divided into four categories.
Table S4 shows that Cr, Mn, Cu, Zn, and As have higher loading values in Factor 1. Wu et al. (2019) observed higher concentrations of Cu and Zn in rivers with significant anthropogenic impacts; the maximum concentrations of Cu and Zn were found at river entrance sites, consistent with this study’s findings. Based on the economic development surrounding Chaohu Lake, Cu and Zn are determined to be primarily influenced by industrial activities [29]. Concentrations of Mn and As were high at certain sites, including HTR, SWLR, and NFR, where industrial wastewater may contribute to the elevated levels.
V, Co, and Fe were the primary components of Factor 2. V and Co originated primarily from soil formation and rock weathering, while Fe is a central heavy metal element in the Earth's crust [30, 31]. However, higher concentrations of Fe at SWLR, NFR, S16, and S17 indicate the impact of industrial activities. As a result, the heavy metals in Factor 2 are primarily attributed to natural geologic sources, although industrial activities have influenced Fe concentrations at some sites.
Table S4 shows the factor loadings of Factor 3, which are primarily Cd and Pb. When the concentrations of Cd and Pb were compared to the surface water classification standards in GB3838-2002, they met the requirements for Class I water, which is attributed to natural sources.
Hg had the highest factor loading in Factor 4. The discharge activities from nearby coal-fired power plants and cement factories are most likely responsible for the high Hg concentrations at the sampling sites within the internal water bodies of Chaohu Lake [9].
Spatial Distribution of Heavy Metal Pollution Index (HPI)
The HPI value reflected the concentration of heavy metals and the water quality [32]. It was used to determine heavy metal pollution levels in Chaohu Lake. Fig. 4 shows that the HPI values for the sampling sites range from 2.74 to 49.42. Three moderately polluted points are SWLR, USWLR, and S4, with HPI values of 21.88, 27.21, and 18.54, respectively. Three heavily polluted points are HTR, NFR, and UNFR, with HPI values of 39.93, 49.42, and 33.64, respectively. The HPI values of the remaining 27 points are less than 15, indicating that these points are in a state of mild pollution. The overall contamination degree of heavy metals at the river entrances to the lake, in descending order, was NFR > HTR > UNFR > USWLR > SWLR > YXR > JKR > SCR > BSR > ZGR > SQR > JYR > HBR > ZR > PR > TYR. The overall degree of heavy metal contamination within the lake, in descending order, was S4 > S1 > S2 > S8 > S3 > S14 > S5 > S12 > S16 > S9 > S6 > S17 > S10 > S11 > S13 > S15 > S7.
Fig. 4.
Changes in HPI at different sampling sites in Chaohu Lake (A) and the ratio of HPI for different heavy metals (B).
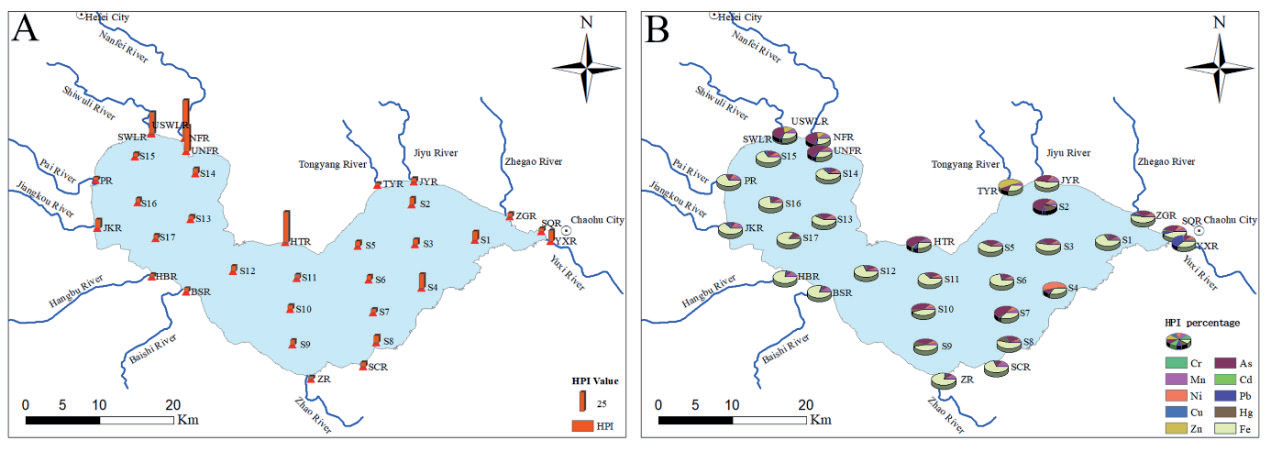
Table 2.
The average carcinogenic risks of Cr and Ni for children and adults across all sites.
| Heavy metals | Risks | |||||
|---|---|---|---|---|---|---|
| CRingestion | CRdermal | Cancer index (CI) | ||||
| Adults | Children | Adults | Children | Adults | Children | |
| Cr | 2.02E-05 | 3.01E-05 | 4.20E-06 | 1.24E-05 | 2.44E-05 | 4.25E-05 |
| Ni | 1.29E-04 | 1.92E-04 | 3.35E-06 | 9.90E-06 | 1.32E-04 | 2.02E-04 |
It is worth noting that Fe, Mn, and As contributed the majority of the HPI values, while Zn also contributed significantly at certain sites. The HPI value at the NFR sample point was the highest in this study. NFR is an important river that runs through the urban area of Hefei, and its high level of heavy metal contamination can be attributed to industrial, agricultural, transportation, and human activities [9].
Human Health Risk Assessment
The Carcinogenic Risks
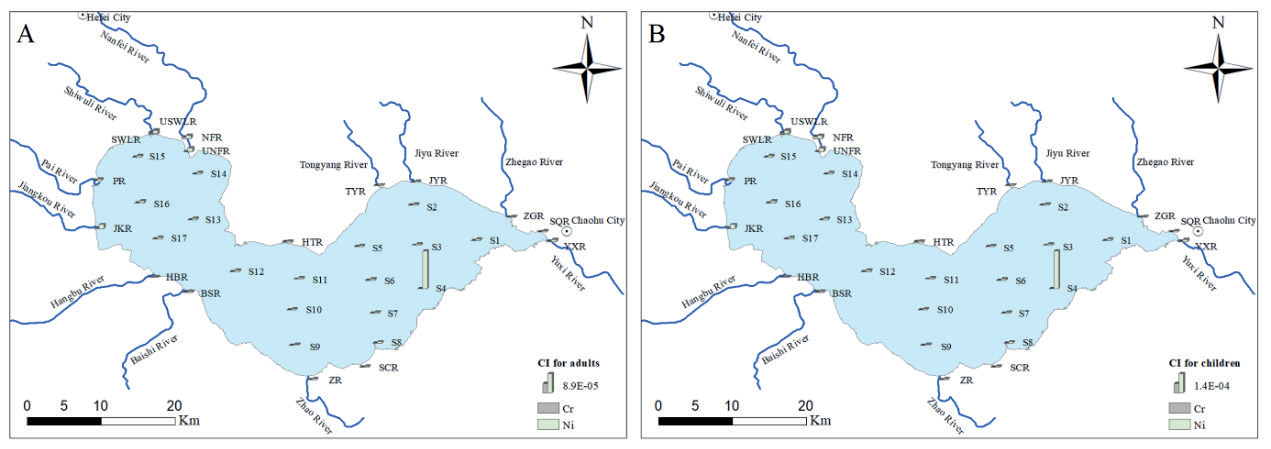
The carcinogenic risks for adults and children from ingestion and dermal exposure were calculated for Cr and Ni, with the results presented in Table 2, Table S5, and Fig. 5. Ingestion posed a higher carcinogenic risk than dermal exposure. Furthermore, for both ingestion and dermal exposure, the risk from Ni was higher, followed by Cr. Considering the cancer index, the mean values for Ni exceeded the recommended range of 1×10⁻6 to 1×10⁻4 for children and adults, as specified by USEPA (1984, 2004). The carcinogenic risk of Cr was within acceptable levels for adults (2.44E-05) and children (4.25E-05).
Table 3.
Non-carcinogenic risk results (average).
Fig. 6.
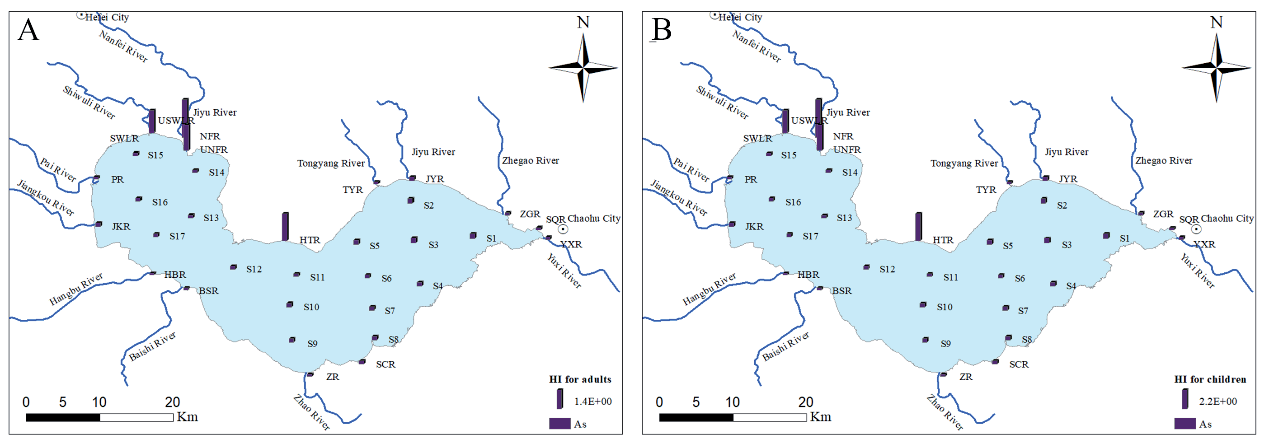
Spatial distribution of non-carcinogenic risks in Chaohu Lake (A for adults, B for children).
The order of magnitude of the CI values for Cr at the entrance of the river to Chaohu Lake was NFR>HTR> SWLR>YXR>JKR>USWLR>UNFR>SQR>BSR>ZGR. The site of high carcinogenic risk for Cr was located at the entrance of the NFR, where the risk level was above 10⁻4 for children. The order of magnitude of CI values for Ni in descending order was SWLR > JKR > UNFR > NFR > USWLR > YXR > PR > HTR > SQR > SCR > BSR > JYR > ZR > HBR > TYR > ZGR, while the order of magnitude of CI values for Ni in Chaohu Lake in descending order was S4 > S16 > S15 > S14 > S1 > S11 > S6 > S12 > S13 > S17 > S5 > S2 > S3 > S8 > S10 > S7 > S9. 21.21% of sites for adults exceeded the target risk (10⁻4) and 54.55% of sites for children exceeded the target risk (10⁻4).
Based on these findings, we should be more concerned about the carcinogenic potential of Ni in Chaohu Lake. Therefore, it was necessary to strengthen the observation of Cr and Ni, and take measures to reduce the risks.
Non-Carcinogenic Risks
The non-carcinogenic risks to adults and children from ingestion and dermal exposure were calculated for the 12 heavy metal elements and the results are shown in Table 3. The mean HQingestion, HQdermal, and HI values for all heavy metals for adults and children are below the thresholds. The results revealed that the 11 heavy metals found in Chaohu Lake had little negative impact. Furthermore, children had higher HQingestion and HQdermal values than adults. Table 3 shows that the average HI value of As is higher than those of other heavy metals.
The HI values for As were shown in Table S7 and Fig. 6. The order of magnitude of the HI values for As at the river entrances to Chaohu Lake was NFR > HTR > UNFR > USWLR > SWLR > JKR > JYR > SCR > YXR > ZGR > SQR > TYR > PR > ZR > BSR > HBR, while the order of magnitude of the HI values for As in Chaohu Lake was S1 > S2 > S3 > S5 > S4 > S10 > S9 > S7 > S8 > S6 > S16 > S12 > S11 > S17 > S15 > S13 > S14. The HI values for As in adults and children are the highest among all heavy metals, and the HI values at the HTR, SWLR, USWLR, NFR, and UNFR sites exceed the threshold value of 1. As a result, As poses a high non-carcinogenic risk.
Conclusions
This study investigated the concentrations of V, Cr, Mn, Ni, Cu, Co, Zn, As, Cd, Pb, Hg, and Fe in the water bodies at 33 sites, including the river entrances to Chaohu Lake and Chaohu Lake itself. The results are as follows:
(1) Hg at S8 and Zn at TYR, USWLR, and NFR exceeded the Class V surface water concentration levels. Ni at S4 and Mn at HTR, SCR, HBR, JKR, SWLR, USWLR, NFR, and UNFR exceeded the drinking water quality standards. The average concentration of Fe in Chaohu Lake also exceeded the drinking water standards.
(2) The CA and FA results showed that V, Co, Ni, Cd, and Pb originated from natural sources, Cr, Mn, Cu, Zn, As, and Hg were from anthropogenic sources, and Fe was influenced by both anthropogenic and natural factors.
(3) The heavy metal pollution index results revealed that Fe, Mn, and As contributed the majority of the HPI values, while Zn contributed significantly to the HPI values at some sites.
(4) The results of the carcinogenic risk of heavy metals were as follows: the high carcinogenic risk area for Cr was NFR, while the high carcinogenic risk areas for Ni were SWLR, JKR, and S4. HTR, SWLR, USWLR, NFR, and UNFR posed high non-carcinogenic risks for As.

