

Introduction
Habitat quality (HQ) is an important supporting ecosystem service that refers to the ability of an ecosystem to provide sustainable living conditions for organisms within a certain time and space, comprehensively reflecting the status of regional biodiversity. Unlike provisioning and regulating ecosystem services that can directly provide materials and benefits to human beings, HQ is a conceptual indicator for maintaining ecosystem service input, and is also a prerequisite and basis for all ecosystem functions and services [1]. It can meanwhile characterize the provisioning level of ecosystem services and the health status of ecosystems. Currently, the global HQ has been degraded due to climate warming, increasing urbanization, high-intensity agricultural activities, and internal trade-offs between ecosystem services and socio-economic development [2], and most ecosystem services are already being reduced or even disappearing [3]. Therefore, a clear understanding of HQ dynamics is required in order to design better policies to address ecological issues on regional ecosystem restoration and ecosystem service sustainability.
Early research on HQ assessment mainly used field surveys to assess ecosystem health status by a series of indicator systems [4, 5]. Although this method has high accuracy, it is only applicable to small-scale surveys such as sample points or sample strips, which makes it difficult to achieve HQ assessment at large watershed and region scales, thus resulting in poor knowledge and understanding of HQ status and change. With the advancement of satellite technology, ecological models based on remote sensing products, such as remote sensing ecological index [6], Maxent model, and Integrated Valuation of Ecosystem Services and Trade-offs (InVEST) model [7], have been widely applied to HQ assessment, and these models provides effective tools to efficiently and accurately reveal HQ levels at large regional scales. Among the remote sensing-based methods, the InVEST model is an important tool for effectively quantifying HQ level, considering both land suitability and threat factors as the model input, and having the advantages such as easy access to data, few required parameters, precise analytical ability, and simple processing. The InVEST-based HQ assessment has been applied at multiple scales [8-10].
Land use/cover change is a main factor that can significantly change ecosystem structure, processes, and functions [11], and thus exerts a profound impact on ecosystem suitability. HQ is significantly correlated with the spatial distribution of land use and climatic conditions [12]. Typical anthropogenic activities, such as urbanization expansion, land enclosure for lakes, deforestation, and conversion of forest to cropland, would significantly impact ecosystems’ HQ level [13, 14]; in return, the impacted ecosystems will feedback to humans through some extreme climate events (drought and flood). Human activities can directly alter HQ through land use, land pattern, and soil condition, in most cases resulting in the degradation of natural habitats and HQ, e.g., urbanization and agricultural reclamation activities [15]. Climate change would indirectly affect an ecosystem’s HQ through changing vegetation phenology and the water cycle process [16, 17]. Understanding the spatiotemporal variability of regional HQ and knowing how environmental factors impact HQ are critical for policy-making in ecological conservation and sustainable development of ecosystem services.
The Yellow River Basin (YRB) in China is responsible for 13% of the country’s grain production, 15% of the arable land area, and water supply for more than 50 large and medium-sized cities. The basin is an energy base for half of China’s coal and 70% of coal power, and is an important concentration of population, industry, and agriculture in China [18]. High HQ is necessary to maintain a sustainable supply of these ecological benefits. Previous studies [19-21] have analyzed the HQ in YRB from the perspectives of future prediction and landscape pattern, but those reflected the HQ changes only through few years to define HQ change in decades, e.g., using HQ change between 2 years (2000 and 2010) to represent the net HQ change during 2000-2010, which introduced great uncertainty into the estimated change of HQ. Therefore, fine temporal-scale, year-by-year changes in HQ are still not well understood. Under the combined effects of climate warming, rapid urbanization, and anthropogenic reforestation, year-by-year HQ change in the YRB needs to be understood very clearly to provide useful management information for the “Ecological Conservation and High-quality Development in the YRB” target. The main objectives of this study are to (1) analyze in detail the spatial and temporal variability of HQ in the YRB; (2) identify unique management areas for more effective ecological management, and (3) explore the impact of future land management on HQ in the YRB.
Materials and Methods
Study Area
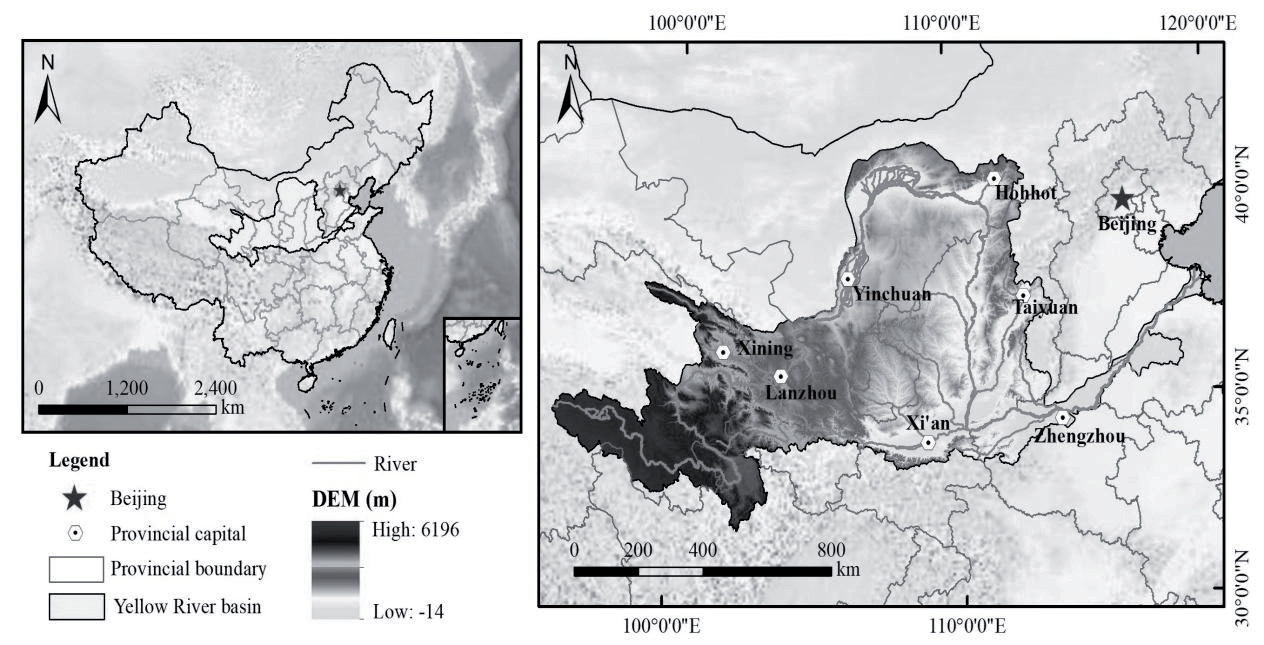
The YRB (32°-42°N, 96°-119°E, Fig. 1) is the second longest river in China (5464 km), located in the arid and semi-arid region of northern China, passing through nine provinces of Qinghai, Sichuan, Gansu, Ningxia, Inner Mongolia, Shaanxi, Shanxi, Henan and Shandong Province, controlling a basin area of about 795,000 km2 (including the area of 42,000 km2 of endorheic area). The upper, middle, and lower reaches cover an area of about 417,000, 355,000, and 23,000 km2, respectively. The basin altitude is generally distributed in the west high and east low, spanning four geomorphological units: Qinghai-Tibet Plateau, Loop Plain, Loess Plateau, and Yellow Huaihai Plain. The YRB has an arid, semi-arid, and semi-humid continental monsoon climate, with an annual precipitation distribution of 115-982 mm and an annual evapotranspiration of 141-1287 mm in the entire YRB [22]
Data Sources
Land cover data were from the reference [23] with a 30 m spatial resolution during 1990-2020 and 9 categories: cropland, forest, shrub, grassland, water, snow, barren land, impervious land, wetland; 1-km resolution elevation, precipitation, temperature, soil, population density and gross domestic product datasets were obtained from the Resource and Environment Science Data Center of Chinese Academy of Sciences (https://www.resdc.cn/); 1-km resolution Normalized Difference Vegetation Index (NDVI) product were derived from http://www.vgt.vito.be. We calculate the yearly NDVI maximum to represent NDVI in a year. The river data and boundary data of the Yellow River are from the Resource and Environment Science Data Center of the Chinese Academy of Sciences (https://www.resdc.cn/). The landscape pattern index is calculated using the moving window method of Fragstats 4.2 software, with a spatial resolution of 1 km.
Methods
Calculation of HQ
The InVEST model takes into account the habitat suitability of different land cover types and the influence of threat sources, which have their own maximum distance of influence and a decline process [24]. The calculation equation is as follows:
rxy,linear dr max
rxy,exponential dr max
Where Qxj is the HQ index of raster x in habitat type j; Hj is the habitat suitability of habitat type j; Dxj is the habitat degradation degree of raster x in habitat type j; k is the half-saturation constant, taken as half of the maximum value of Dxj; z is the normalization constant, usually taken as 2.5; R is the number of threat sources; Wr is the weight of danger sources; Yr is the number of rasters of threat sources; ry is the stress of raster y means; irxy is the coercive value of ry of raster y to the coercive level of raster x; Bx is the accessibility of the threat source to raster x; Sjr is the sensitivity of habitat type j to threat source r; dxy is the linear distance from raster x to raster y; drmax is the maximum coercive distance of threat source r. Table 1 and Table 2 list the parameters used in the model by referring to the study on the YRB [9] and by the empirical adjustment according to the characteristics of the study area.
Trend Analysis and Significance Test
The trend of HQ was calculated using by linear regression model. A positive slope value denotes recovery of HQ and a negative value indicates ecological degradation. The slope calculation is as follows:
Table 1.
Threats parameters.
| MAX_DIST | Weight | Threats | Decay type |
|---|---|---|---|
| 1 | 0.5 | Cropland | Linear |
| 5 | 0.8 | Imperious | Exponential |
| 1 | 0.2 | Barren land | Linear |
Table 2.
Parameters of habitat suitability.
Where θ is the linear trend of inter-annual HQ; n is the number of years in the study time period; yi is the HQ value in the i-th year.
The Mall-Kendall analysis was employed to test the significance of the linear trend. The method has been widely used in time series analysis. The equations are the following:
Where S is the Mall-Kendall test’s statistic; i and j denote the corresponding measurements in years i and j; n is the length of the data series. The thresholds of significance levels are selected as ±1.96 (95% significance test). When the value of Z ranges from 1.96 to 2.58, it indicates that the growth trend passes the 95% significance test.
Correlation Analysis
In this paper, we used the correlation coefficient to detect the correlation between HQ and other factors to determine the main factors affecting HQ, considering rainfall, NDVI, and altitude as driving factors of HQ. Correlation analysis is a widely used method to detect the correlation between variables, and its equation is as follows:
Where Rxy is the correlation coefficient of variable x and variable y with values ranging from -1 to 1; k is the total number of raster; xv, yv are the values of variable x and variable y in raster v, respectively. x̅ and y̅ are the raster average value of variable x and y, respectively; The correlation coefficients were finally tested by p-value.
GeoDetector Discerning Main Driving Factors
GeoDetector is a powerful spatial analysis tool with broad applicability that can handle not only numerical data but also qualitative data. It is unique in its ability to detect interactions between two or more factors, including non-linear relationships, thus revealing the mechanisms behind complex geographic phenomena. Compared to traditional statistical methods, GeoDetector does not require linear assumptions, is friendly to small sample sizes, and the output is intuitive and easy to interpret. Therefore, it has been widely used in many fields, such as ecology, environmental science, geography, economics, etc., providing new perspectives and methods for spatial analysis.
Where q is the explanatory ability of the influencing factor on the spatio-temporal variation of dependent variable, the value range is 0~1; as the value increases, the spatial variability of the dependent variable in the is more significant; L is the stratification of the dependent variable or the factor; Nh, and N are the number of cells in the layer h and the whole area, respectively, and σ2 and Nσ2 are the variance of the values of the de-pendent variable in the layer h and the whole area, respectively.
Identifying the Ecological Regions
HQ is an important indicator of habitat suitability according to different land types. However, relying solely on HQ for ecological management is not sufficient, as the complexity and diversity of ecosystems mean that multiple factors need to be considered to ensure ecological balance and sustainable development. When assessing the ecological condition of a region, we chose water resources, vegetation cover, and habitat suitability (HQ) as the core factors to construct a comprehensive scoring system.
First of all, water resource is the foundation of ecosystem health. It not only directly affects the survival and reproduction of living organisms, but also indirectly acts on the whole ecosystem by influencing processes such as soil quality, vegetation growth, and climate regulation. Lack of adequate water resources can lead to problems such as degradation of vegetation, reduction of biodiversity, and soil erosion, thus affecting habitat suitability. Therefore, when it comes to water management, we need to ensure adequate water quantity and clean water quality to support ecosystem health and stability.
Additionally, vegetation cover is one of the most important indicators of the ecological condition of a region. Vegetation not only provides a place for organisms to live and reproduce, but also produces oxygen and absorbs carbon dioxide through photosynthesis to maintain atmospheric balance. At the same time, vegetation can also reduce soil erosion, maintain soil fertility, and regulate the climate. Therefore, maintaining the integrity and diversity of vegetation cover is essential to maintaining ecosystem health. In ecological management, we need to take measures to protect and restore vegetation cover, such as planting trees, returning farmland to forests and grasslands.
Finally, habitat suitability (i.e., HQ) is a direct goal of ecological management. A high-quality habitat can provide a suitable living environment to meet the survival and reproduction needs of organisms, and the assessment of HQ is usually based on factors such as land type, topography, climate, etc., which are closely related to water resources and vegetation cover. Therefore, in ecological management, we need to consider these factors comprehensively and take measures to improve habitat suitability, such as improving water resource management, protecting and restoring vegetation cover.
Based on the above, we chose water resources, vegetation cover, and habitat suitability (HQ) as the core factors of ecological management and constructed a comprehensive scoring system based on them. Doing so helped to assess the ecological condition of a region more comprehensively and accurately, and provides a scientific basis for formulating effective ecological management strategies. The formula is as follows:
Where Scorei is the total score in raster i; ScoreP,i is the score of precipitation indicator in raster i; ScoreHQ,i is the score of HQ indicator in raster i; ScoreNDVI,i is the score of NDVI indicator in raster i. These scores were determined in Table 3.
We combined past land cover changes and existing land policies in the HQ to set up three scenarios to reveal the effects of different land management scenarios on the HQ. The scenarios were created by reclassification tools in ArcMap software. We used the land cover in 2020 as the base scenario, through which we created the following scenarios.
Effects of Different Land Management on HQ
In order to reveal the impact of different land management policies on HQ, we have established the following three scenarios based on the past land changes and current land policies of YRB. These scenarios are not limited to a future year, and it is only intended to estimate how much different land management policies affect habitat quality. It should be noted that these scenarios represent a kind of idealized assumption, which may be difficult to achieve completely in reality but would provide conceptual information to policy-makers. The establishment of scenarios is by means of ArcMap software, changing the land type attribute of one raster into another attribute according to the rules of different management scenarios as follows:
(1) Ecological security scenario. Converting farmland to forest on steep slopes is a primary means of ecological restoration in YRB, and it will be further implemented in the future. Here, we changed cropland grids with a slope of >15° into forest grids, which is the most effective measure to maintain ecological security
(2) Water security scenario, Water quality and quantity are the main components of water security. The arid climate and agricultural non-point source pollution contributed to the water crisis in YRB. Forest buffer zones around the rivers have positive effects in purifying water quality and conserving the water source. Hence, grids 1 km away from rivers were identified as a buffer zone, where eligible grids were all converted into a forest grid.
Table 3.
Scores of different indicators.
| Precipitation | Habitat quality | NDVI | Score |
|---|---|---|---|
| 100-300 | 0.0-0.2 | 0.0-0.2 | 1 |
| 300-500 | 0.2-0.4 | 0.2-0.4 | 2 |
| 500-700 | 0.4-0.6 | 0.4-0.6 | 3 |
| 700-900 | 0.6-0.8 | 0.6-0.8 | 4 |
| 900-1100 | 0.8-1.0 | 0.8-1.0 | 5 |
(3) Food security scenario. With the increasing population, future food and cropland requirements in the Yellow River Basin (YRB) are expected to rise significantly. In this scenario, we identified and converted barren land grids with slopes of less than 6° into cropland to ensure increased grain output for food security. The barren land data were self-extracted by reclassifying and processing land cover data. The identification and extraction were conducted using ArcMap tools based on land suitability criteria.
Results
Spatio-Temporal Changes of HQ
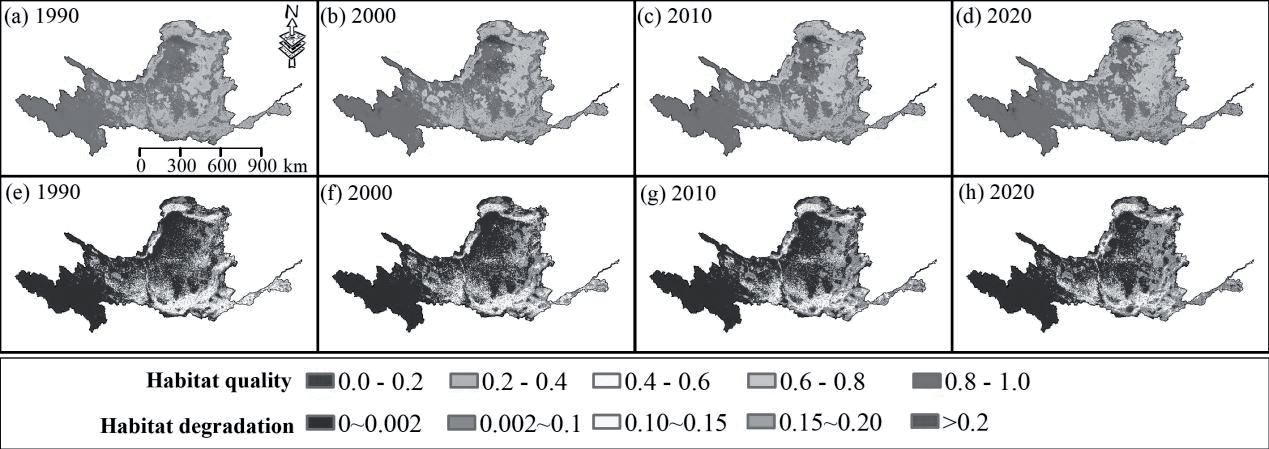
Fig. 2 shows the distribution of HQ and habitat degradation in 1990, 2000, 2010, and 2020. Areas with high HQ values are mainly in the upstream headwater of the YRB, followed by the central upper part. Areas with low HQ values are mainly distributed in the agricultural and residential areas along the Yellow River. The substantial cropland and impervious surface here provide a large number of ecological threatening sources, leading to a low HQ. HQ is low throughout the lower Yellow River, where the flat topography contributes to extensive cultivated land. Areas with the lowest HQ are mainly in the northern part of the YRB, where the desert zone is very extensive due to the arid climate, resulting in very low biodiversity and HQ. In the distribution of HQ in 2020, it can be seen that the areas of low HQ in the northern part of the Yellow River have decreased compared to 1990. The expansion areas of low HQ are mainly in the middle and lower reaches, due to the rapid urbanization encroaching on natural land. The areas with low habitat degradation are mainly in the upstream headwater, where the high elevation made human activities hard to reach and therefore produced low habitat degradation. Areas with moderate habitat degradation are mainly found in cultivated areas over the whole YRB, as cultivated areas are the main sources of threats, accompanied by high levels of human activity that could affect habitat quality in adjacent areas. Areas with high habitat degradation are mainly distributed in the human-inhabited construction land region, and this kind of areas expands rapidly after 2000, spreading over the whole downstream area in 2020, which indicated the negative impacts of urbanization and cropland on habitat quality.
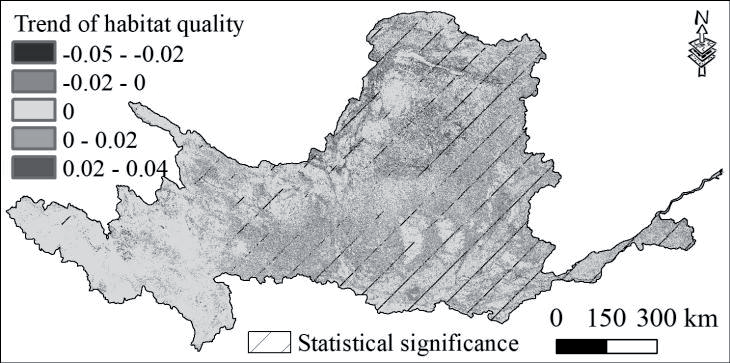
Fig. 3 exhibited the spatial and temporal changes of HQ. The HQ started a large-scale practice of changing farmland to forest after 2000, resulting in a large amount of cropland and barren land being converted into forest land, which not only reduced the ecological threat source but also increased the natural habitat regions. This is also the main driver of land cover change in the YRB and an important factor in the increase of HQ, mainly in the middle YRB, the focus area of reforestation. Because the 400 mm iso-precipitation line crosses the middle reaches of the YRB, this is the minimum precipitation requirement for planting tree survival. In addition, the area where HQ is decreasing year by year is also widely distributed in the whole YRB, mainly in the urban areas in the northern YRB and middle and lower reaches of the YRB, which indicates the very strong impact of urbanization on regional HQ. Trends of HQ were almost unchanged in about 60% of the entire YRB, along with 20% and 20% of the areas showing decreasing and increasing trends, respectively. The HQ of the entire YRB is increasing at a rate of 0.076 per year, indicating that the HQ of the YRB is becoming better, under the combined influence of external drivers. The ecological recovery of the YRB is considered to be a result of positive human interventions.
Main Influencing Factors of HQ
Fig. 4 presents the results of the one-factor detection and interaction detection of the factors influencing HQ in YRB in 2020. In terms of one-factor detection, the strong explanatory power (high q-value) factors included land use intensity (q=0.70), elevation (q=0.65), rainfall and slope (q=0.55), vegetation index (q=0.42) showed a moderate explanatory power (q>0.45), while temperature, landscape index and population density seemed to show a low explanatory power (q<0.3). It is implied that topography and land type were strong influences, while climate, socio-economic, and landscape pattern were secondary explanatory factors. The results of the interaction test showed that the explanatory power of the two-factor was stronger than that of the one-factor, especially the joint explanatory power of Slope∩DEM (q=0.92) and LUI∩DEM (q = 0.90) exceeded that of the DEM alone. Both LUI and DEM, in combination with other factors, exceeded their explanatory strength alone. These results emphasized the nonlinearity and complexity of HQ’s influencing factors.
Responses of HQ to Precipitation, NDVI, Elevation, and Land Cover Types
We specifically selected the drivers with strong explanatory power, aiming to explore relationships between HQ and these factors. Table 4 shows the correlation between HQ and precipitation, NDVI, and elevation. HQ has a very low correlation with precipitation, followed by NDVI, but has a relatively high correlation with elevation. Since NDVI is an annual maximum, the NDVI values of cropland tend to be very high during the full growth period of the crop. The high NDVI and low HQ of cropland lead to a low correlation between them. High elevation areas generally have low impacts from human activities, and therefore, a high correlation exists between elevation and HQ. In addition, NDVI and precipitation showed a significant correlation. This is because precipitation in humid areas is more suitable for vegetation growth.
Fig. 5 depicts the mean values of HQ at different levels of precipitation, elevation, NDVI, and land cover types, respectively. HQ was highest in areas with NDVI above 0.8 (vegetated areas). HQ was lower on average in areas with NDVI of 0.4-0.6 than in areas with NDVI of 0.6-0.8, probably because the NDVI values of cultivated land were mainly distributed in the range of 0.6-0.8. The increase in cultivated land would increase the number of ecological threat sources and reduce the HQ. The HQ is lowest in areas where precipitation is 0-200 mm, because areas with a dry climate are almost always desert. In humid areas with abundant precipitation, HQ does not vary much between different precipitation areas. The HQ is very low in areas with elevations less than 1000 m and higher than 5000 m. Low-elevation areas are distributed with extensive agricultural land, resulting in low HQ, and high-elevation areas above 5000 m are covered with snow throughout the year, which is not suitable for vegetation growth and animal survival, also resulting in low HQ. With increasing elevation, HQ also gradually increases, reflecting that HQ receives the influence of the topographic distribution. Among all land cover types, snow, barren land, and impervious surface showed the lowest HQ, and these land cover types have almost no habitat suitability. The HQ of cropland is also low, about 0.3, which is much lower than that of other vegetated land types.
Fig. 4.
Explanatory power detection of HQ’s main influencing factors in 2020 (PI is the population density of the study area in 2020; GDP is the annual gross domestic product in 2020; DEM is the elevation; SE is the soil erosivity level; NDVI is the normalized difference vegetation index; PRE is the yearly precipitation in 2020; TEP is the yearly average temperature in 2020; LUI is the land use intensity in 2020; SOC is the soil organic carbon; SHEI is the shannon uniformity index; LF is the landscape fragmentation).
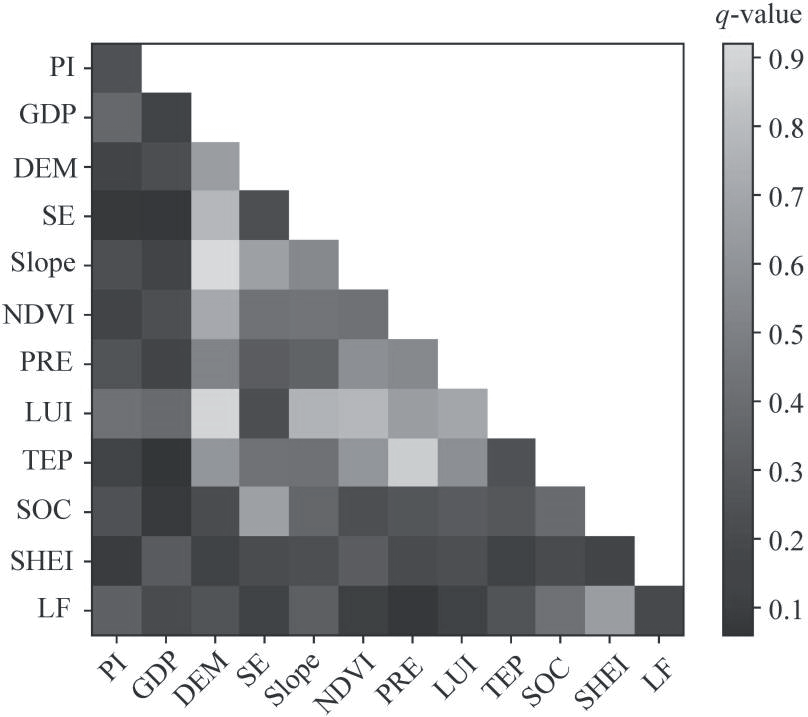
Table 4.
Correlation between habitat quality and several factors.
| Correlation | Habitat quality | Precipitation | NDVI | Elevation |
|---|---|---|---|---|
| Habitat quality | 1 | 0.075 | 0.163 | 0.350* |
| Precipitation | — | 1 | 0.696** | 0.053 |
| NDVI | — | — | 1 | 0.125 |
| Elevation | — | — | — | 1 |
The main land cover types over YRB were grassland and cropland (Table 5). Cropland has been decreasing in recent 30 years, reaching 23,106 km2 of reduction from 1990 to 2020 and being almost transformed from grassland (30,945 km2). The grassland area significantly expanded from 1990 to 2010 but began to decrease after 2010, resulting in a net increase of 7,589 km2 over the entire period. The areas of cropland converted to grassland and barren land converted to grassland were approximately 41,474 km2 and 18,837 km2, respectively. Forest increased by 17,108 km2 in the last 30 years, and in 2010-2020 it increased by 7,513 km2. Cropland (4,777 km2) and grassland (13,902 km2) contributed mostly to the increase in forest area. Impervious area increased from 8,797 km2 in 1990 to 22,071 km2 in 2020, a rapid urbanization rate of 151% attributed to the reduction of cropland (10,778 km2). Barren land showed a reduced trend, shrinking by 4,665 km2 in the entire period, and 18,837km2 of barren land was changed into grassland. Overall, in the last 30 years, the land change in YRB was featured by main increases in forest and impervious land, and obvious decreases in cropland and barren land.
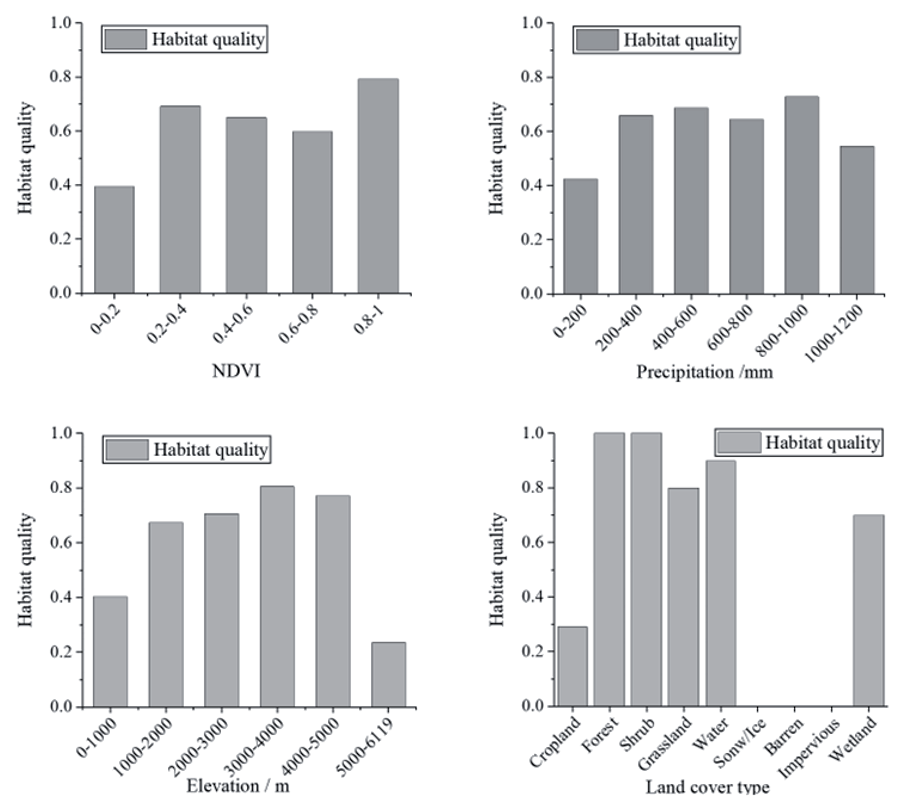
Table 5.
Land cover conversion during 1990-2020 in the Yellow River Basin.
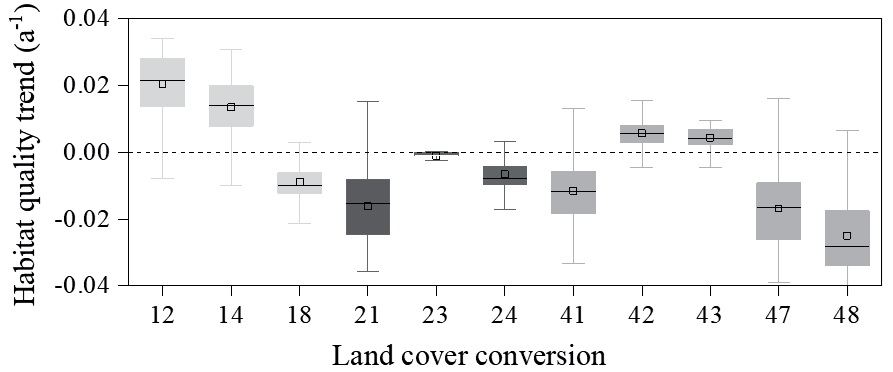
We selected several groups of land transfer types with large changed areas and counted the trends of HQ in these changed areas (Fig. 6). We found that in areas where cropland was converted to forest and grassland, HQ consistently improved, accompanied by an increasing trend of approximately +0.02/a, while this trend shifted to negative values with cropland converted into impervious surfaces, suggesting a positive effect of revegetation on HQ and a negative effect of urbanization on HQ, respectively. In areas where forests were converted to cropland and grassland, there was a significant decreasing trend in HQ. Grassland is the land cover type with the largest changed area in the YRB in the last 30 years. When grassland was converted to cropland, barren land, and construction land, HQ exhibited a consistent decreasing trend, and the land conversion of grassland to impervious surface had the greatest negative effect on HQ, approximately -0.03/a. As grassland was converted into forest and shrub, HQ was increased, but not significantly. These results imply a significant effect of urbanization and afforestation on HQ.
Fig. 6.
Habitat quality trends during 1990-2020 in each land conversion from 1990 to 2020. (In the lateral axis, numbers 1, 2, 3, 4, 7, and 8 denote cropland, forest, shrub, grassland, barren land, and impervious land, respectively. For example, the number 12 denotes the conversion of cropland to forest, and the number 21 represents the conversion of forest to cropland).
Ecological Importance Determined by Ecological Scores
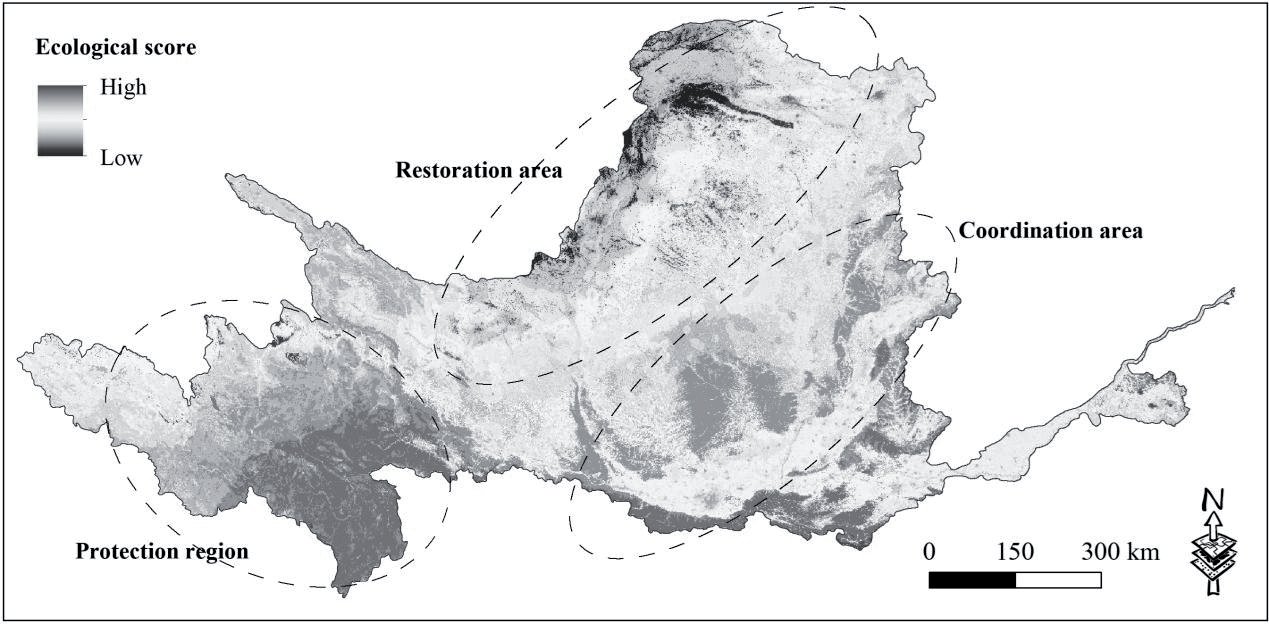
Based on the ecological score indicators constructed from precipitation, NDVI, and HQ, and taking into account the actual situation of YRB, we divided the whole YRB into three functional areas, i.e., ecological restoration areas, ecological protection areas, and ecological synergy areas (Fig. 7). The ecological score of the ecological protection area is very high in the headwater region of the upper Yellow River, which is rich in water resources due to snow and ice melt and abundant precipitation; however, it is very sensitive to climate change and human interference. The ecology of the ecological protection area is prone to degradation if affected by human activities, which in turn negatively affects the benefits and welfare in the middle and lower reaches of the Yellow River. Therefore it is identified as an ecological protection area where human intervention should be strictly prohibited. The ecological restoration area is the area with the lowest ecological score in the northwestern part of the YRB, the latter section of the upper reaches. Low precipitation, extensive desert zones, and low vegetation coverage resulted in a low habitat score, and it is identified as an ecological restoration area. More positive anthropogenic interventions should be injected into the ecological restoration of the ecological protection area to secure the fundamental supply of ecosystem services. The ecological score of the ecological synergy area is relatively high in the middle of the YRB. Synergy implies that more coordination and adjustment are taken into account in the various ecological management sectors. Because vegetation has been significantly enhanced in the ecological synergy area, reducing trade-offs between ecosystem services and increasing synergies to maximize the ecosystem services provisioning are the main tasks in the ecological synergy area.
HQ Changes in Different Land Management Targets
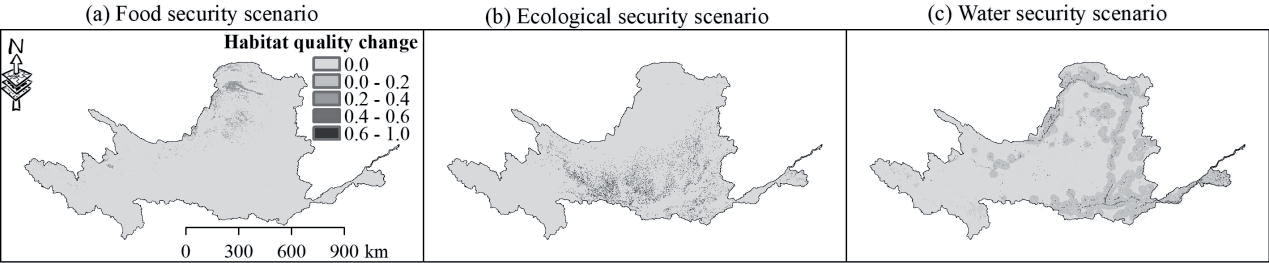
The changes of HQ under the different land management targets compared with 2020 are shown in Fig. 8 and Table 6. Under the food security development target, the HQ of the YRB is moderately improved at an increase of 1.2% relative to 2020, mainly in the northern part of the YRB, where a large amount of barren land is developed into cropland and therefore shows a potential for HQ improvement. In addition, food production is increased due to the expansion of cropland, thus creating a synergistic effect between HQ and food supply services. It is worth emphasizing that the food security scenario is also not easy to realize in reality. In the ecological security scenario, the HQ of the YRB is significantly improved with a total of 3.9% increase, primarily in the midstream. The midstream region still has more steeply sloping croplands, and when these croplands are planted with trees, the average increase in HQ can exceed 0.6. This could produce a synergistic effect between HQ and soil conservation due to the expansion of forest lands. In the water security scenario, the HQ was also increased moderately in a wide range of areas along the Yellow River channel. This potentially increases water purification capacity and water holding capacity due to the planting of trees around rivers and lakes, creating synergistic effects between HQ and multiple ecosystem services. Taken together, the ecological security scenario increases HQ to the greatest extent but is accompanied by a smaller extent, and the water security scenario increases HQ to the greatest extent but to a lower average extent.
Discussion
This study applied the InVEST model to conduct a year-by-year quantitative assessment of habitat quality (HQ) dynamics in the Yellow River Basin (YRB) from 1990 to 2020, analyzing spatiotemporal changes, key influencing factors, and the impacts of different land management scenarios. The innovation of this study lies in its high-resolution annual HQ assessment, which reduces uncertainties compared to traditional decadal analyses. Additionally, it integrates perspectives on food security, water security, and ecological security, providing valuable insights into the impact of land-use policies on ecosystem stability and offering scientific support for regional ecological management and policy-making [25].
The HQ in the YRB from 1990 to 2020 exhibited an evidently increasing trend (consistent with the early study, which was attributed to human-driven land cover change (afforestation), i.e., a significant conversion of low-HQ cropland to high-HQ forest land. Spatially, decreases in HQ were observed in many regions. The expansion of urbanization, especially the rapid expansion of urban agglomerations in the Guanzhong Plain, has resulted in the urban area expansion in the adjacent areas, which are built on the encroachment of a large amount of agricultural land by impervious land and eventually affected the surrounding HQ. Ecological projects such as the conversion of farmland to forest and grass have transformed a large amount of cropland into forest land with higher habitat suitability, resulting in an increase in the area of high-grade HQ and an overall improvement in HQ. In the YRB, both increasing and decreasing HQ existed in the whole study area, but the amplitude of HQ increase was greater than the amplitude of HQ decrease, and the overall HQ in the YRB showed an increasing trend.
Dryland accounted for 40% of global land and supports more than 30% of the global population [26]. YRB is a main dryland region, and is also the arid-semi-arid transition zone where HQ is extremely sensitive to human disturbances. Over the past decades, anthropogenic revegetation, sharp reductions in sediment and runoff, and a +151% urbanization rate have produced highly complex effects on the YRB ecosystem, thus causing the loss of natural habitats and threatening the sustainable development. Therefore, the assessment of HQ on natural habitats in arid regions is of great significance to scientifically guide regional ecological restoration. This study provided an accurate HQ assessment on a year-by-year scale, and the results showed both increases and decreases in habitat quality, for example, in the periods 1995-1998 and 1998-2001. Consequently, studies on HQ based on a few years may have large uncertainty in reflecting accurate HQ changes in a given period. Our study demonstrated the uncertainty and provided a detailed dynamics of HQ changes, which can serve as a valuable reference for similar studies.
In this study, the elevation was the most relevant factor for HQ, with a correlation of 0.35, with very high and very low elevation areas showing very low HQ values. This is related to the topographic conditions of cultivated land and snow and ice cover. Topographic effects are important factors affecting vegetation distribution, population concentration patterns, and maintenance of community diversity, resulting in spatial variance of HQ [27].The topography of YRB is very complex, and land cover patterns are topographically constrained. The coupling of multiple related factors leads to an elevation gradient effect in HQ, with the higher the elevation, the lower the human interference. Areas with high HQ values are mainly distributed in mountainous areas with rich ecological resources, such as forest land and grassland, while areas with low HQ values are primarily observed in plain areas with extensive cultivated land and impervious surface. In addition, climatic conditions also indirectly determine the distribution of HQ [28]; the extensive desert zones in the northern part of YRB, which are also caused by the low precipitation and arid climatic conditions, form a great threat source land to the local ecosystem.
Strengthening the restoration and protection of regional ecological environments can alleviate the pressure caused by rapid urbanization and agricultural development on the HQ [29]. In this study, the YRB is divided into three unique management areas: ecological protection area in the upstream source area, ecological restoration area in the latter section of the upstream, and ecological synergy area in the midstream. Because the upper reaches of the YRB are extremely sensitive to external disturbances [30], a high degree of protection is the focus of ecological management there, such as the establishment of nature reserves and the prohibition of anthropogenic development. Ecological restoration areas have very low ecological scores, meaning low precipitation, poor vegetation coverage, and more threatening source lands. Improving vegetation restoration through low-water-consuming vegetation species, desertification control, and reducing land development are key measures in the ecological restoration area. The implementation of forestry ecological projects in the Yangtze River Economic Zone has effectively increased vegetation coverage, improved ecosystem resilience to some extent, and mitigated the rate of HQ decline [31]. Ecological synergy area requires synergies between ecosystem services, between ecology and economy, and between various management departments. Vegetation restoration has reached a threshold in the ecological synergy area, and maintaining the current level of vegetation and promoting economic development, for example, would be the most appropriate co-existence model for human society and natural ecosystems.
The InVEST HQ model is used as a tool to assist managers in making decisions about habitat degradation and biodiversity conservation, but its application in practice is still very limited. Biodiversity is reflected at the genetic, species, and ecosystem levels [32]. However, the InVEST model reflects the overall HQ of a region in terms of land use change affecting ecosystem diversity, but does not consider the vulnerability of specific species to different threats. In addition, the model parameters have uncertainties for the estimates of HQ, so the sensitivity analysis of the parameters is also noteworthy. Enhancing the accuracy of HQ assessment in the YRB by combining species diversity, climatic conditions, vegetation cover, and land threat sources is a key direction for future HQ research.
Conclusions
This study conducted a year-by-year, fine-scale assessment of habitat quality (HQ) in the Yellow River Basin (YRB), integrating perspectives of food security, water security, and ecological security to construct a scenario-based analysis framework. The innovation lies in the application of scenario analysis to evaluate the impacts of land-use policies on ecosystem stability, such as converting barren lands to cropland and prioritizing vegetation restoration in ecologically sensitive areas. The study also provides region-specific ecological management recommendations: enhancing ecological protection and reducing human interference in upstream areas, prioritizing low-water vegetation restoration and desertification control in ecological restoration areas, and balancing ecological protection with economic development in ecological synergy areas. These findings offer valuable scientific support for regional ecological management and policy-making.

