

Introduction
The Yancheng National Nature Reserve (YNNR) is the most important natural habitat along the migratory route of migratory birds in East Asia-Australasia. In recent years, anthropogenic activities and invasive species have jeopardized red-crowned crane populations and habitat ecology, particularly large-scale land use changes impacting ecosystem quality. Habitat quality refers to the ability of an ecosystem to provide suitable survival and reproduction for individuals and populations within a certain space and time frame and is a visual reflection of the current state of the ecosystem [1]. Therefore, the study of the habitat quality of the red-crowned crane’s regional habitat in the protected area is of great significance for the stability of regional ecosystem services, the maintenance of biodiversity, and the protection of endangered species.
Studies have shown that land use change leads to significant differences in the internal structure, processes, and functions of ecosystems, which is the main cause of habitat quality degradation and loss [2]. Traditional habitat quality assessments relied on field observation methods to collect relevant parameters, followed by constructing an evaluation index system for a comprehensive assessment. However, this approach suffered significant limitations: field sampling is typically limited to small spatial scales, demanding substantial resources (personnel, materials, time) and hindering long-term data analysis [3]. The combination of remote sensing and ecological modeling breaks through the limitations of field survey sampling. It allows for quantitative visualization and fine-scale analysis and evaluation of large and mesoscale changes in habitat quality at spatial and temporal scales [4-6]. Using Google Earth Engine (GEE) with advanced machine learning algorithms has become the main method for data acquisition and spatial analysis in large-scale ecological studies [7]. Meanwhile, the InVEST model can evaluate the habitat quality of biological habitats from the land use perspective and is currently the most mature and widely used ecological function evaluation model [8]. Akshita analyzed the spatial and temporal changes in the quality of overwintering migratory bird habitats and revealed the impacts of land-use changes on habitats [9]. Yang used the InVEST model to evaluate the ecosystem service functions of coastal wetlands in the Yellow River Delta, proving the reliability of the InVEST model for coastal wetland research [10].
The YNNR is the largest wintering site for the red-crowned crane, accounting for about 80% to 90% of the wintering population in China [11]. With the success of YNNR's bid [12], the red-crowned crane, the umbrella and flagship species of the wetland ecosystem, is of great ecological conservation significance. However, in the past, the habitat quality evaluation of YNNR was mostly based on conventional ecological influences such as food abundance and distance to water sources. It lacked the quality evaluation and research of YNNR from the perspective of the most precious species, the red-crowned crane. Meanwhile, vegetation cover reflects the ecological stability of the region and serves as an indicator for evaluating habitat quality [13, 14]. Therefore, this study innovatively evaluates the habitat quality of YNNR from the perspective of the red-crowned crane combined with the vegetation cover, which helps to reveal the changes in the habitat quality of the red-crowned crane in YNNR and its intrinsic mechanism and to understand the correlation between the red-crowned crane and the habitat quality. The study’s results can provide reference and theoretical support for conserving YNNR and red-crowned cranes, which contribute significantly to regional biodiversity conservation, environmental protection, and sustainable development.
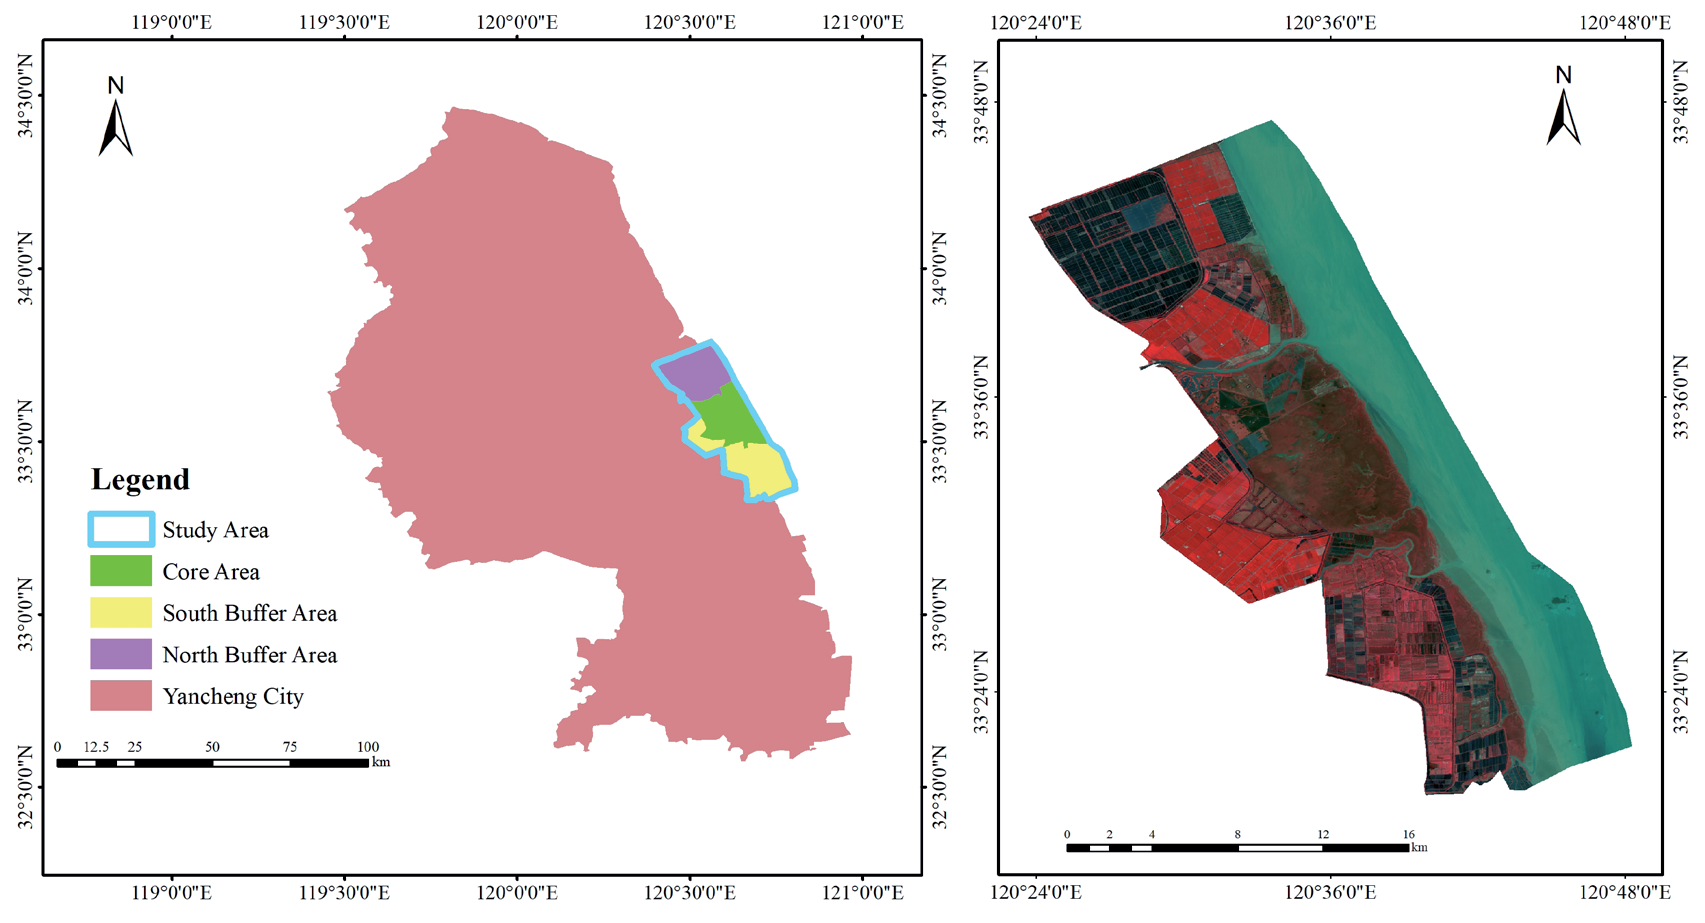
Leveraging the GEE platform and Random Forest algorithms, this study used the InVEST model, integrated with vegetation cover data, to assess habitat quality from the red-crowned crane’s perspective. We then analyzed the red-crowned crane population’s response to spatiotemporal changes in habitat quality within the study area. The objectives of this study were: (1) to evaluate and visualize the spatiotemporal distribution and patterns of habitat quality in 1993, 2003, 2013, and 2023; (2) analyze the correlation between red-crowned crane populations and spatiotemporal variations in habitat quality by gray correlation model; and (3) propose scientifically policy and management recommendations for wetland ecological construction and red-crowned crane conservation in the YNNR.
Materials and Methods
Study Area
The Yancheng National Nature Reserve (32°48′- 34°29′N, 119°53′-121°18′E) was established in 1983 and was upgraded to a National Rare Bird Nature Reserve in 1992 [15], including the core area, buffer area, and experimental area. The reserve exhibits a typical monsoon-influenced oceanic climate in a transitional climate zone between north subtropical and warm temperate regions [16]. YNNR is rich in species of flora and fauna, including 12 species of state-level protected animals, such as the red-crowned crane and 84 species of second-level protected animals, representing a significant component of the World Network of Biosphere Reserves. Due to their favorable ecological conditions, the core and buffer zones support over 80% of the reserve’s red-crowned crane population, significantly impacting the species’ survival [17]. This study focused on the core zone and adjacent northern and southern buffer zones (Fig. 1), encompassing a total area of 815.82 km2 of coastal wetland [12].
Data Sources
Remote Sensing Data
Synthetic remote sensing images captured in the summer of 1993, 2003, and 2013 Landsat 5 TM and 2023 Landsat 8, obtained from the United States Geological Survey (USGS) through GEE, were used to mitigate cloud interference. A CF Mask cloud mask was implemented in GEE to filter out images with more than 10% clouds for subsequent analysis [7]. A median function was added to the image synthesis code, which can effectively remove outliers.
According to the current land use classification system, based on the comprehensive analysis of the study objectives and natural conditions such as topography, climate, and hydrology, the study area was classified into ten categories of land use types: Phragmites australis, Spartina alterniflora, Suaeda salsa, mud, aquaculture pond, shallow water, farmland, saltpan, road, and sea.
Non-Remote Sensing Data
Study area boundaries and road network data were sourced from the Yancheng Reserve Management Station. Red-crowned crane population counts (1990- 2023) for the core and buffer zones were compiled from published literature and the reserve management station.
Table 1.
Feature index and significance.
Research Methods
Land Use Classification Based on Random Forest Model
This study employed a Random Forest model, which is flexible and easy to use within the GEE platform for land use classification. A spectral index feature dataset incorporating Landsat’s primary bands, vegetation indices, moisture indices, and built-up area indices [18, 19], was designed to enhance RF classification accuracy (Table 1) [20, 21]. A Random Forest parameter of 100 trees was selected [22]. A representative, uniformly distributed sample set of 1000 points, comprising latitude, longitude, and land use type, was generated. Within GEE, 70% of these samples were randomly assigned for model training, while the remaining 30% served for accuracy assessment. The Kappa coefficient exceeds 0.8, meeting the data accuracy requirements for further research.
Vegetation Cover
Vegetation cover serves as a crucial quantitative indicator of ground cover plant communities. Higher vegetation cover generally signifies a healthier, more productive ecosystem [23]. A linear relationship exists between vegetation cover and the Normalized Difference Vegetation Index (NDVI). Vegetation cover can be estimated from NDVI using a binary model. The formula for NDVI is shown in Table 1, and the formula for calculating vegetation cover is:
In the formula, NDVIsoil represents the NDVI value of pure bare-land pixels, and NDVIveg represents the NDVI value of pure vegetation pixels. The values corresponding to the 5th and 95th percentiles of the annual maximum NDVI cumulative frequency were used as NDVIsoil and NDVIveg, respectively [24].
Combined with the land use classification obtained from random forests, each of the four categories of Phragmites australis, Suaeda salsa, Spartina alterniflora, and farmland were further refined into five subcategories [25]. Vegetation cover was categorized by combining the natural breakpoint method into lowest-coverage (0, 0.2), low-coverage (0.2, 0.4), medium-coverage (0.4, 0.6), high-coverage (0.6, 0.75), and highest-coverage (0.75, 1) (Fig. 2).
Construction of the InVEST Habitat Quality Model
The InVEST Habitat Quality Module reflects the impact of human activities on the environment; the greater the intensity of human activities, the greater the threat to the habitat, the lower its quality, and the lower the level of biodiversity. In the InVEST model, the habitat quality of the study area is mainly affected by factors such as habitat type, threat factor, sensitivity of habitat type to threat factor, and distance between habitat type and threat factor.
(1) Habitat suitability and sensitivity setting
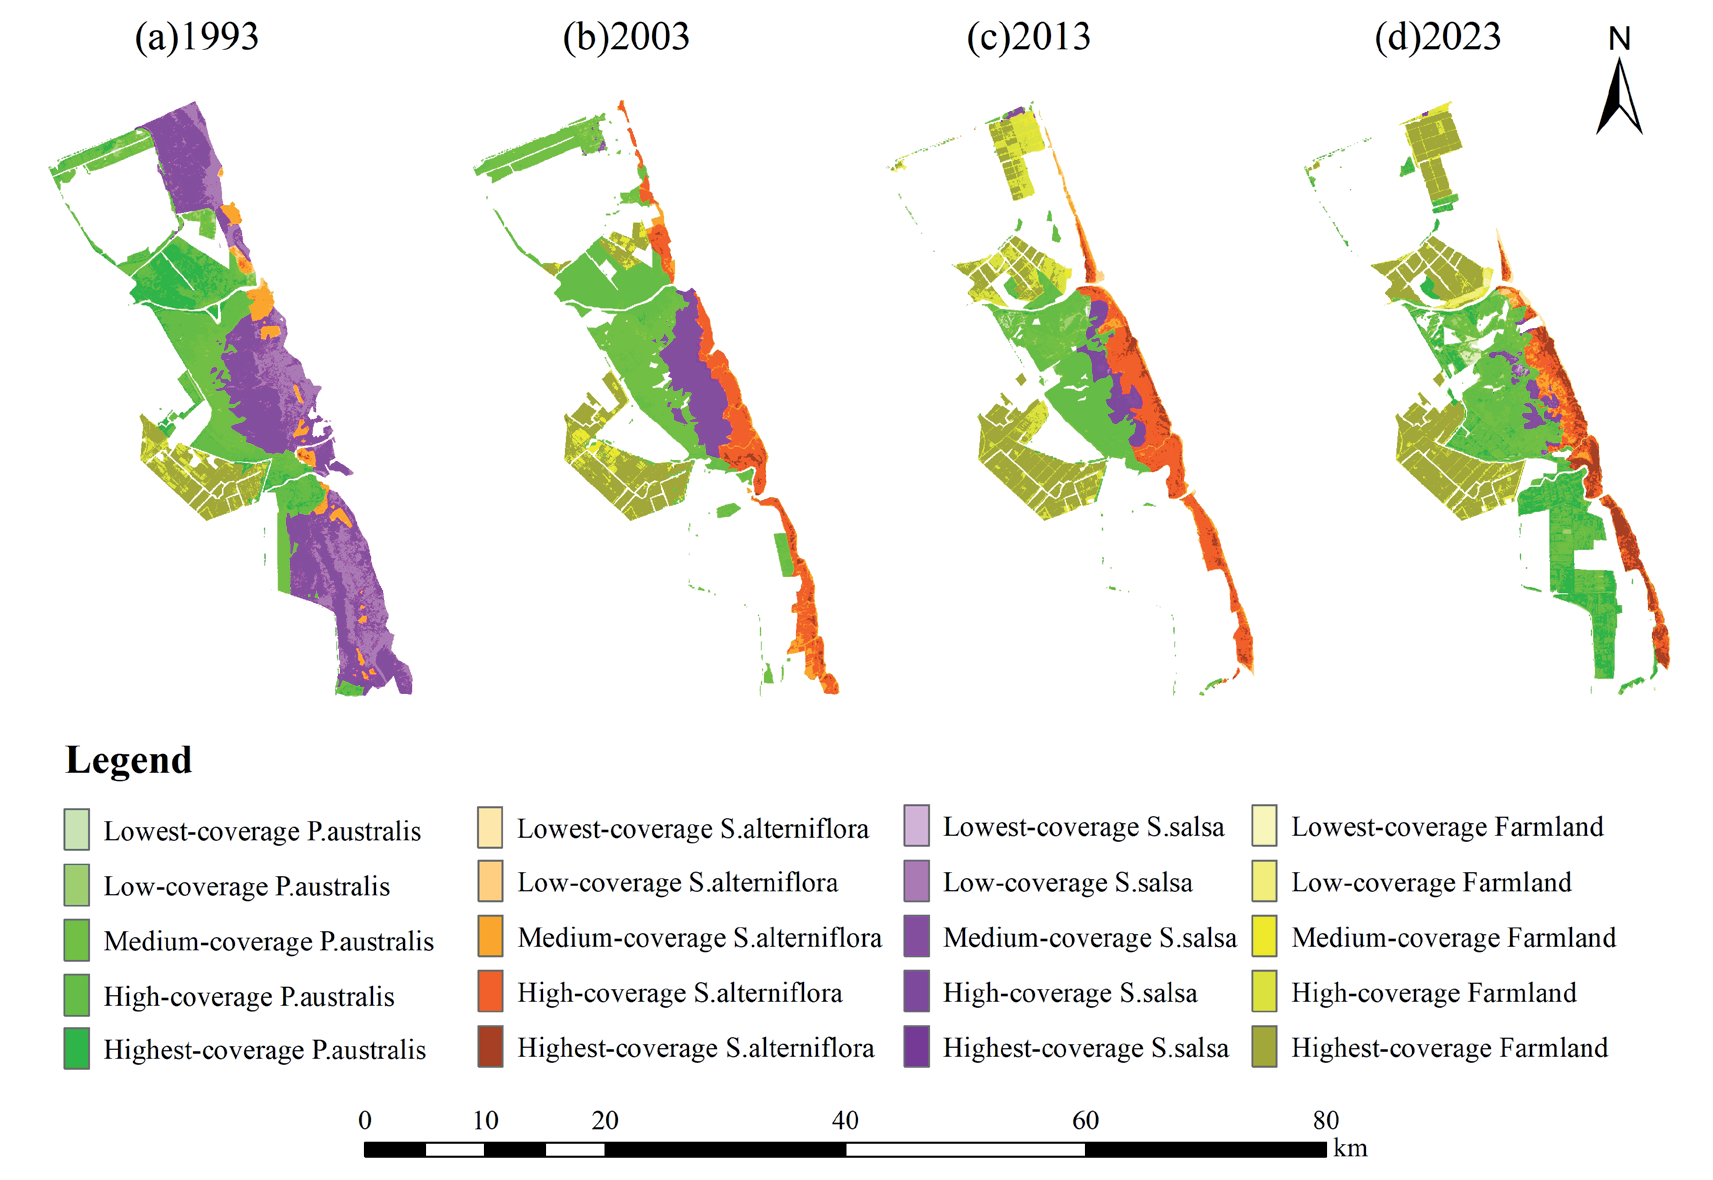
Table 2.
Habitat suitability and sensitivity.
In this study, the red-crowned crane was selected as an indicator species for evaluating and analyzing habitat quality in the study area. The highest suitability was set at 1 and the lowest at 0 [26, 27]. According to the literature and field surveys, red-crowned cranes preferentially inhabit grasslands dominated by Suaeda salsa and Phragmites australis. Phragmites australis provides crucial shelter from potential threats. The abundant shrimp and shellfish within the Suaeda salsa serve as a vital food source, making this habitat type the most important for red-crowned cranes: hence, a suitability score of 1 was assigned [17, 28]. Subsequently, shallow water, aquaculture ponds, mudflats, and saltpans, characterized by plentiful food and freshwater resources but limited shelter, were assigned habitat suitability scores ranging from 0.7 to 0.9. While aquaculture ponds and saltpans are anthropogenic landscapes, cranes can access desirable food sources like fish, crabs, and snails in aquaculture ponds [28]. However, saltpans are considered less suitable than aquaculture ponds due to their high salinity level. Spartina alterniflora, while offering both food and shelter, presents challenges due to its excessive height, potentially hindering crane movement, and its status as an invasive species encroaching upon the preferred Suaeda salsa habitat [14]. Consequently, a suitability score of 0.75 was assigned. Farmland can provide supplementary food resources, but agricultural activities can also disturb cranes, resulting in a suitability score of 0.5. Constructed land, such as roads, has the greatest negative impact on crane habitat quality, while seawater lacks the necessary food and landing sites, leading to a suitability score of 0 [29, 30]. The vegetation is not only an important food source for cranes [31, 32] but also creates good shelter conditions for cranes. The better the vegetation condition, the higher the habitat suitability [13]. Thus, the suitability index for vegetation decreases as vegetation cover levels decline (Table 2).
Natural landscapes are significantly less resistant and more sensitive to threat factors than artificial landscapes [31]. Therefore, natural landscapes are considered more sensitive to threat sources, while artificial landscapes are less sensitive. The numerical assignments are grounded in previous research and the existing literature. For the same vegetation types with varying cover, higher vegetation cover indicates greater ecological stability and reduced impact sensitivity [33].
(2) Threat Factor Setting
Habitat types are assigned sensitivity scores ranging from 0 to 1, where 1 signifies high sensitivity to threat factors. Considering the landscape characteristics and red-crowned crane habitat preferences, farmland, aquaculture ponds, saltpans, and roads – all significantly influenced by human activities – were selected as threat factors. The construction land, such as roads, is an exponential disturbance source, and the influence distance is set to 3 km. The influence distance of farmland, aquaculture ponds, and saltpans is set to 1 km, linearly expanding outward due to the disturbance of some anthropogenic activities [3, 34, 35]. Referring to the previous studies on the setting of red-crowned crane habitat threat factors, with the principle of the higher the adverse impacts on red-crowned crane habitats, the higher the weighting coefficients, and the weights were set to 0.7, 0.6, 0.6, and 0.9 [32, 34]. In this study, the maximum impact distance of the threat factor, the weight of the threat factor, and the declining linear correlation were set with reference to the relevant literature combined with the characteristics of the study area [35] (Table 3).
(3) Calculation of habitat quality index
The total threat level of the habitat type raster is obtained by inputting data such as the settings of the above model indicators and land use distribution maps into the InVEST habitat quality model. The formula for calculating habitat quality is:
In the formula: Qxj denotes the habitat quality of raster x in land use type j; Hj denotes the habitat suitability of land use type j; Dxj denotes the habitat degradation of raster x in land use type j; z is the normalization index, and k is the half-saturation constant. Referring to the InVEST model user manual, z takes the value of 2.5, k is 0.5 for the first time, and half the maximum value of the degradation index for the second time.
Gray Correlation Model
Gray correlation analysis, frequently employed for analyzing uncertain systems, quantifies the degree of similarity between trends based on their convergence or divergence. A higher gray correlation coefficient indicates greater trend similarity and stronger correlation [36]. The gray correlation model was constructed as follows.
(1) Calculation of correlation coefficients between indicators
In the formula, εij(t) represents the gray correlation coefficient of t period; ZiU (t) and ZjE (t) represent the standardized values of the indicators and crane population in the study area, respectively; ρ is the resolution coefficient, and 0.5 is chosen in this study.
(2) Calculation of correlation
In the formula, γij is the correlation between indicators i and j; k denotes k cycles. According to the existing literature [37], the correlations were categorized in relation to the actual situation in the study area (Table 4).
Table 3.
Attributes of habitat threat factors.
| Threat factors | Maximum impact distance (km) | Weight | Linear correlation of regression |
|---|---|---|---|
| Farmland | 1 | 0.7 | linear |
| Aquaculture pond | 1 | 0.6 | linear |
| Saltpan | 1 | 0.6 | linear |
| Road | 3 | 0.9 | exponential |
Results
Spatial and Temporal Variation in Habitat Quality
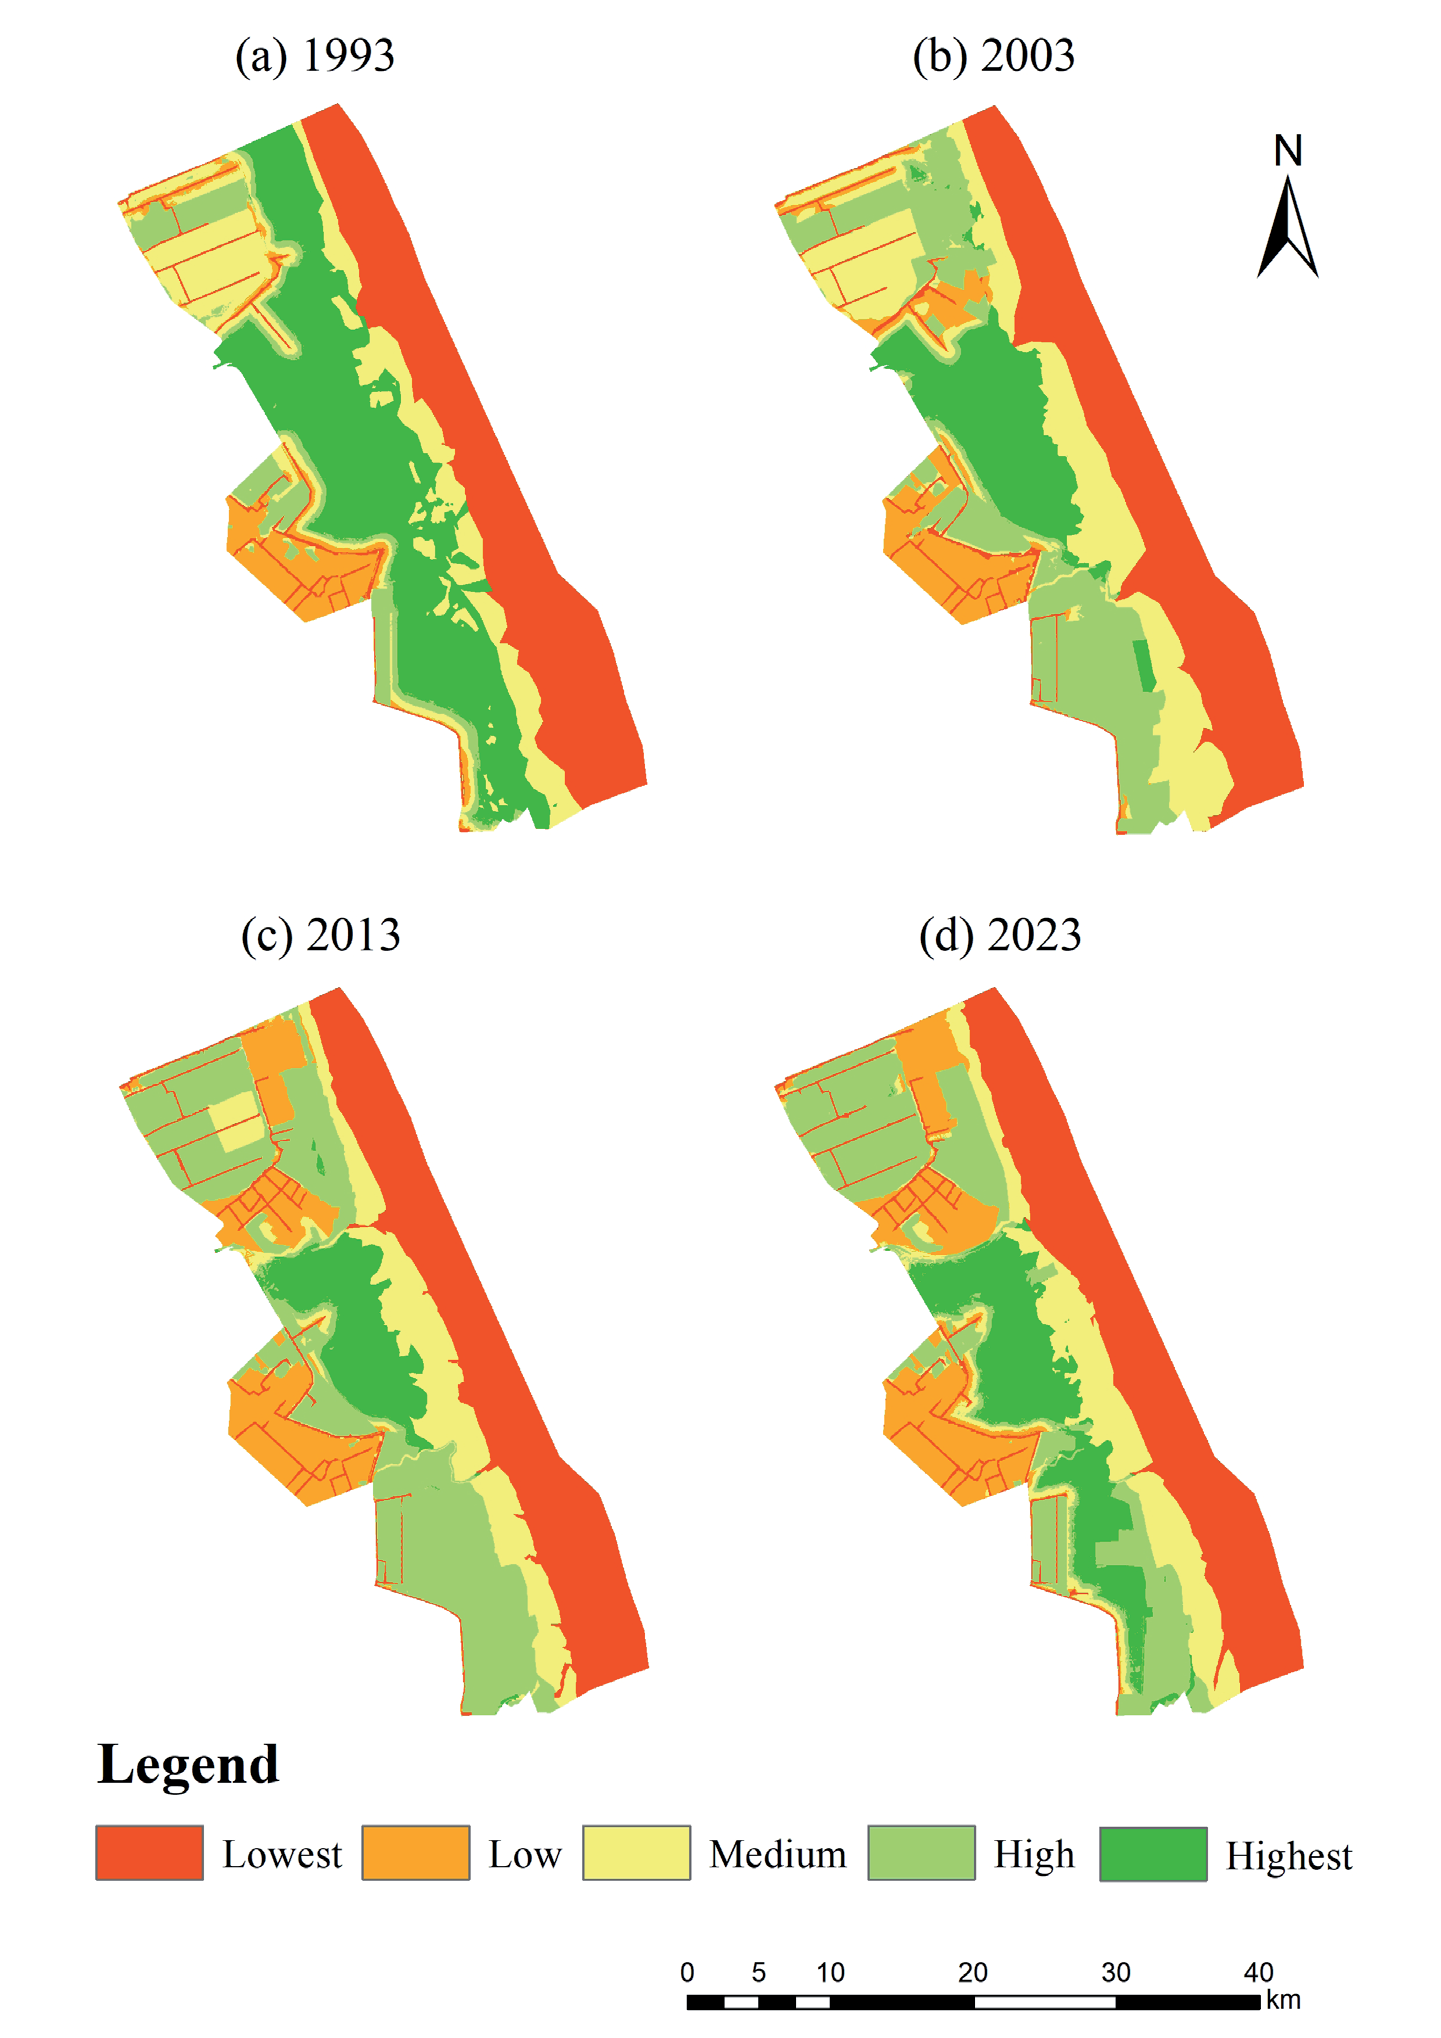
Using the InVEST model and parameters based on the habitat conditions of the red-crowned crane, the average habitat quality values are 0.553, 0.52, 0.514, and 0.516 for 1993, 2003, 2013, and 2023. Habitat quality was classified into five levels by combining the natural breakpoint method: lowest (0, 0.2), low (0.2, 0.5), medium (0.5, 0.75), high (0.75, 0.88), and highest (0.88, 1), and the distribution of habitat quality was obtained (Fig. 3).
From 1993 to 2023, the average Habitat Quality Index (HQI) for the study area remained above 0.5, indicating relatively high overall habitat quality, although a declining trend was evident. While overall habitat quality remained high, the area of highest quality habitat decreased (Table 5). Highest quality habitats continued to deteriorate between 1993 and 2013, decreasing in area by 196.01 km2, from 33.27% to 9.25%, and recovering in area by 48.45 km2 between 2013 and 2023. The area of high-quality habitats increased by 190.78 km2 between 1993 and 2013, and the decrease in area between the medium-, low-, and lowest-quality habitats increased by 18.77 km2. The area of the lowest-quality habitats did not change much, remaining around 30.7%. The area of low-quality habitats increased by 58.22 km2, and the area of medium-quality habitats decreased by 33.43 km2. The highest habitat quality is concentrated in the core area.
Analysis of Habitat Quality Degradation
Habitat degradation trends provide insights into future habitat loss risk. The magnitude of habitat degradation directly reflects and is proportional to the impact of threat factors on different landscape types. Changes in the HQI for each time period were calculated using the ArcGIS raster calculator. Based on the 2023 habitat quality degradation, five degradation classes were defined using a natural breaks classification: rapid decline (-1, -0.5), decline (0.5, -0.05), no change (-0.05, 0.05), improvement (0.05, 0.5), and rapid improvement (0.5, 1), giving a distribution map of habitat quality degradation (Fig. 4).
During the study period, the overall area of deterioration of habitat quality was greater than the area of improvement, in which the area of rapid decline and decrease in habitat quality was 107.37 km2 more than the area of rapid increase and rise in habitat quality. The area of no change in habitat quality was 446.51 km2 (Table 6), accounting for 54.73%, mainly distributed in the eastern part of the study area, the northern part of the southern buffer zone, and the central part of the core area. The area of rapid decline in habitat quality was 22.61 km2, and the area of decline was 215.13 km2. The rapid decline and decline areas were mainly concentrated in the northern buffer zone and the center of the southern buffer zone. The area of increasing habitat quality was 108.43 km2, and the area of rapidly increasing habitat quality in the study area was 22.54 km2, which was mainly distributed in the western portion of the northern buffer zone and the eastern portion of the southern buffer zone. Habitat quality deterioration was most severe between 1993 and 2003, with the percentage of the area changed being as high as 36.36%.
Bird and Habitat Quality Correlation Analyses
Spatial and Temporal Changes in Bird Distribution
The Yancheng red-crowned crane population (Fig. 5) exhibited a pattern of increase followed by a decline and subsequent recovery. Between 1990 and 2003, the population significantly increased, reaching a peak of 1128 birds in 2000. A general downward trend then ensued, reaching a 40-year low of 256 birds in 2019.
Table 5.
Area and proportion of habitat quality in the study area from 1993 to 2023.
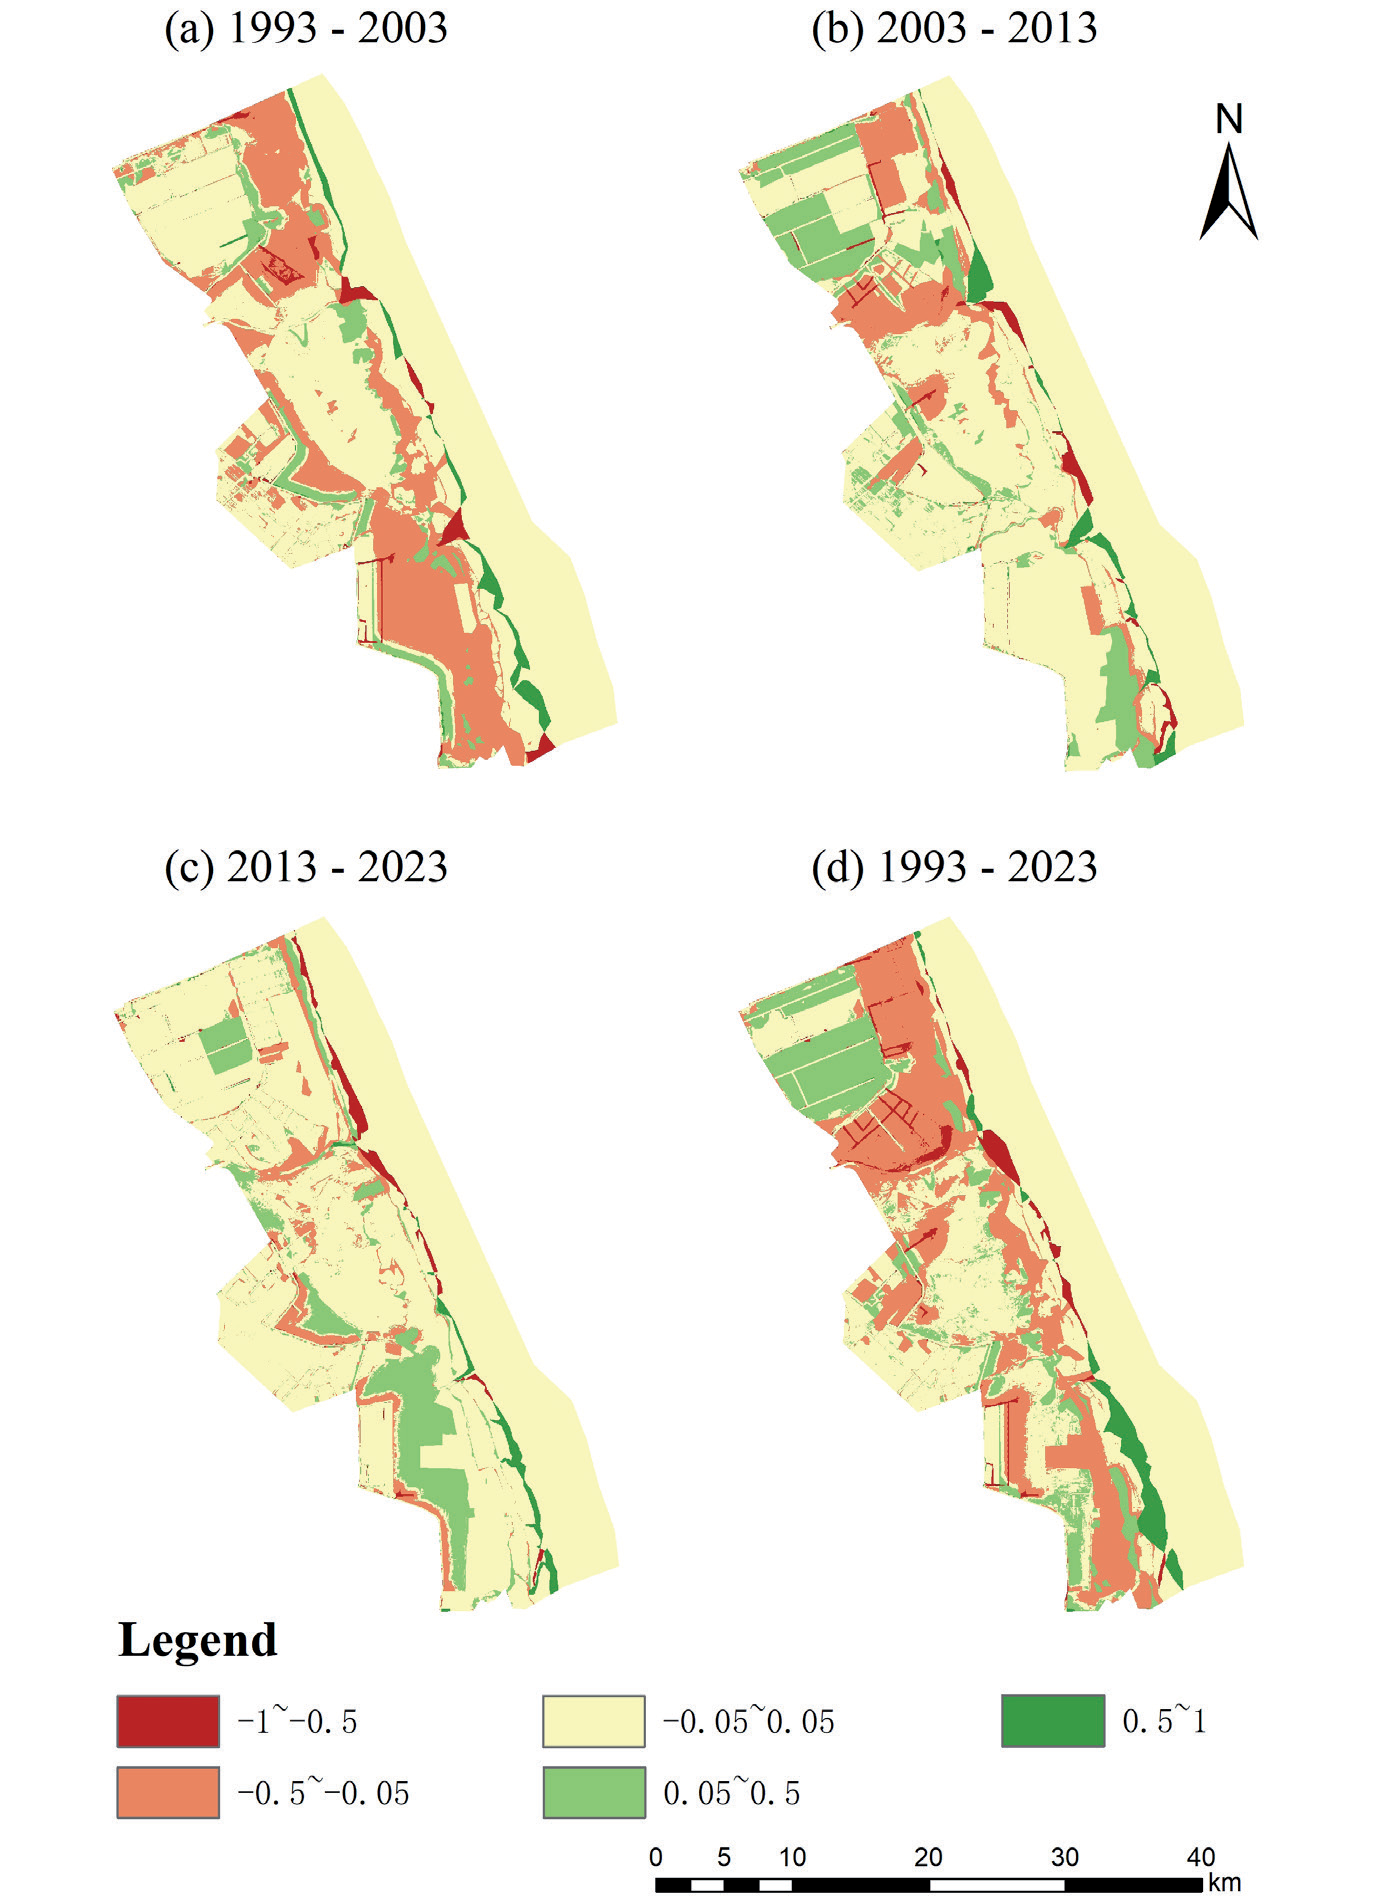
Table 6.
Habitat degradation area and proportion of study area from 1993 to 2023.
Fig. 5.
Annual number of cranes in each region and the proportion of cranes in the core and buffer zones to the total number of cranes in the study area from 1990 to 2023 (averaged over the last 3 years).
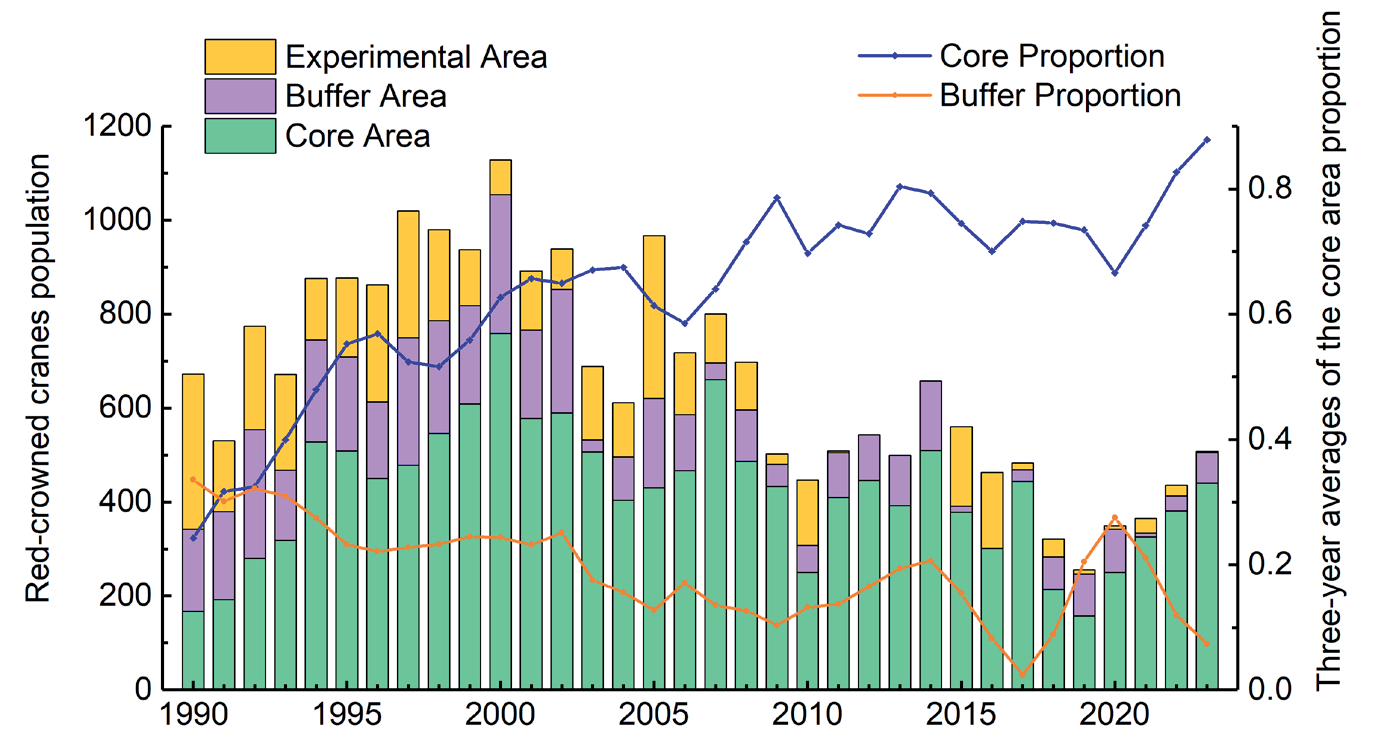
Red-crowned crane populations in both the core and buffer zones followed the overall Yancheng trend of initial growth, subsequent decline, and recent recovery. To smooth out year-to-year fluctuations inherent in population counts, the proportion of cranes in each zone is presented as a three-year average. The core zone’s proportion increased substantially from 31.69% in 1990 to 82.71% in 2023. Overall, the core area has become a place where a large flock of red-crowned cranes often roosts, and its number accounts for more than 70% of the total number of red-crowned cranes in Yancheng since 2007. In contrast, the number of birds in the buffer zone has declined.
Bird Response to Habitat Quality
Extremely strong correlations were observed between red-crowned crane numbers and habitat quality: 0.784 for lowest quality and 0.838 for medium quality (Table 7). Crane numbers followed a pattern of initial increase and decline: 467 in 1993, 717 in 2003, 516 in 2013, and 417 in 2023. Between 1993 and 2023, medium- and lowest-quality habitats decreased by 34.43 km² and 5.02 km2, respectively, coinciding with a 50- bird decline in crane numbers. Between 1993 and 2003, the medium-quality habitat increased by 27.09 km2, and the number of red-crowned cranes increased by 250. A substantial decrease in medium-quality habitat by 61.52 km² was observed between 2013 and 2023, correlating with a 201-bird decline.
Discussion
Impact of Human Activities on Habitat Quality
The study area consistently showed high average habitat quality indices above 0.5, yet a concerning downward trend was observed, with habitat degradation exceeding improvement. The main reason for this is that the Phragmites australis, Suaeda salsa, and shallow water, which are suitable for the survival of the red-crowned crane, are the main areas in the study area, accounting for more than 80% of the total area. However, intensive human activity significantly impacts coastal land use, negatively affecting habitat quality [1]. On the one hand, as the coastal wetlands of Yancheng have been continuously developed due to urbanization, the natural grassland in the study area, especially in the buffer zone, has been developed into farmland of higher direct value [38]. On the other hand, the exotic Spartina alterniflora threatens Suaeda salsa, which is the best habitat for cranes. Although Spartina alterniflora plays a positive role in protecting beaches, its strong competitive ability, due to its reproductive strategies, leads to its replacement of Suaeda salsa [14]. Human activities and the expansion of Spartina alterniflora make the threat to the survival of the red-crowned crane in the YNNR more and more serious, and the ecosystem function declines. So, it is urgent to control the expansion of Spartina alterniflora and the ecological restoration of the Suaeda salsa and Phragmites australis.
Spatially, the highest quality habitats are concentrated in the central core zone, dominated by Phragmites australis and Suaeda salsa, reflecting minimal human disturbance and preservation of pristine habitats. Habitat quality decline in the buffer zone is largely due to the conversion of Phragmites australis and Suaeda salsa to anthropogenic land uses like farmland and roads, reflecting increased human intervention. Economic growth, indicated by rising GDP and per capita income, is a primary driver of this land-use change, influencing industrial growth and altering land allocation, resulting in the reduction of Suaeda salsa, Phragmites australis, and mudflat and an increase in aquaculture ponds and farmland [39]. Therefore, future regional development should prioritize ecological protection to maximize social, economic, and environmental benefits.
Linkages Between Red-crowned Cranes and Habitat Quality of Roosting Sites
The number of red-crowned cranes in the study area showed a fluctuating change, increasing and then decreasing. A strong correlation exists between crane population size and all levels of habitat quality, with extremely strong correlations observed for the lowest and medium habitat quality. This highlights the influence of not only the lowest quality habitats but also overall habitat quality on crane survival and behavior. Spatially, the ratio of the number of red-crowned cranes in the core area to the total number of cranes in Yancheng increased from 31.69% in 1990 to 82.71% in 2023, indicating that the distribution of cranes has gradually shifted from a uniform distribution in the coastal wetlands of Yancheng to a centralized distribution in the core area [28]. This is because the core area is far from the threat of artificial landscapes such as construction land, cultivated land, and roads and is less disturbed by human activities. There are Phragmites australis and Suaeda salsa that are most suitable for the red-crowned cranes to live in, and the habitat is of high quality and rich in flora and fauna, which provides abundant food resources and hiding conditions for the red-crowned cranes [40]. While the buffer zone population declined, it remains a secondarily important habitat. The buffer zone has more agricultural land, such as aquaculture ponds, but the rice left after the harvest of agricultural land is an important food supplement [41]. Therefore, the YNNR needs to focus on two aspects: optimization of land use layout and scientific protection.
Recommendations for Sustainable Development of Habitat Environment
Economic development and urbanization have intensified threats to habitat quality from human activities, underscoring the increasing importance of wetland ecology. At present, the "dismantling of aquaculture ponds and restoration of Suaeda salsa" project has been basically completed in the core area, and this project in the buffer zone is also being actively carried out. However, we still need to continue our efforts to control the expansion of Spartina alterniflora and the ecological restoration of Suaeda salsa. The following policy recommendations are proposed based on our analysis to ensure the sustainable development of YNNR.
Optimize Land Use and Formulate a Scientifically Sound Land Development Plan
Research indicates that anthropogenic activities drive land-use changes within the reserve, consequently affecting habitat quality. Specifically, artificial landscapes, such as aquaculture ponds and agricultural land, are progressively encroaching upon natural wetlands like grasslands and tidal flats. Despite successful protection of core area habitats and an increasing red-crowned crane population, bird saturation in habitat limits further population growth or even causes a decline due to increased bird density [42]. Therefore, rigorous control over the expansion of artificial landscapes within the Yancheng coastal wetland is crucial. Establishing a vegetated buffer zone comprising woodlands and grasslands between artificial and natural landscapes would mitigate the disruptive influence of human activities on the ecological environment and red-crowned cranes. Concurrently, restoring agricultural land and aquaculture ponds to their natural state, reducing the scale of industrial parks, and promoting ecologically balanced development are essential [43]. A synergistic approach encompassing land development, utilization, remediation, and protection is necessary to foster a healthy land ecosystem. Regarding the threat of Spartina alterniflora, their expansion should be controlled, maintaining a moderate scale to capitalize on its shoreline protection function while minimizing the risk to native habitats. Simultaneously, active ecological restoration of Suaeda salsa communities is needed to preserve biodiversity and improve red-crowned crane habitat quality.
Reduce Anthropogenic Interference and Strengthen Government Management
The red-crowned crane, being a highly sensitive species with stringent habitat requirements, benefits from government environmental monitoring that can prevent disturbances from residents and tourists. Red-crowned cranes favor vegetated areas offering sheltered conditions, highlighting the importance of both vegetation cover and height. The management station should selectively harvest the reeds in the protected areas and retain some to provide a suitable habitat for the red-crowned cranes. At the same time, it is necessary to strengthen the ecological compensation for farmers and fishermen, reduce the intensity of farmland reclamation and fishing, and provide sufficient food resources such as rice and fish for the red-crowned cranes [44]. The management station should foster collaboration with universities and research institutions to conduct more systematic and in-depth investigations on red-crowned crane habitats, biodiversity, ecological compensation, economic development, and ecological balance. This collaborative research will provide the theoretical foundation for an informed ecological environment and red-crowned crane protection strategies.
Limitations and Prospects
In contrast to prior research, this study emphasized habitat quality assessment within YNNR, specifically focusing on the survival parameters of red-crowned cranes and introducing vegetation cover. It fortifies the correlative analysis between this rare species and habitat quality, informs management policies across different functional zones, and proposes targeted conservation measures. However, this paper has certain limitations and needs to be further improved in future studies. Firstly, the habitat quality assessment of the InVEST model based on a single species is somewhat limited, and the simulation results may be skewed by the paucity of parameterization and literature pertaining to the red-crowned crane. Future species-based habitat quality studies should incorporate other regionally significant species, such as other endangered birds and benthic organisms, and integrate habitat quality and species diversity [45]. Secondly, habitat quality is modulated by land use and vegetation cover but is also influenced by temperature, precipitation, and ecological structure and function [27]. Subsequent research should focus on developing an integrated evaluation model of habitat quality under multiple ecological conditions. Future investigations should systematically analyze the mechanisms driving coastal wetland habitat degradation, examining both the expansion of mutualistic grasses and anthropogenic impacts. Furthermore, future efforts should incorporate a landscape ecology perspective to rationalize the planning of protected area habitat types.
Conclusions
This study utilized the InVEST model to evaluate habitat quality from the red-crowned crane’s perspective combined with vegetation cover. The gray correlation model was used to analyze the crane’s response to habitat quality. The main findings were as follows: (1) The overall habitat quality in the study area was high, but a decreasing trend in the habitat quality index was observed, with a reduction of 147.56 km2 in the area of highest quality habitat. This decline was primarily attributed to human activities and the expansion of Spartina alterniflora. (2) The area of degraded habitat quality exceeded that of improved habitat quality, with the degraded areas concentrated in the buffer zone, primarily due to the replacement of native vegetation through farmland reclamation and an increase in artificial land use. (3) The red-crowned crane population in the study area exhibited an initial increase followed by a decrease, demonstrating an extremely strong correlation with the lowest and medium-quality habitats. Due to lower levels of human disturbance and the relatively intact preservation of natural wetlands in the core area, the distribution of red-crowned cranes gradually shifted from a uniform distribution across the YNNR to a concentrated distribution towards the core area. The findings of this study suggest implementing rational land use planning, strictly controlling anthropogenic disturbances, curbing the expansion of Spartina alterniflora, and strengthening environmental management to maintain the ecological integrity of the red-crowned crane habitat.

