

Introduction
Fluorine (F) is a halogen element known for its strong oxidizing properties, and its compounds are known for their stability, playing a crucial role in various industries such as phosphate fertilizers and pesticides, aluminum smelting, glass and brick production, coal combustion, and semiconductor manufacturing [1, 2]. Fluoride naturally occurs in various human body tissues, with the highest concentration (80% to 90%) found in teeth and bones. The human body requires an appropriate intake F⁻ (0.80-1.00 mg/L) through drinking water and food. Excessive consumption can lead to various diseases such as dental fluorosis, osteoporosis, brittle bone disease, arthritis, cancer, and so on [3, 4]. Consequently, the World Health Organization has established guidelines stating that the inorganic fluoride concentration in drinking water should not exceed 1.50 mg/L. Over 20 countries have reported the presence of high-fluoride water (exceeding 1.50 mg/L), and approximately 200,000 individuals worldwide are affected by fluoride contamination, particularly in arid and semi-arid regions such as North Africa, the Middle East, northern China, and India [5-8].
The fluorine in high-F⁻ water was generally originally from natural and anthropogenic sources. Under natural conditions, high-F⁻ water was the outcome of long-term geological evolution or short-term geochemistry, which was associated with the dissolution of F-bearing minerals, including fluorite, biotite, muscovite, mica, fluorapatite, and hornblende [9-11]. Additionally, alkaline environments [12, 13], calcite precipitation [14], evaporation [15, 16], the competitive effect [17-19], and cation exchange of Ca2+ with Na+ [20] may facilitate F⁻ enrichment into water. Besides natural processes, anthropogenic sources such as fertilizer use, industrial wastewater discharge, and coal burning also elevate F⁻ concentration in water [21]. Previous studies have found that high-F⁻ hot springs water commonly occurs worldwide due to geological origin [22-24]. Consequently, hot spring runoff can also provide huge amounts of fluoride to downstream water bodies. Therefore, determining the F⁻ distribution characteristics and formation mechanism of high-F⁻ river water is necessary to protect the river water environment and drinking safety.
Generally, river damming can serve various functions, including water conservancy, power generation, water storage, irrigation, and flood control [25]. By implementing river damming, the creation of urban hydrophilic environments enhances the beauty of the urban landscape and facilitates targeted pollution control. Unfortunately, river damming has significantly altered hydrology and water quality, leading to detrimental ecological and environmental consequences for river ecosystems and biodiversity [26, 27]. River damming typically decreases the water flow velocity, alters sediment transportation patterns, and consequently enhances water-rock interactions, ultimately leading to increased pollutant accumulation in river systems [28]. Hence, river damming construction may enhance the distribution of F-bearing minerals, facilitating F⁻ enrichment in river water. Unfortunately, no studies have revealed the spatial distribution and formation mechanism of the migration and enrichment of fluoride in the irrigation area downstream of hot springs.
Therefore, in this study, the main objectives are listed as follows: (1) to investigate the abundance and spatial distribution of F⁻ in river water around hot springs; (2) to evaluate the influence of hot springs development on the spatial distribution of high-F⁻ river water; (3) to identify the formation mechanisms of high-F⁻ river water around hot springs in the study area. The outcomes of this research will provide a better understanding of the mechanisms of high-F⁻ river water around hot springs and help secure safe irrigating water sources for residents.
Materials and Methods
Study Area
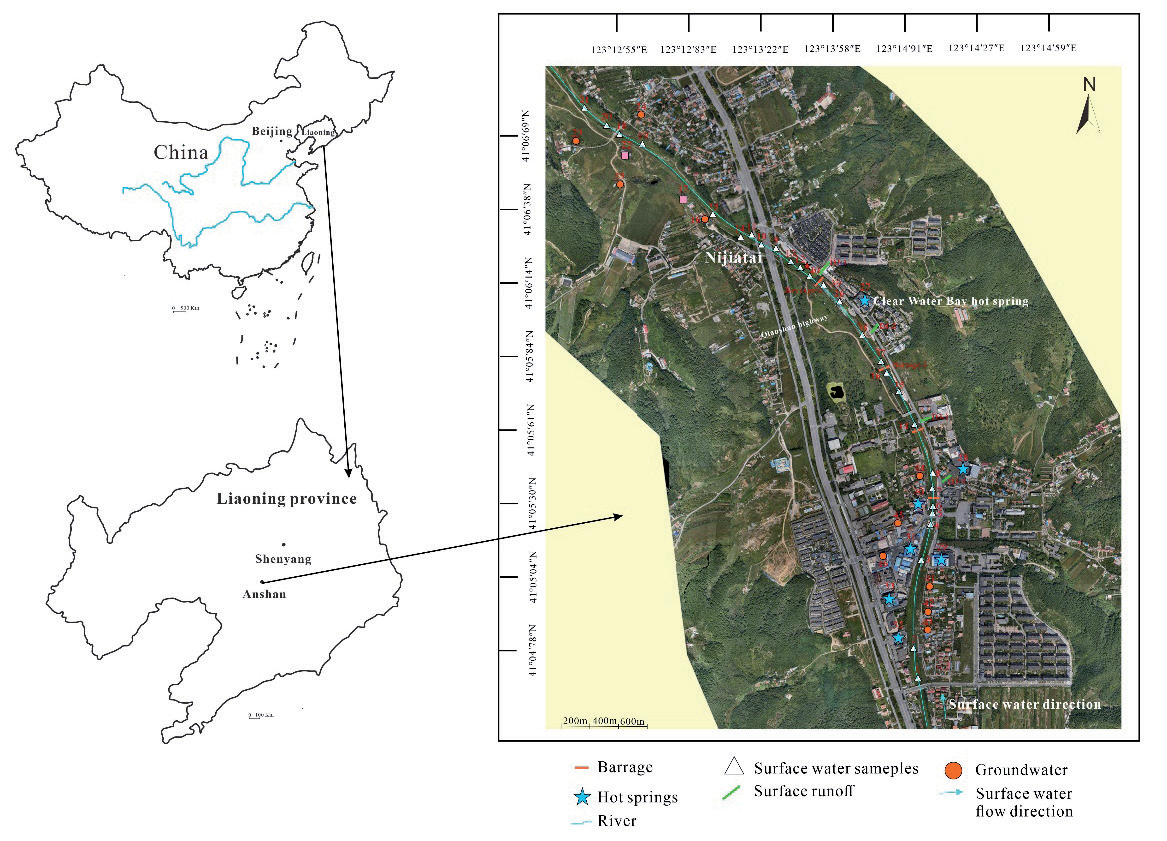
Anshan City is located in the northern part of the Liaodong Peninsula in Northeast China, with a total area of 9,255 km2. It is located between 122º10’E ~ 123º41’E and 40º27’N ~ 41º34’N (Fig. 1). As the north temperate continental subhumid monsoon climate, the annual average temperature, precipitation, and evaporation are 9.6℃, 720.66 mm, and 1058.5 mm, respectively, in Anshan city. Hot spring resources were enriched in Anshan, where many hot springs are distributed. Among them, the Qianshan hot spring developed the earliest and most famous hot spring in 1949. After over 75 years of development, a large amount of high-F⁻ hot springs water is draining into hot springs downstream river water areas, although drainage has been banned since 2000.
The Wanshui River is the largest river in terms of water in Anshan city, with a basin area of 458 km2 and a flow length of 67 km. It originates from Xianrentai, the highest peak in the Qianshan Scenic Area, and merges into the Taizi River in Liaoyang, which is a first-level Taizi River tributary. There are 9 main sewage outlets in the Wanshui River area. The sewage outlets are mixed with domestic and industrial sewage. Pollution sources in the river are generally generated from urban surface runoff, rural domestic wastewater, solid waste, and so on. In addition, the local government built many river dams on the upper reaches of the Wanshui River for the sake of landscape and holidays. Generally, the chemical type of non-polluted river water is HCO3-NaCa type, which has mineralization of 0.2-0.6 g/L and a pH value of 7.3-8.8.
Sample Collection
From August to October 2023, a total of 50 water samples were collected from the Wanshuihe River, including 7 hot spring samples, 11 groundwater samples, 4 surface runoff water samples, and 28 river water samples (Fig. 1). Before collection, brown polyethylene sampling bottles were washed 2~3 times with distilled water and sample water and then filtered using filter membranes with a pore size of 0.45 μm. Approximately 550 mL bottles of sample water were collected for cation, anion, and DOM concentration analyses, respectively. The sample water pH and total dissolved solids (TDS) were measured on-site using a portable pH meter (HANNA H18424) and a portable conductivity meter (HANNA H1833), respectively. All samples were stored at 4℃ and analyzed within 10 days.
Sample Analysis
The cations of K+, Ca2+, Na+, and Mg2+ concentrations were tested by inductively coupled plasma emission spectrometer (ICP-OES). The main anions of F⁻, Cl⁻, SO42⁻, and NO3⁻ levels were determined using ion chromatography (Dionex Integrion IC, Thermo Fisher, USA). HCO3⁻ concentration was measured through acid-base titrations within 24 h of sampling. DOM concentration was measured using a total organic carbon analyzer (TOC-5000, Japan), represented as dissolved organic carbon (DOC).
Analytical Quality Control
Three parallel measurements were made on all water samples, and the average value of the test data was calculated. To ensure data accuracy, 20% of the samples were selected as blind samples. Ionic charge balance error (ICBE) is often used to guarantee the quality of chemical data for 5%. The detection limit was 1.0 mg/L for bicarbonate concentration analysis and 0.1 mg/L for F- and other ion concentration analyses.
Statistical Analysis
Origin 2021 software was used for descriptive statistical analysis and for drawing all figures and diagrams. Piper and Gibbs’s diagrams were used to elucidate the hydrogeochemical facies and water–rock interaction processes [29]. The PHREEQC geochemical model was used to calculate the saturation indices (SI). Descriptive data, such as the mean, range, and standard deviation, are shown in Table 1.
Results
Hydro-Chemical Characteristics of River Water in the Study Area
The pH of river water ranged from 7.30 to 8.80 in Table 1, with a mean value of 7.92, indicating that the river was in a weakly alkaline environment. Ca2+ was the dominant cation in river water, and its concentration ranged from 31.80 mg/L to 70.90 mg/L. Meanwhile, HCO3- was the main anion, with concentrations ranging from 95.0 to 230.0 mg/L. The mean cation and anion concentrations showed the following decreasing trends: Ca2+>Na+>Mg2+>K+, and HCO3⁻>SO42⁻>Cl⁻>NO3⁻. The concentration of TDS ranged from 209 mg/L to 533 mg/L, with a mean value of 244 mg/L. All the samples met China’s national surface water environmental quality standard, Class III (GB-14848- 2017) (1000 mg/L).
The F⁻ concentration in river water ranged from 0.50 mg/L to 2.56 mg/L, with an average value of 1.14 mg/L. According to the Environmental Quality Standards for Surface Water (GB3838-2002), a total of 59% of water samples exceeded the Class III standard limit (1.00 mg/L). The river water samples were divided into three groups according to F⁻ concentration: (1) the low-F⁻ river water group (F⁻ concentration ≤ 1.00 mg/L);
Table 1.
Geochemical data of high-F- and low-F- river water samples collected in this study.
(2) 1.00 mg/L < F⁻ ≤ 1.50 mg/L; and (3) F⁻ > 1.50 mg/L. Where the F⁻ concentration was higher than 1.00 mg/L, these were referred to as high-F⁻ river water. The high-F⁻ river water was predominately the Ca-Na-Mg-HCO3-SO4 type (75.29%) and Ca-Na-HCO3-SO4 type (24.70%), and the low-F⁻ river water was Ca-Na-Mg-HCO3-SO4 type (93.10%) in Fig. S1.
Spatial Distribution of Fluoride in River Water
The concentrations of F⁻ in river water were inversely proportional to the water flow distance in Fig. 2a). Among them, the highest concentration of F was at 2000 m, reaching 2.56 mg/L, which exceeded the Environmental Quality Standards for Surface Water (GB3838-2002) Class III standard limit (1.00 mg/L) by 2.56 times. Before flowing through the Clear Water Bay hot spring, the F⁻ concentration in river water was all lower than 1.00 mg/L, while the F⁻ concentration in the river water exceeded 1.00 mg/L when flowing through the Clear Water Bay hot spring, suggesting that the Clear Water Bay hot spring may be the source of F⁻ pollution in river water. However, under government management, Clearwater Bay’s hot spring stopped efflux around 2000 years ago, suggesting another source for high-F⁻ river water existence.
Except for cross-section 13, there was little difference in F⁻ concentration between the right and left sides of the river, indicating that the overall F⁻ concentration of the river water may originate from the same F⁻ source. The study found that the right side of the river was located by Clear Water Bay hot spring, while woodland, residential areas, and farmland inhabited the left side of the river. This fact further confirmed that the Bay’s hot spring bank was not the main source of F⁻ pollution in river water.
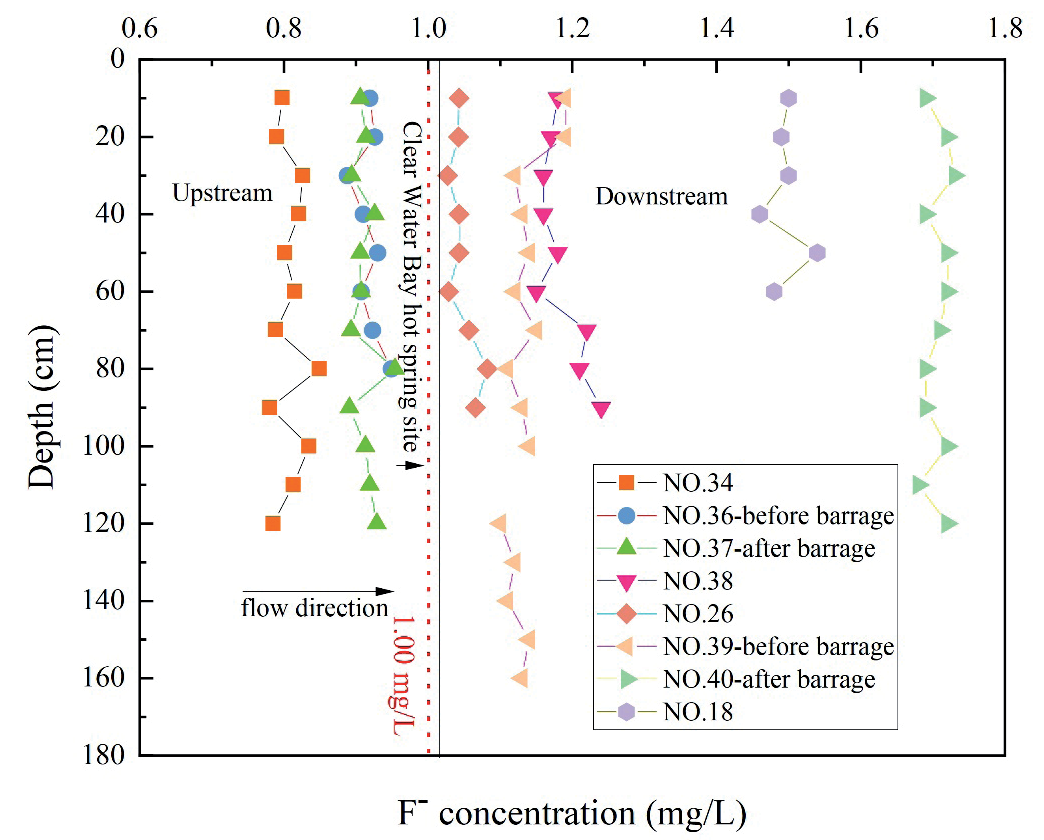
Fig. 2b) shows that F⁻ concentration in river water sediments in Clear Water Bay hot spring downstream was significantly higher than those in the upstream, indicating that the F⁻ dissolution from historical discharge of wastewater containing high F⁻ concentration may be the main source for high-F⁻ river water after flowing through the Clear Water Bay hot spring. The F⁻ concentration in deep river water both upstream and downstream of Clear Water Bay hot spring was significantly higher than that in shallow river water in Fig. 3, suggesting that the dissolution of high-F⁻ concentration sediments played a significant role in the high-F⁻ river water.
Potential Sources of High-F- River Water
Fig. S2 shows the distribution of F⁻ concentration in river water in different areas of the study area. The F⁻ concentration in suburb and study area river water was obviously higher than in the city river water, indicating that dry and wet sedimentation of the atmosphere was playing an insignificant role in high-F⁻ river water. As shown in Fig. S3, the F⁻concentration of hot springs was significantly higher than that of groundwater and river water, indicating that hot springs were likely to be potential sources of high-F⁻ river water. Meanwhile, the F⁻ concentration of groundwater was close to that of river water, but the average value was slightly lower than that of river water, indicating that irrigation water or domestic water was not an important factor in forming high-F⁻ river water.
Fig. 2.
Plots of: a) Horizontal distribution of F– concentration in river water; b) Comparison of F- concentration in river sediments before and after the Clear Water Bay hot spring site.
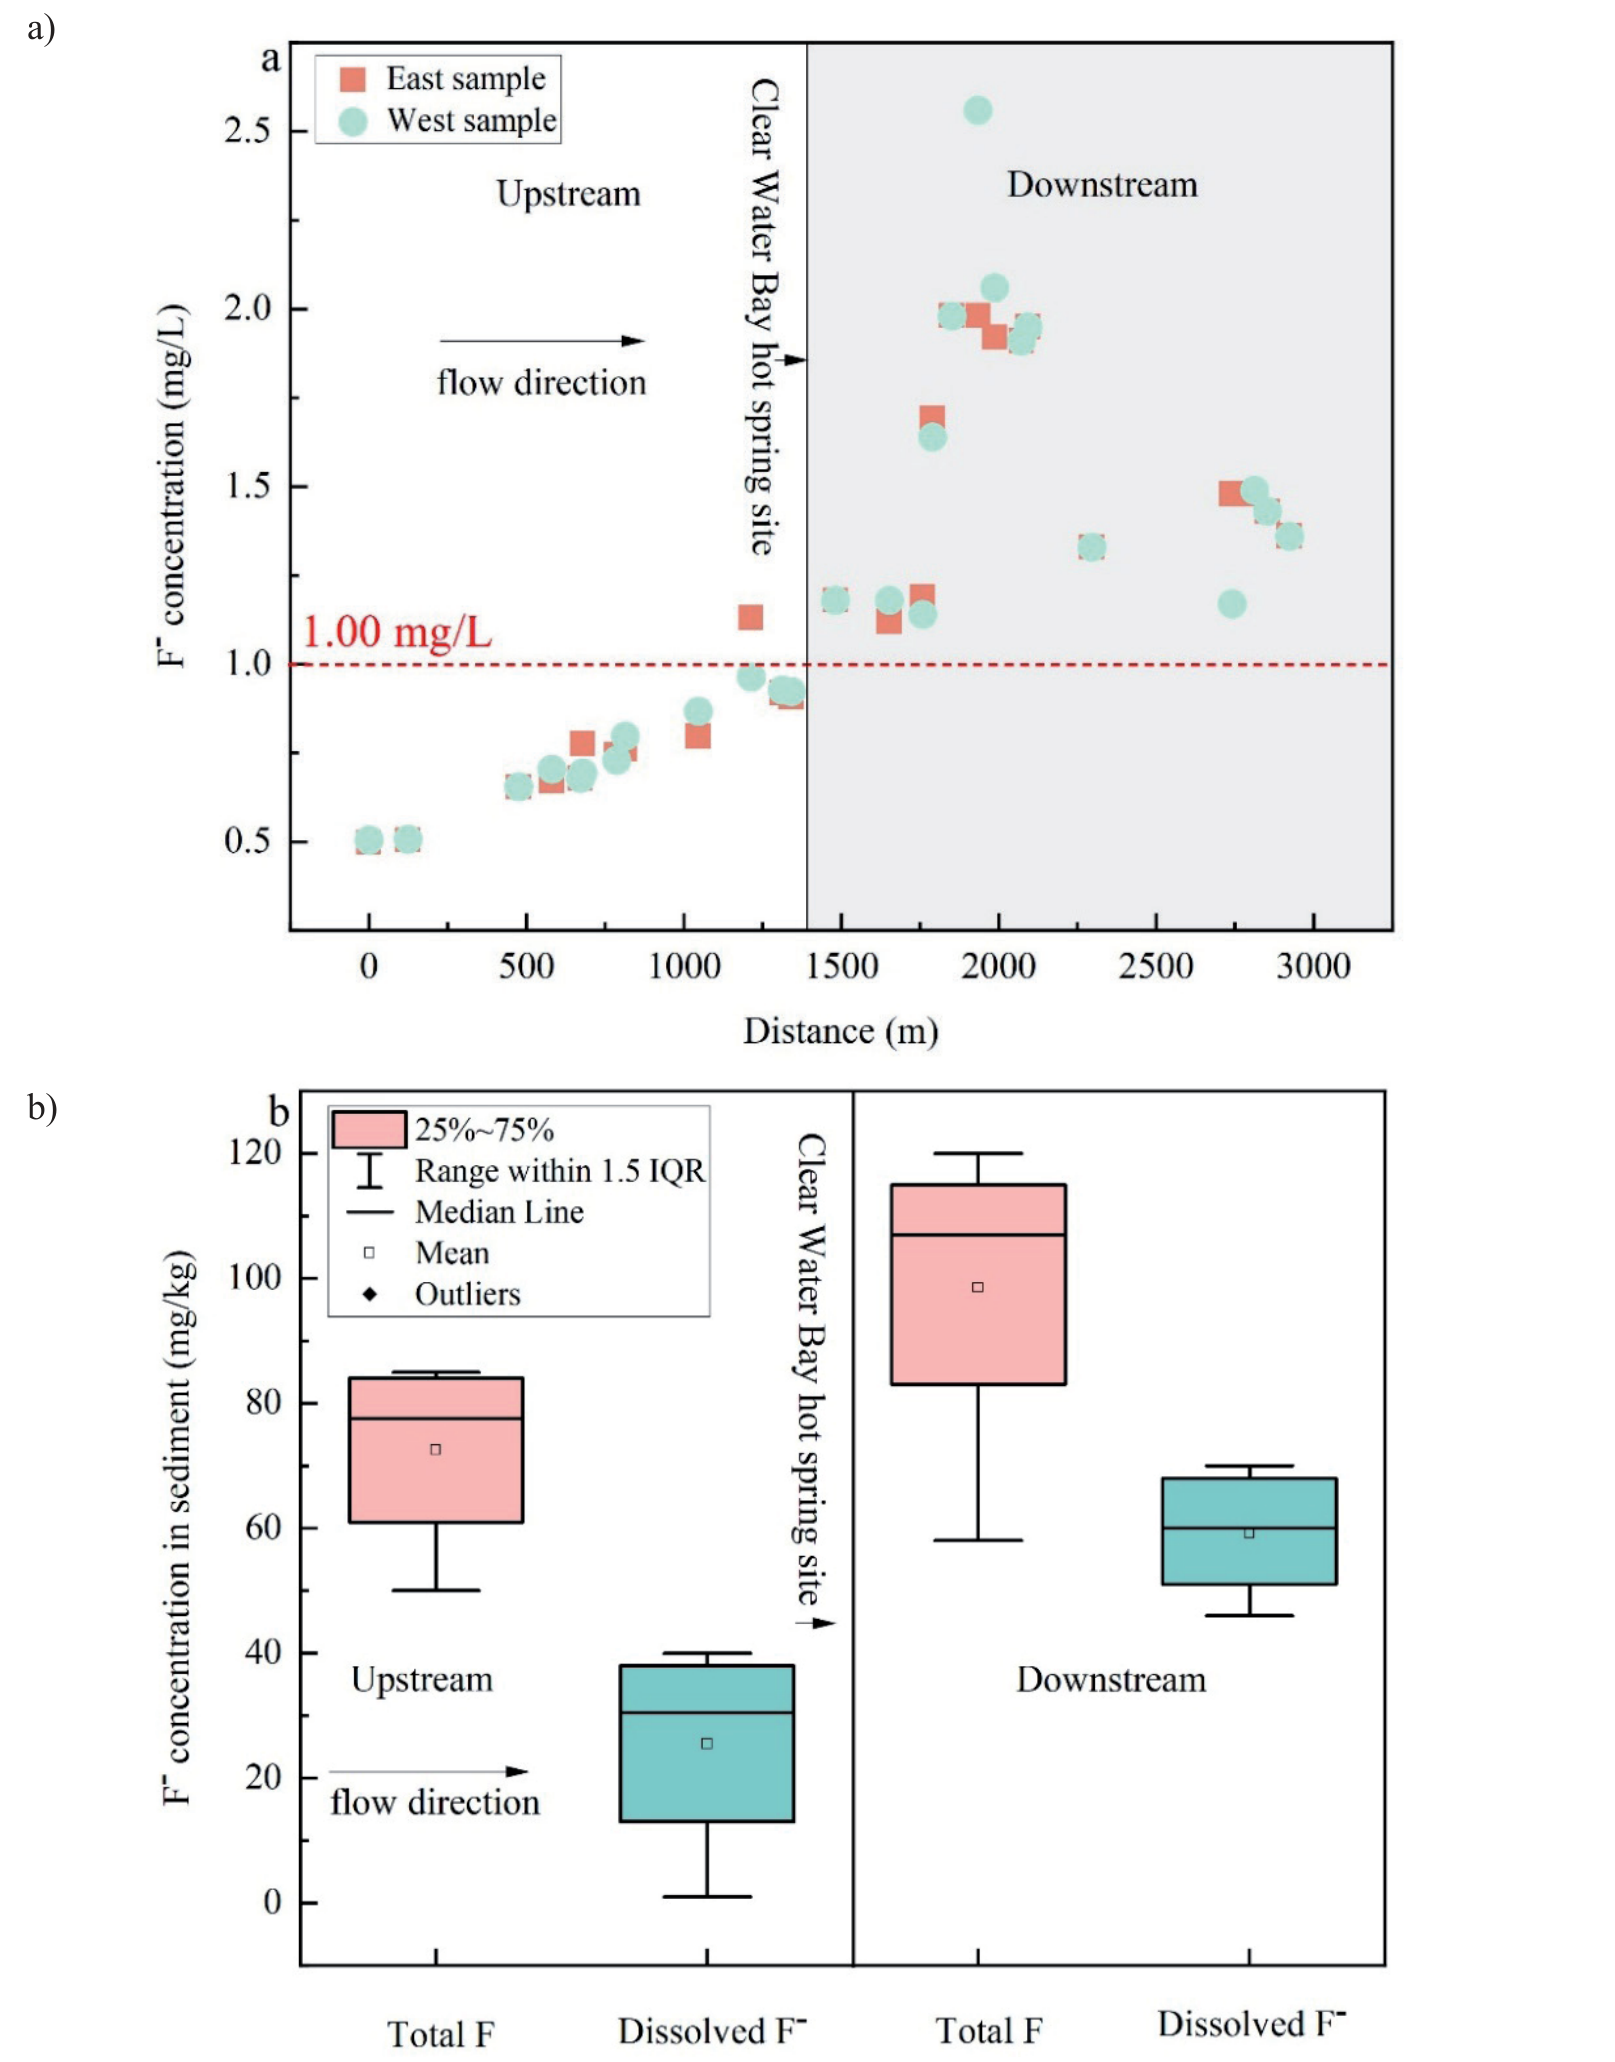
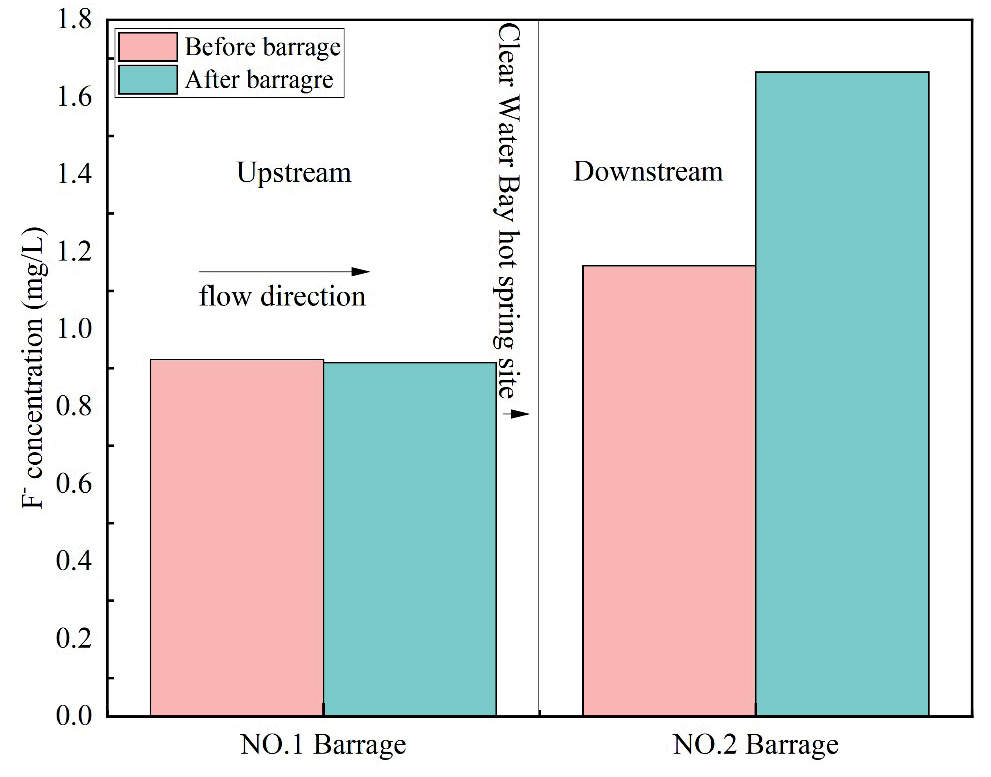
Fig. 4 shows the influence of river damming on the F⁻ concentration of surface water upstream and downstream of Clear Water Bay hot spring. As can be seen from Fig. 4, there was no significant change before and after the river damming upstream of Clear Water Bay’s hot spring, indicating that the damming activities had little effect on the F⁻ concentration in low-F⁻ river water. However, the F⁻ concentration changed greatly before and after the river damming downstream of Clear Water Bay’s hot spring. Compared with before river damming, F-concentration in high-F⁻ river water markedly increased by 42.92% after damming rivers, suggesting that damming activities may contribute to increased F- concentrations. This fact may be related to the slowing of water flow after river damming, the increase of sediment, and the enhancement of the water-rock interaction process.
Discussion
Dissolution/Precipitation of F-bearing minerals process
When CO2 and H2O enter river water, the silicate rock dissolves and produces HCO3⁻ (Eq. (1)), promoting the dissolution of fluorite and continuously releasing F⁻ into the river water. Meanwhile, based on Equations (2) and (3), a high concentration of HCO3⁻ could also promote the precipitation of calcite (CaCO3) and dolomite (CaMg(CO3)2), thus consuming the concentration of Ca2+ in the water and resulting in F⁻ constantly leaching from F-bearing minerals.
As shown in Fig. 5a), when the content of Ca2+ increases, the F⁻ content will decrease. The more rapid the rise in the Ca2+ content, the more accelerated the reduction in the F⁻- content. However, the high-F⁻ river water can be divided into two groups. Some high-F⁻ river water samples were distributed around the fluorite dissolution saturation line (Ksp [CaF2] = 10-10.6), suggesting that the dissolution of F-bearing minerals had an overwhelming influence on the elevated F⁻ concentration in river water. In contrast, the other high-F⁻ river water samples deviated from the fluorite dissolution saturation line, indicating that those samples appeared to have other F⁻ sources.
Fig. 5.
Plots of: a) Relationship between Ca2+ and F- concentrations; b) Relationship between SIcalcite and SIfluorite; c) Relation between SIdolomite and SIfluorite in river water.
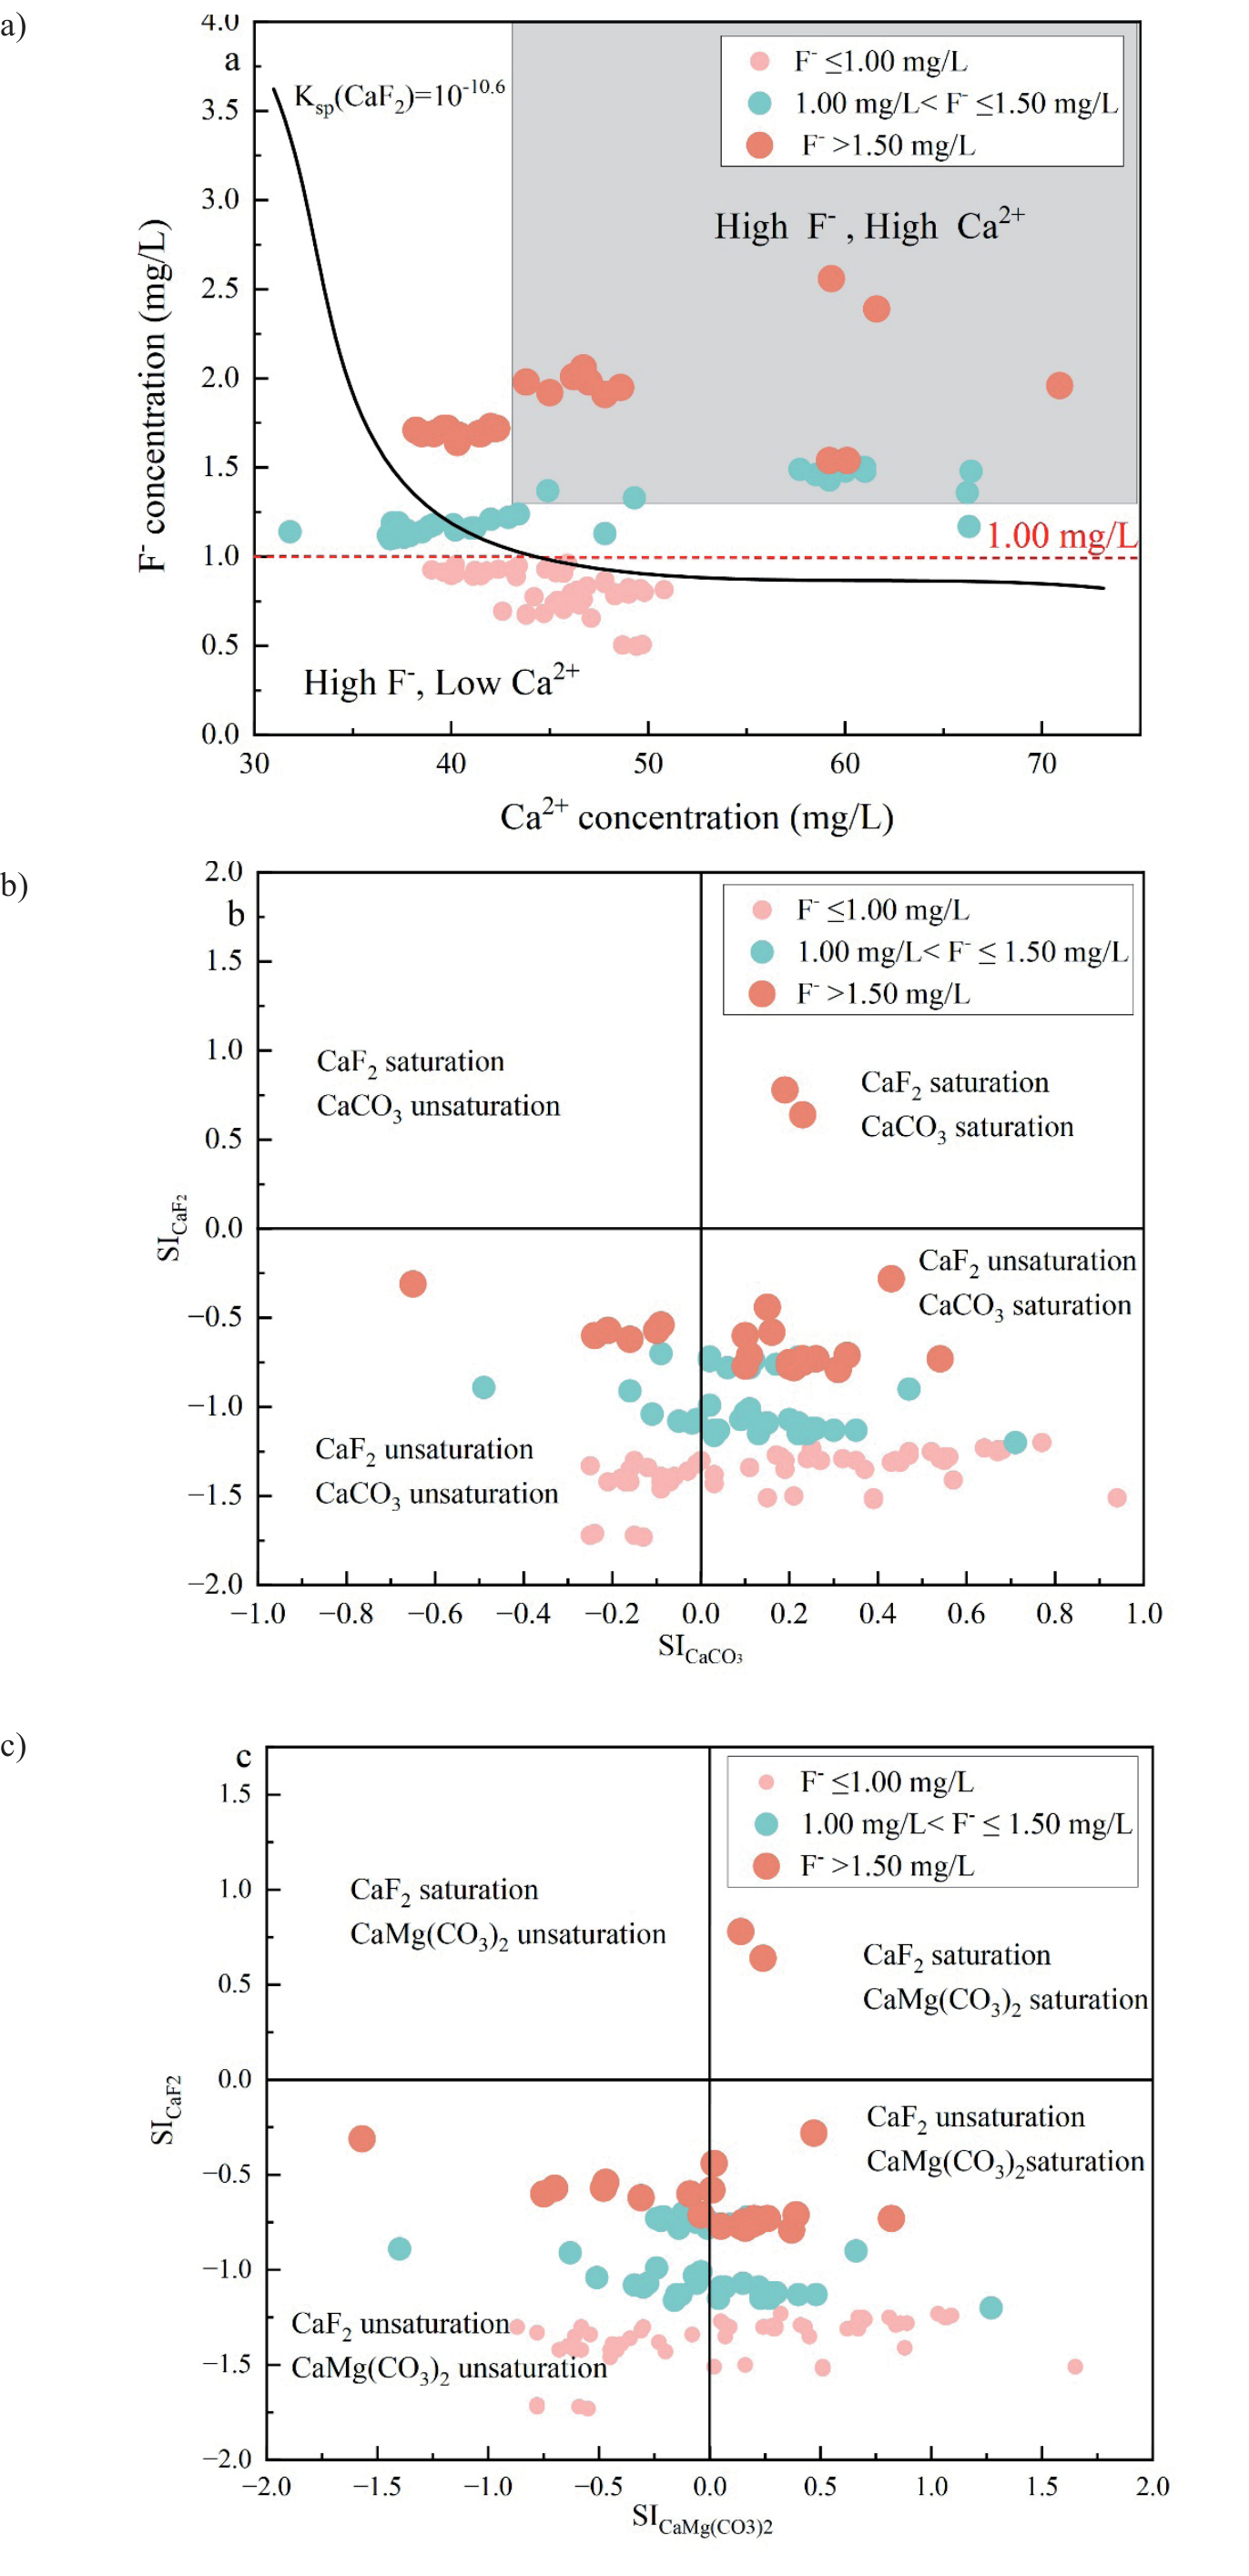
As can be seen in Fig. 5b) and 5c), the SI values of 80.00% calcite and 77.14% dolomite in the high-F⁻ river water were greater than 0, indicating that the dissolution saturation of calcite and dolomite contributed to the increase of F⁻ concentration in the river water [30, 31]. The results mainly contributed to the control of dissolution saturation after F-bearing mineral saturation. The reduction of Ca2+ concentration further promoted the dissolution of the F-bearing minerals and generated an elevated F⁻ concentration in river water. The SI values of fluorite in almost all river water samples were less than 0, indicating that fluorite was not saturated. This indicates that fluorite dissolution played a significant role in leaching F⁻ into the river water.
Previous studies have widely acknowledged that the sources of fluoride in river water include the dissolution of F-bearing minerals and air pollution [32-34]. In this study, we propose that soluble fluoride in historical hot spring sediments also constitutes a significant source of fluoride in river water. This finding offers a novel perspective for investigating fluoride sources globally.
Evaporation Effect
The influence of the evaporation effect on groundwater fluoride has been widely documented globally [35-37]. The elevated TDS could increase the solubility of F-bearing minerals in river water [38, 39]. The Gibbs diagram could be used to analyze the formation process of river water chemical composition, which was generally considered to be divided into three zones: evaporation concentration, rock weathering, and atmospheric degradation zones. As can be seen in Fig. S5a), almost all river water samples were scattered in the evaporation and concentration and rock weathering zones, indicating that the chemical formation of river water was mainly affected by rock weathering and evaporation and concentration. Almost all the river water samples were located at the dissolution zone of F-bearing minerals, which provided strong evidence that the dissolution of F-bearing minerals was the key factor that increased the F⁻ concentration in the river water. With the increase of F⁻ concentration, the sample points of river water moved from the rock weathering area to the evaporation and concentration area, indicating that the contribution of evaporation and concentration to the increase of F⁻ concentration cannot be ignored.
The ratio of F⁻/Cl⁻ was also helpful in distinguishing the effects of weathering dissolution and evaporation of geological minerals on the concentration of F⁻ in river water. As shown in Fig. S5b), all the samples of river water were distributed near the dissolution and geological origin of F-bearing minerals. The F⁻/Cl⁻ value of the high-fluoride water was higher than global unpolluted rainfall (F⁻/Cl⁻ = 0.02) and deviated from the evaporation effect, further indicating that the dissolution of F-bearing minerals and geological origin mainly controlled the F⁻ concentration of river water.
Cation Exchange
The chlor-alkali index (CAI1 and CAI2) proposed by Schoeller was used to characterize the direction and intensity of ion exchange [40]. According to Fig. S6, the CAI of all high-F⁻ river water samples were negative, indicating that Ca2+ and Mg2+ in river water were exchanged with Na+ and K+ in sediments, which increased the concentration of Na+ in river water and promoted the dissolution of F-bearing minerals [41].
The high-F⁻ river water samples were automatically divided into two groups: one was located near the position of CAI approaching 0 (zone B), and the other had the larger absolute values of CAI1 and CAI2 (zone A). The absolute value of the CAI of the high-fluorine river water samples distributed in zone A increased with the increase of F⁻ concentration, showing a strong ion exchange process, which led to the increase of F⁻ concentration [42]. The absolute value of the CAI of the high-fluorine river water sample in area B decreased with the increase of F⁻ concentration and approached zero, suggesting that ion exchange was weaker. This fact reflected that these samples had other F⁻ sources that led to increasing F⁻ concentration.
Competitive Effect
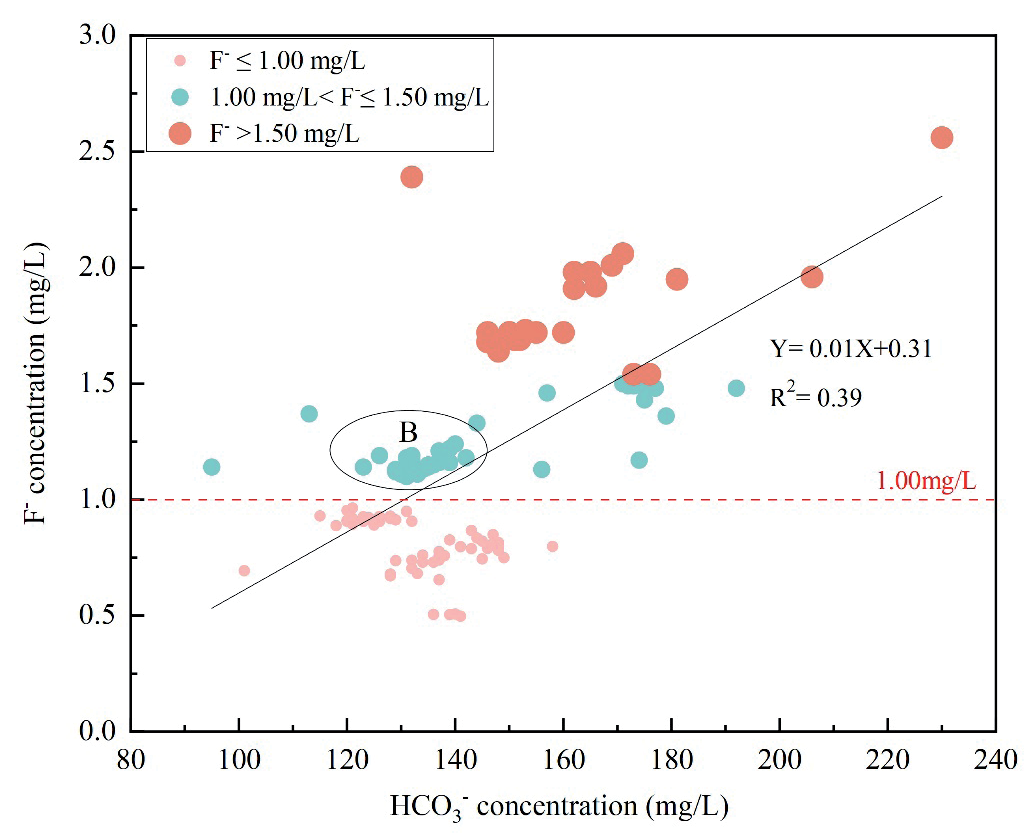
The F⁻ concentration in high-F⁻ river water had a moderately positive correlation with the HCO3⁻ (R2 = 0.39), as shown in Fig. 6. This suggests that the adsorbed F⁻ on the surface of sediments may be released under high HCO3⁻ conditions [43]. The river water was mostly in an alkaline environment (Table 1), which favored solids with negatively charged surfaces that caused the desorption of F⁻. Consequently, the high HCO3⁻ concentration in the river water promoted the enrichment of F⁻ by reducing the number of available adsorption sites on river sediments [44-46]. The higher levels of HCO3⁻ in the river water exerted a more pronounced effect on F⁻ enrichment, indicating that the competitive adsorption between F⁻ and HCO₃⁻ is also significant in this study area.
HCO3⁻ was the dominant anion present, and the hydro-chemical facies were Ca-Na-Mg-HCO3-SO4 type and Ca-Na-HCO3-SO4 type in river water, indicating that the competitive effect increased in river water and significantly elevated the F⁻ concentration. At the same time, upstream of the river damming, where the flow velocity slows, and the water level rises, aquatic plants (such as algae) began springing up, resulting in DOM enrichment (Table 1). The concentration of CO2 and O2 in the river water rapidly increased due to respiration and photosynthesis processes, resulting in HCO3⁻ concentration enrichment. The increasing HCO3⁻ concentration could reduce the available adsorption sites of the sediments and lead to the release of F⁻ from minerals into river water.
Agricultural and Domestic Activities
At present, the variation law of anthropogenic NO3⁻ and Cl⁻ concentrations is used to determine geologic origin and anthropogenic activities (such as fertilizers and wastes from domestic, agricultural, and industrial activities) [47]. As shown in Fig. S7a) and S7b), the correlation between F⁻ concentration and NO3⁻ and Cl⁻ concentration of high-F⁻ river water was weak, and the NO3⁻ concentration in 97.27% river water samples was lower than the pollution limit (5.00 mg/L), indicating that agricultural and domestic activities had minimal impact on the further enrichment of F⁻ in river water.
This observation contradicts our hypothesis that additional F⁻ would be released into river water with high NO3⁻ concentrations compared to that with low NO3⁻ concentrations, given the lack of natural nitrate sources in river water. Previous studies have also shown that fluoride enrichment in river water can be facilitated by bioleaching and/or direct fluoride input during the infiltration of artificial fertilizers [48]..
Formation Mechanisms
Under the control of the geological background, the F⁻ concentration in river water upstream of Clear Water Bay hot spring was lower than 1.00 mg /L. The F⁻ in the downstream river water of Clear Water Bay hot spring initially originated from the hot spring’s historical activities through high-F⁻ wastewater discharge, resulting in large amounts of high-F⁻ minerals accumulating in river sediments. Soluble fluorides can be easily released from river sediments, providing a material basis for forming high-fluorine water in this area. Hence, high-F⁻ minerals enriched in river sediments slowly dissolved when CaF2 was undersaturated. This resulted in a vertically decreasing variation of F⁻ concentration in water bodies from the bottom to the surface. At the same time, Na+ in the surrounding sediments was exchanged with Ca2+ in the water body, resulting in increased Na+ and K+ and lower Ca2+ concentrations in river water, respectively. The increased Na+ and K+ concentrations reduced the repulsive potential between the positively charged sediment surface and the negatively charged anions at alkaline pH, facilitating F⁻ desorption into river water. Meanwhile, lower Ca2+ conditions favored fluorite dissolution, increasing the F⁻ concentration in the river water.
After the local government implemented river damming in the upper reaches of Clear Water Bay hot spring from 2015 to 2016, the flow velocity slowed, the water level increased, and the sediment grew downstream of Clear Water Bay hot spring. The dissolution of more F-bearing minerals was helpful for F⁻ enrichment in river water. At the same time, the higher HCO3⁻ concentration generated through the respiration and photosynthesis process of aquatic plants brought a stronger competitive effect with F⁻ on available adsorption sites of sediments and facilitated the release of F⁻ desorption into river water.
Conclusions
In this study, the fluoride concentrations in river water exhibited an inverse relationship with the distance of water flow as it passed through the Clear Water Bay hot spring, proving that the exploitation of the hot spring may contribute to fluoride contamination in downstream waters. The high-F⁻ river water initially originated from the dissolution of hot spring historical sediments containing large amounts of bearing-F⁻ minerals. At the same time, Na+ on the surrounding sediments was exchanged with Ca2+, facilitating F⁻ desorption into river water and favoring fluorite dissolution, increasing F⁻ concentration in the river water. When the local government implemented river damming, more HCO3⁻ concentration generated through the respiration and photosynthesis process of aquatic plants brought a stronger competitive effect with F- on available sediment adsorption sites and also facilitated the release of F⁻ desorption into river water.
This study aims to provide novel insights into determining the distribution and genetic mechanisms of high-F⁻ river water downstream of hot springs, offering a scientific foundation for enhancing water quality and identifying high-quality irrigation water resources. Therefore, future research should focus on improving the assessment of risks associated with high-F⁻ irrigation water and fluoride pollution in surrounding groundwater and soil.

