

Introduction
Ecosystem functions and benefits are important components of the Earth’s life support system [1]. However, in recent years, a series of ecological and environmental concerns have been caused by the contradiction of human-land relationship; economic globalization and population expansion have gradually become an important topic of concern for various countries and organizations and have also been one of the hot spots in the study of global ecosystem structure. With the rapid development of China’s social economics, the expansion of construction land is inevitable, which has a profound impact on the evolution of natural ecology and the structure of land cover [2]. These changes reflect, to some extent, human shaping of the Earth’s natural environment, which would lead to a decline in the overall habitat quality or fragmentation of the landscape. Thus, habitat quality is the prerequisite and basis for all ecosystem functions and services [3]. It is of great significance to study the spatiotemporal variation of habitat quality and its influencing factors for the maintenance of ecosystem balance and sustainability.
In much of the early literature on habitat quality, the direction mainly focused on individual rare species habitats or ecosystem evolution based on regional species diversity criteria. Some scholars evaluated habitat quality by the proportion of local endangered species and habitat selection [4-6]. However, with the development of urbanization and the increase in population, the continuous expansion of human activities has destroyed natural habitats, which has led to habitat fragmentation and degradation [7-9]. Nevertheless, only based on regional biodiversity as an evaluation index of the overall habitat quality could not comprehensively reflect the integrity of the quality of the regional ecosystems, and this approach has ignored the level of diversity of ecosystem functions. In the follow-up studies, some scholars found that different land types have great differences in positive and negative impacts on habitat quality [10, 11]. Therefore, appropriate human intervention would promote habitat restoration and habitat quality improvement to a certain extent [12, 13].
When regional habitat quality studies are conducted, rare species should be incorporated into the evaluation system, and scholars should pay attention to structural changes in land use. At the same time, the internal correlation between structural changes in land use and the evolution of regional habitat quality should be clarified.
After summarizing the current studies on the correlation between habitat quality and regional land use and biodiversity, it was found that researchers preferred areas with a high convergence of vegetation or animal species in the selected study areas, such as the Dabie Mountains in western Anhui Province [14], the Tibetan Plateau region [15], coastal wetlands [16], and other natural reserves [17]. The ecosystem types in these regions are very different, and the evolution direction of habitat quality is different too. Among numerous ecosystem types, river ecosystems are the most unique, which is because the water resources they contain provide important support for the structural integrity of regional ecosystems [18]. Besides, human activities around river basins are active with high intensity of development, which leads to the fragmentation of the landscape around the river basin and has an impact on the habitat quality of the whole region. Therefore, many scholars have carried out studies on habitat quality at the basin scale. One is to evaluate the habitat quality by obtaining river water quality indexes and aquatic biological abundance indexes through a large number of field investigations [19-21], and the other is to analyze the habitat quality changes in different regions of the basin from the perspective of land use temporal and spatial evolution [22, 23].
At present, the models for habitat quality assessment mainly include the GUMBO model [24], the MAXENT model [25], and the SolVES model [26], In the existing research, scholars preferred to use the InVEST model [27], which has the greatest advantage of showing the nature of ecological and environmental problems spatially in a quantitative way [28]. Therefore, some scholars have carried out more adaptive model improvement and application studies based on the existing modeling methods. By using the improved INVEST model, they analyzed the spatiotemporal variation characteristics of habitat quality of different land use types, including urban ecosystem function assessment [29] and the spatiotemporal variation characteristics of watershed habitat quality [30]. However, habitat quality assessment cannot directly show the impact of local land use structural differences on habitat quality and quantify the internal correlation between land types and habitat quality. In recent years, with the development of geographic information technology based on local spatial regression, the geographically weighted regression (GWR) model coupled with geographical elements and regression analysis has been gradually applied to regional ecological environment quality assessment [31, 32]. The GWR model can well reflect the influence characteristics of dependent and independent variables in local space. Over the years, this model has been widely used in geography-related spatial and temporal analysis studies. However, this method has not been widely used in the field of habitat quality assessment of the ecological environment. Therefore, based on the above methods, this study would make up for the shortcomings of current relevant studies.
Although habitat quality assessment has been widely used on a basin scale, there have been few studies on habitat quality in the areas along the Yangtze River. The Yangtze River Delta is one of the most developed, dynamic, densely populated, and industrially concentrated areas in China and plays an important role in China’s economic and social development [33, 34]. The area has experienced rapid economic development and significant structural changes in land use. The area of the Yangtze River in Anhui Province is an important ecological green screen area in the middle and lower reaches of the Yangtze River, with important wetlands such as Shengjin Lake and Chaohu Lake. It is also an important wintering and breeding ground for dozens of nationally endangered wildlife species in China, such as the Chinese alligator (Alligator sinensis) and hooded crane (Grus monacha) [35], and also a key node and wintering ground on the migration route of East Asian-Australasian Flyway (EAAF) [36]. However, the continuous development of regional land use has led to constant changes in the regional ecological environment, which has gradually attracted the attention of the local government and relevant scholars [37].
Therefore, this study comprehensively used the land use data of the study area from 1990 to 2020 and selected the InVEST model and geographically weighted regression (GWR) model to focus on the relationship between spatiotemporal distribution changes of habitat and land use type in the study area. The following scientific issues will be addressed: (1) What were the spatiotemporal evolution characteristics of land use and habitat quality in the study area? (2) What was the response of habitat quality change to land use structure? Addressing the above scientific issues would help researchers to clarify the inner link between the change in land use structure and the spatiotemporal change of habitat quality in the study area. The study results would provide the main data reference for the management of ecosystem structure in the study area. Meanwhile, the scientific issues that this study focused on would also provide important literature for the maintenance and improvement of biodiversity levels in the area of the middle and lower reaches of the Yangtze River.
Materials and Methods
Study Area
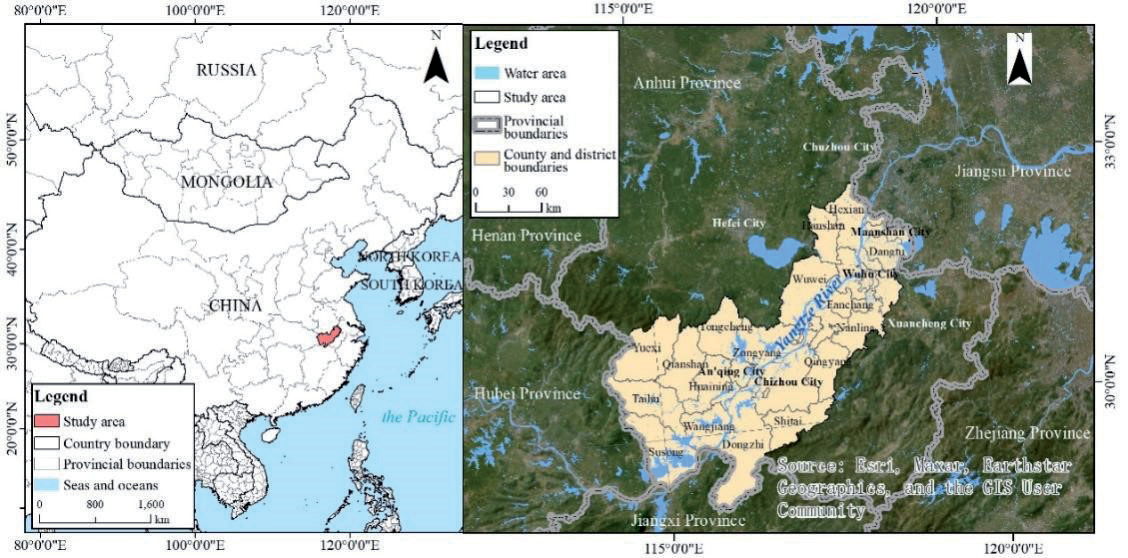
The middle and lower reaches of the Yangtze River are important grain, oil, and cotton production bases in China and also the most abundant water resources in China. The numerous natural advantages of freshwater lakes not only have the ecological function of regulating water volume and delaying flood peaks, but also have the functions of irrigation, shipping, and breeding. Anhui Province is located in the western part of China’s “Yangtze River Delta” economic circle. In recent years, the rapid economic development of the Yangtze River Delta has driven the steady improvement of Anhui Province’s economy. The western part of the middle and lower reaches of the Yangtze River selected for this study is mainly located in the Anhui section of the Yangtze River Basin, which is located at 116°35´E~119°21´E and 29°31´N~32°26´N with a total area over 30000 km2 (Fig. 1). It is one of the regions with the highest level of biodiversity and an important ecological conservation area in the Yangtze River Delta economic zone [38]. From the perspective of ecosystems, the area is rich in natural resources, including waterpower, forests, wetlands, and biological and mineral resources. It is also the core area for the construction of ecological green screens in the middle and lower reaches of the Yangtze River [39, 40]. From the perspective of man-land relationship, this area has a long history and is the main producing area of rice and wheat in the middle and lower reaches of the Yangtze River. From the perspective of urban development, the development speed of towns along the river is fast, and the contradiction between urban land supply and demand, urban development, and regional ecological function maintenance is becoming increasingly prominent.
Data Source and Processing
The land use data of the study area included the years 1990, 2000, 2010, and 2020, which were obtained from the Data Center for Resources and Environmental Sciences, Chinese Academy of Sciences (https://www. resdc.cn) with a spatial resolution of 30 m. According to the GB/T21010-2017 “Classification of Land Use Status” system, the land use data was divided into 17 second categories (Fig. 2), and the data coordinate system was converted into the WGS_84_Albers projection coordinate system.
Single Land Use Dynamic Index
The dynamic index of a single land use type expresses the quantitative change of a certain land use type within a certain time range in a certain research area [41] and can quantitatively describe the speed of regional land use change. The calculation formula is as follows:
where LC is the dynamic index of a certain land use type during the study period. Ua is the amount of a certain land use type at the beginning of the study period. Ub is the quantity of a certain land use type at the end of the study period. T is the length of the study period, and when the period of T is set as a year, LC is the annual change rate of a certain land use type in the study area.
InVEST Habitat Quality Model and Evaluation Process
The InVEST model simulates the impact of land cover on ecosystem service functions. Combined with land use scenarios, it can detect the potential changes in the supply of ecosystem service functions and the tradeoff between service functions at different geographic and socioeconomic scales [42]. To run the habitat quality module, five essential data need to be input, namely: land use/land cover data, threat factor table, threat source layer data, habitat type, habitat type sensitivity table to threat factor, and half-saturation coefficient.
The InVEST model suggests that the higher the habitat quality, the higher the corresponding biodiversity and the more stable the ecosystem [43-45]. Therefore, in this study, land use type data in the study area were used to determine and describe the response degree of different habitat types to threat sources and obtain habitat distribution characteristics. The formula for the habitat quality index is as follows:
where Qxj is the habitat quality index of the grid x in the land use type j, between 0 and 1; Hj is the habitat suitability of the land use type; Dxj is the degree of habitat degradation of the grid x in the land use type j; k is the half-saturation coefficient; and z is the default parameter of the model, which is a kind of normalization constant usually taken as the value of 2.5.
From Eq. (2), another important parameter affecting the calculation result of habitat quality is habitat degradation degree (Dxj), whose calculation formula is as follows:
where y is all grids of stress factors r; R is all degradation sources; Yr is a set of grids of stress factors r; wr is the weight of normalized stress factors r, between 0 and 1; ry is the value of the stress factor r of the grid y; irxy is the accessibility level of the grid x; βx is the accessible level of the grid x; Sjr is the sensitivity of land use types j to stress factors r. The calculation formula of irxy is as follows:
Table 1.
Threat factors weight and influence distance.
In Eqs (4) and (5), drmax is the maximum impact distance of habitat stress factors r; dxy is the linear distance between the grid x and y.
In this study, based on the existing literature [32, 46], this study referred to the user manual of the InVEST model and the current situation of habitats in the study area and set parameters such as the maximum impact distance and weight of each threat factor and the sensitivity of habitat type to the threat factor (Table 1 and Table 2). Its value range was 0~1. Land use/land cover data from 1990 to 2020 were sourced from the Resource and Environmental Science and Data Center of the Chinese Academy of Sciences (https://www.resdc.cn/) (Fig. 2).
To clearly understand the spatiotemporal variation of habitat quality in the study area, the results of habitat quality assessment were divided into five grades according to the criteria of lowest (0~0.2), low (0.2~0.4), middle (0.4~0.6), high (0.6~0.8), and highest (0.8~1.0) [47].
Barycenter Model
The barycenter model is an important analytical tool to study the spatial changes of factors in the process of regional development. As regional development is a process of aggregation and diffusion of elements, the position of the center of gravity of each element is constantly changing, and the movement of the center of gravity of each element reflects the spatial trajectory of regional development [48]. This study measured the center of gravity in different years based on the InVEST Habitat Quality Index in the study area from 1990 to 2020 to reveal the direction of migration of high and low habitat quality during this period.
where (X, Y) is the coordinates of the geographic center of gravity for a given year, (Xi, Yi) is the coordinates of the location of the habitat quality in region i, and Pi is an index of the habitat quality in region i.
Geographically Weighted Regression Model
The geographically weighted regression (GWR) model is widely used in the analysis of spatial heterogeneity of geographic elements. The GWR model is an extension of the ordinary global regression model, which incorporates spatial characteristics of the data into the model in a distance-weighted way [49]. The model’s formula is as follows:
Table 2.
Sensitivity of habitat types to threat factors.
where yi and xi1, xi2, ..., xip are dependent variables and explanatory variables x1, x2, ..., xp is the measured value at the location; a coefficient βj(μi, vi)(j = 1, 2, ..., p) is an unknown function of spatial position; εi(i = 1, 2, ..., p) is an error term with a mean of 0 and a variance of σ2. The model parameters βj(μi, vi)(j = 1, 2, ..., p) is location dependent and are usually estimated locally using the weighted least square method. The weight is generally determined by the latitude and longitude coordinates of the observed values, and the weight at each position (ui, vi) is a function of its distance to other observation points.
The weighting function is calibrated using an adaptive method, and the Bandwidth Parameter method is used to determine the bandwidth. The weighting function is as follows:
where b is the bandwidth of the baseband; dij is the point (ui, vi) to point (uj, vj) distance.
To identify the spatial response pattern of land use change and habitat quality evolution, the spatial distribution map of habitat quality and land use type map of the basin were transformed into 1km×1km raster data, and the GWR module tool in Arc GIS 10.4 was used to take the value of the change in habitat quality as the dependent variable. According to the land use data over the years, it was found that the area of paddy land, forest land, dry land, and construction land accounted for more than 75% of the whole study area. Therefore, this study chose the above four types of land use as explanatory variables. The changes in the area of the above four land types and the changes in the habitat quality index were counted in each raster, and the geographically weighted regression model was used to analyze the spatial correlation between the land use change and the habitat quality index in the four periods and to explore their spatial and temporal differentiation characteristics.
Results
Land Use Change
According to the changes in land use distribution (Fig. 2), the main land use types in the study area were paddy land and forest land, and the area of two land types accounted for more than 65% of the study area. The area proportion of each land use type in the study area remained stable in the four periods. The difference was that the area of farmland decreased from 16702.61 km2 to 15474.69 km2, with a proportion decrease of 2.94%; the area of forest land decreased from 10563.92 km2 to 10466.23 km2, with a proportional decrease of 0.28%. The area of grassland decreased from 3191.89 km2 to 3162.02 km2, with a proportional decrease of 0.09%. The area of water increased from 2610.93 km2 to 2668.08 km2, with a proportional decrease of 0.17%. The area of construction land increased from 177.94 km2 to 630.62 km2, with a proportional increase of 1.330%; the other land increased by 644.13 km2, accounting for 1.84%.
From the perspective of spatial distribution, the expansion of the construction land was obvious, which was concentrated along the Yangtze River, Maanshan City, Wuhu City, and Tongling city center.
According to the land use transfer matrix (Table 3), from 1990 to 2020, the area of transfer in of water area, construction land, and other land in the study area was larger than that of the transfer out. On the contrary, the area of the transfer out of grassland, dry land, forest land, and paddy land is larger than that of the transfer in. Among them, the largest area of transfer out was farmland (paddy and dry land), with 16702.09 km2 transferred out, which mostly transferred to the construction land with an area of 391.73 km2. While forest land had a total of 10562.24 km2 transferred out, with 148.93 km2 and 78.46 km2 transferred to paddy land and grassland, respectively.
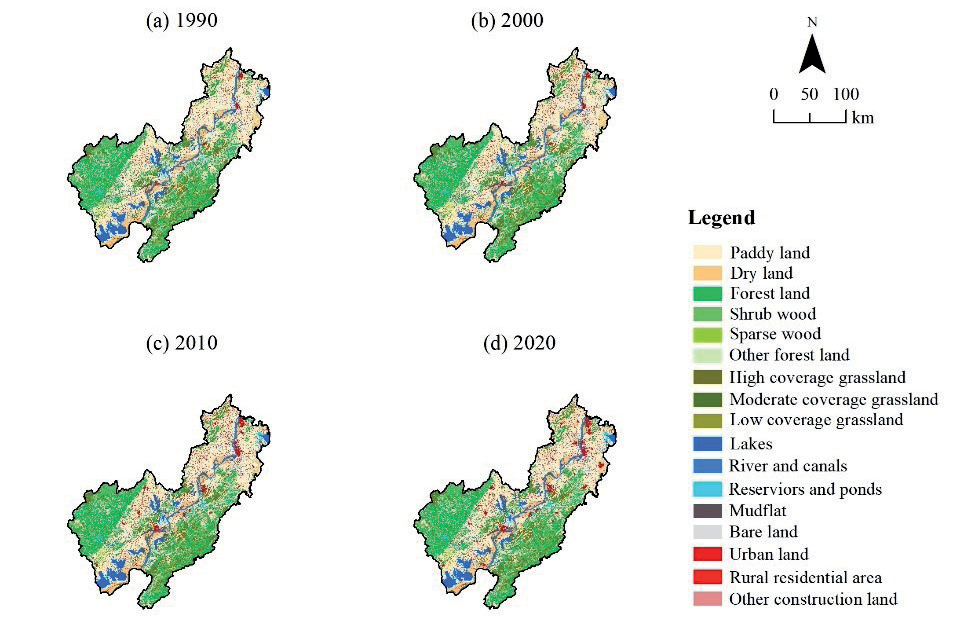
Table 3.
Land use transfer matrix in 1990 and 2020 in the study area (Unit: km2).
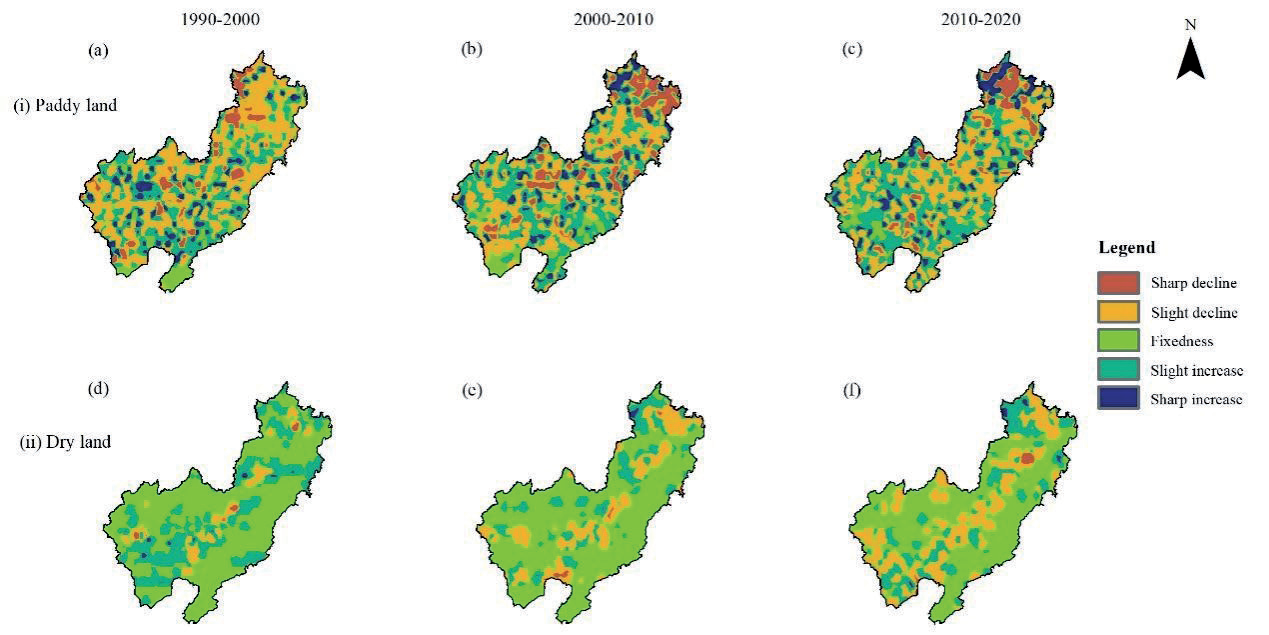
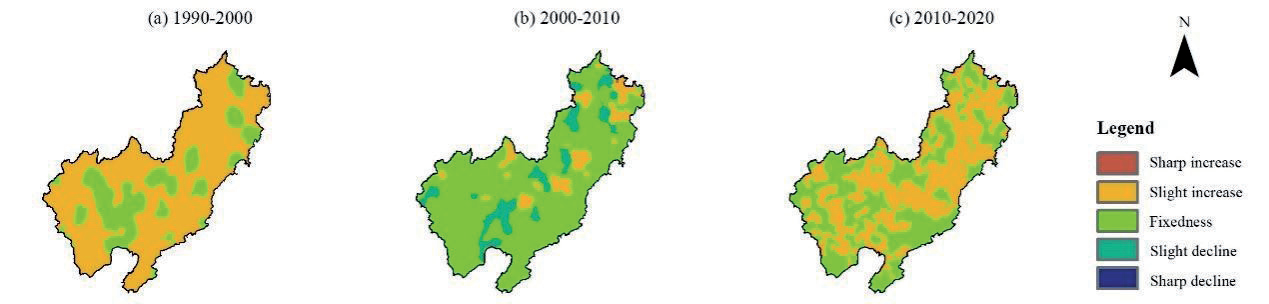
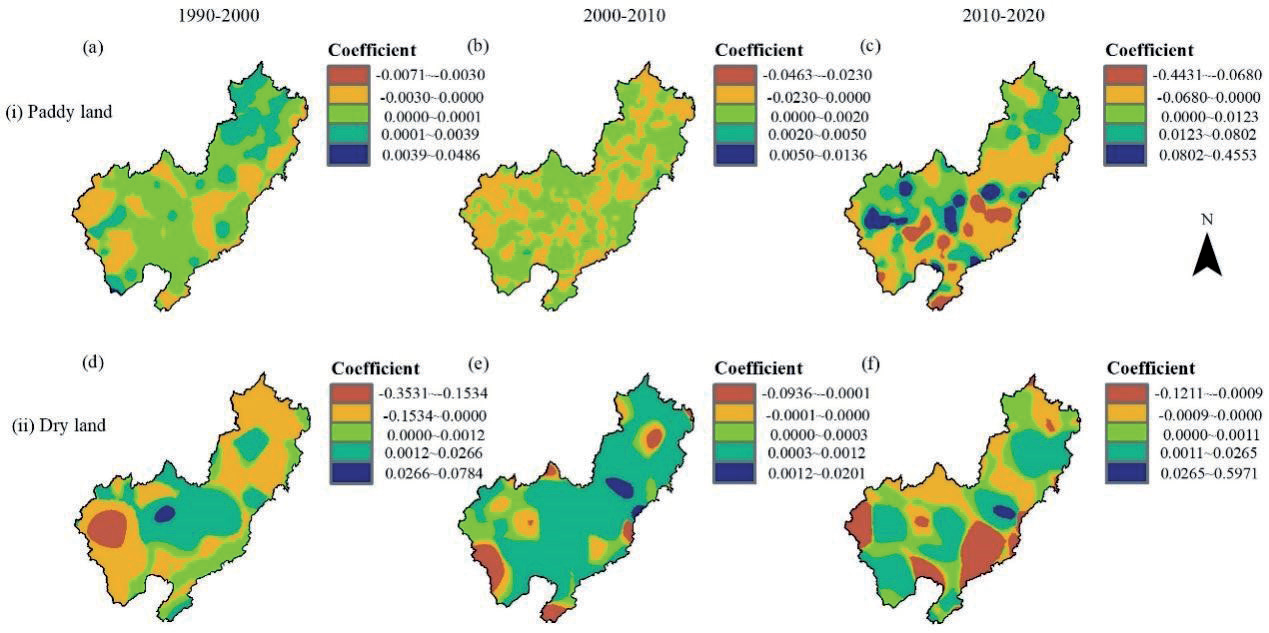
According to the spatiotemporal change rates of paddy land and dry land in the study area (Fig. 3), from 1990 to 2000, the area with a sharp decrease in paddy land area change rate expanded significantly in the southwest of the study area (Anqing City). From 2010 to 2020, the area where the change rate of paddy land area decreased sharply gradually spread from the middle to the northeast of the study area and mainly concentrated in the northeast of the study area. The area change rate of the dry land was relatively stable from 1990 to 2020, but during 2000-2020, the decrease of dry land was mainly concentrated along the Yangtze River and gradually spread to other areas.
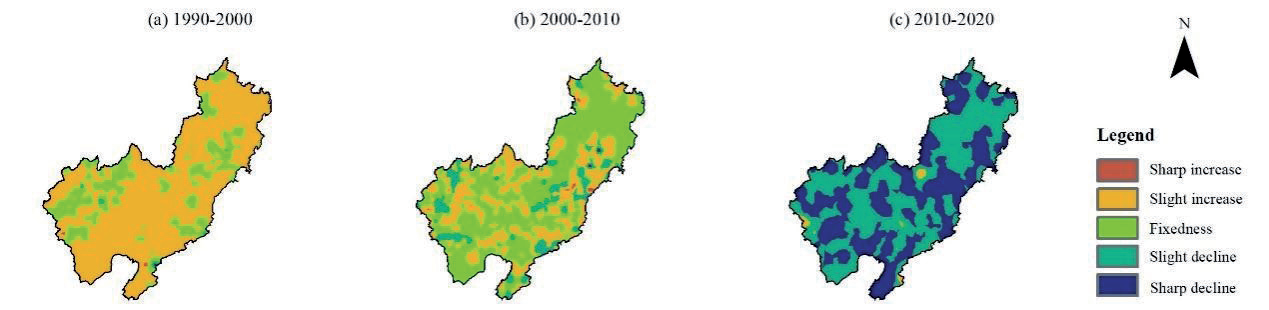
Based on Fig. 4 and Fig. 5, before 2010, the area of forest land in the study area was relatively stable, but from 2010 to 2020, the area of forest land had a slightly decreasing trend. The area change rate of forest land in some areas was in the trend of sharp decrease. From 1990 to 2000, the area change rate of construction land in the study area was slightly increased. From 2000 to 2010, the development of construction land in the study area as a whole tended to stabilize, but the construction land along the Yangtze River and around the city was still expanding. During this period, the area with a slight increase in the area change rate of construction land began to spread. From 2010 to 2020, the area change rate of construction land was slightly increased, with a trend of fragmented patches spreading.
Analysis of Spatiotemporal Change of Habitat Quality
Spatiotemporal Differentiation of Habitat Quality
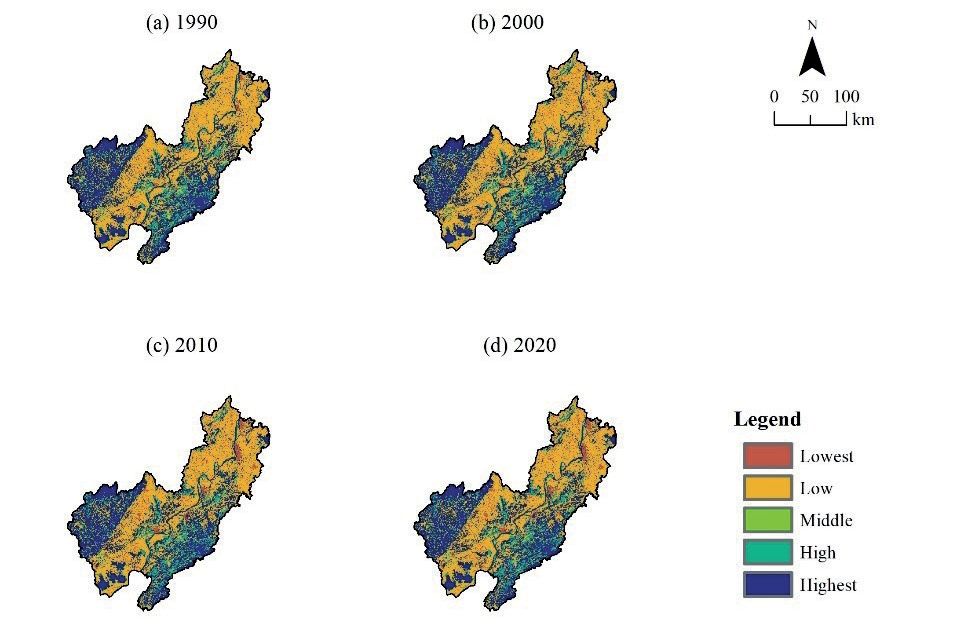
According to the operation results of the InVEST model (Fig. 6), the habitat quality in the study area showed a trend of low habitat quality in the north and high habitat quality in the south. Over time, from 2000 to 2010, the range of the highest-grade habitat quality in the southern part of the study area was generally stable. However, the low-grade and lowest-grade areas of habitat quality showed a spreading trend.
The habitat quality in the eastern regions along the Yangtze River near Ma’anshan City and Wuhu City showed a decreasing trend to varying degrees, which indicated that the study area was affected by factors such as land development in important cities and their surrounding areas. The trend of habitat quality deterioration was evident. By 2020, the habitat quality in the southwest and southeast areas of the study area was the highest. The habitat quality was middle or low grades in the middle and northern part of the study area, and the lowest grade was along the Yangtze River.
According to the area changes of each habitat quality grade (Fig. 7), from 1990 to 2020, the area of low-grade in the study area showed a decreasing trend year by year, with a decrease of 1028 km2. The proportion of lowest grade showed an increasing trend year by year, increasing by 1092.09 km2. The area proportion of high and highest grades of habitat quality was dynamically stable in each period; the area of high-grade habitat quality increased by 114.26 km2, and the area of high-grade habitat decreased by 177.40 km2.
According to the barycenter migration of the lowest and highest grades of habitat quality (Fig. 8), from 1990 to 2020, the center of gravity of the lowest grades shifted to the southeast, and the migration rate was relatively gentle, which indicated that the deterioration of habitat quality was mainly concentrated in the southeast direction. From 2010 to 2020, the center of gravity shifted rapidly to the southwest, and the migration rate was high, which indicated that the habitat quality deteriorated significantly in the southwest direction. Similarly, from 1990 to 2000, the center of gravity of the highest grade shifted to the northeast. From 2000 to 2020, the center of gravity shifted to the southwest, which showed that the spatial trend of habitat quality improvement was in progress in the study area.
Analysis of Habitat Quality Degradation Degree
According to the results of habitat quality degradation degree (Fig. 9), from 1990 to 2000, the areas with relatively high habitat degradation degree in the study area were distributed in the northwest, and the total habitat degradation degree was relatively low, with the degradation degree value remained around -0.305. From 2000 to 2010, the relatively high degree of degradation in the study area was distributed in the surrounding area along the Yangtze River and the northeast (around Maanshan City and Wuhu City), with the higher value of degradation degree being -0.298, and the degradation degree of most of the other areas was maintained at around 0.456, which indicated that the overall habitat quality in the study area showed a rising trend. The changing trend of habitat quality degradation degree from 2010 to 2020 was similar to that from 2000 to 2010. The area with obvious habitat degradation along the Yangtze River and in the northeast of the study area continued to expand, and the negative value of the degradation degree index became smaller, with the lowest degradation degree being -0.495. The degradation degree value of other areas remained around -0.121. The degradation trend of overall habitat quality in the study area was obvious.
Response Analysis of Habitat Quality to Land Use Change
According to the results of parameter estimation and test of the GWR model (Table 4), the value of R2 adjusted was greater than 0.79 from 1990 to 2020, which indicated that the GWR model had a better model fit in analyzing the local regression relationship between land type and habitat quality, which met the needs of this study.
According to Fig. 10, from 1990 to 2020, the relationship between paddy land and habitat quality was mainly positive, and the regression coefficient of most regions was positive, which indicated that paddy land had a significant promoting impact on habitat quality during this period. However, from 2000 to 2010, the situation changed greatly; the impact of paddy land on habitat quality was mainly negatively correlated, and negative areas were scattered across the whole region, with the main regression coefficient ranging from -0.0230 to 0.0000. From 2010 to 2020, the negative correlation area spread from the center to the south and north of the study area, with the lowest value of regression coefficient of -0.4431, and the positive correlation area was distributed in the northwest, with the highest value of regression coefficient of 0.4553. The above results indicated that the impact of paddy land on habitat quality in the study area from 2010 to 2020 showed a two-stage differentiation trend. The positive impact of paddy land on habitat quality in the southern area of the Yangtze River was obvious, while the negative impact of paddy land in the northern area of the Yangtze River was obvious.
Fig. 8.
Barycenter migration of the lowest and highest habitat quality in the study area from 1990 to 2020.
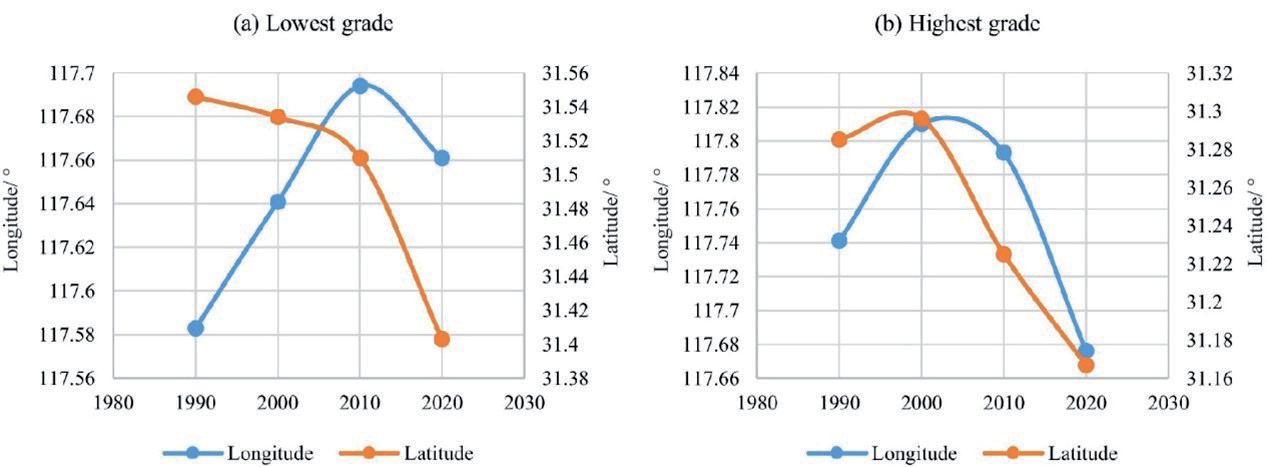
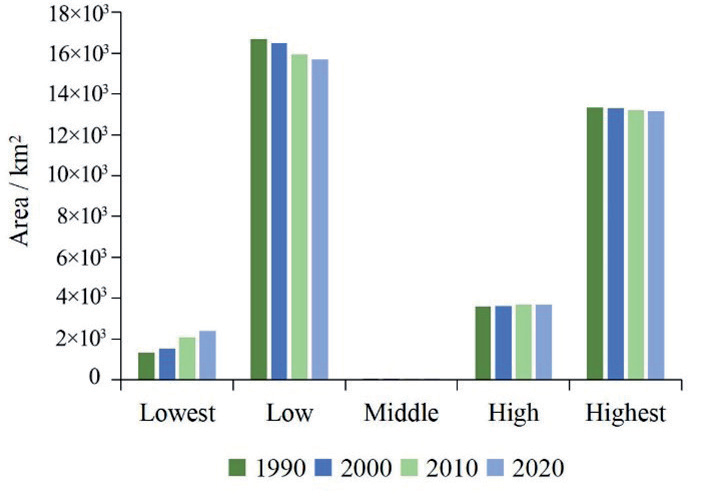
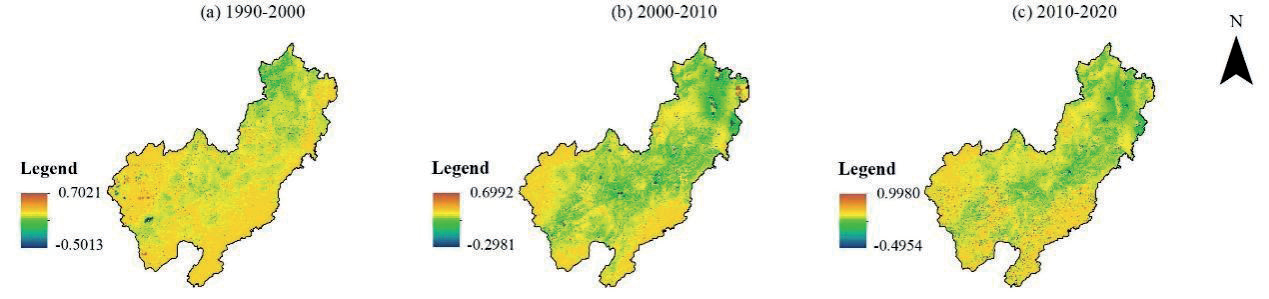
Table 4.
GWR model parameter estimation and test results.
From 1990 to 2000, the impact of dry land on habitat quality also showed a two-stage differentiation trend. From 2000 to 2010, the negative impact of dry land on habitat quality was mainly distributed along the Yangtze River, with the lowest regression coefficient of -0.0936. From 2010 to 2020, the impact of dry land on habitat quality was mainly negatively correlated. Compared with 1990 and 2010, the range of the negative correlation area was significantly expanded, with the lowest regression coefficient of -0.1211, which indicated that the area increase of dry land during this period had a negative effect on habitat quality in the study area.
According to Fig. 11, from 1990 to 2020, the impact of forest land on habitat quality was mainly positive, and the regression coefficient of most regions was positive, which indicated that forest land had a significant promoting effect on habitat quality during this period. From 2010 to 2020, the highest value of positive correlation between forest land and habitat quality began to be distributed in the middle and southern of the study area, with the highest value of regression coefficient of 0.6572, which indicated that forest land had a significant effect on habitat quality during this period.
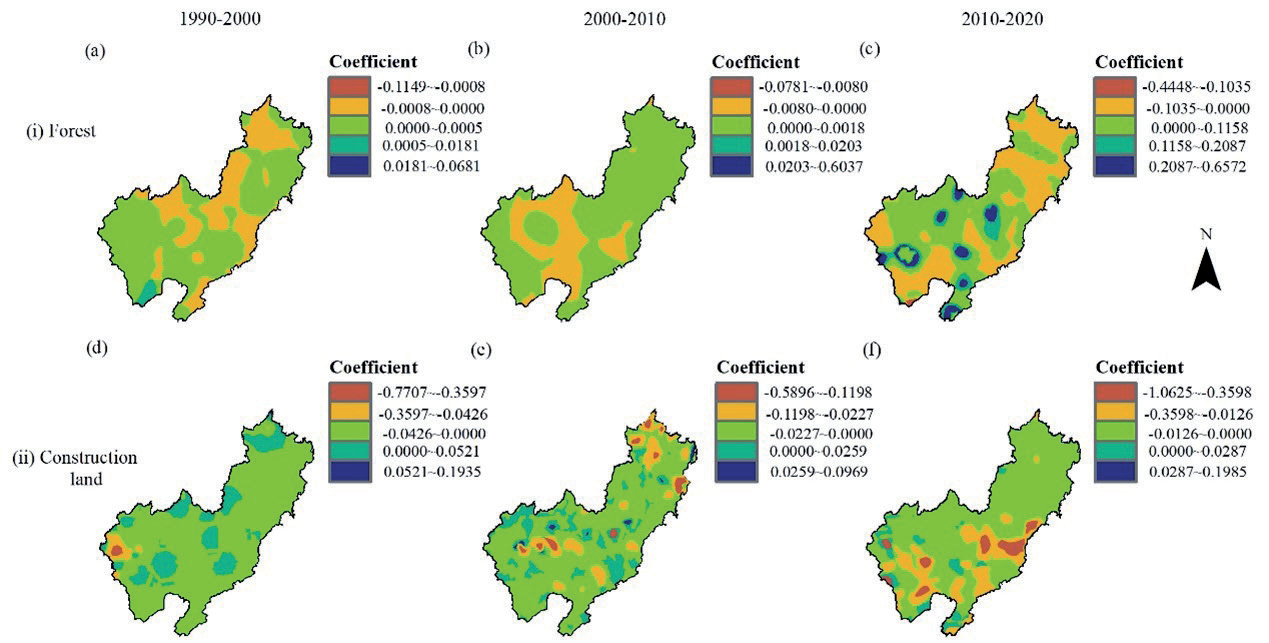
From 1990 to 2020, the impact of construction land on habitat quality was mainly negative, which indicated that construction land was mainly negative on habitat quality, but the performance of local areas in different periods was different. From 1990 to 2000, the lowest value of the regression coefficient was -0.7707; the positive correlation area was mainly distributed in the north and center of the study area, with the highest value of the regression coefficient being 0.1935.
From 2000 to 2010, the negative correlation area continued to spread, with the lowest value of the regression coefficient of -0.5896. From 2010 to 2020, the negative correlation area gradually showed a continuous spatial clustering feature, mainly concentrated in the southern part of the study area, with the lowest value of the regression coefficient being -1.0625.
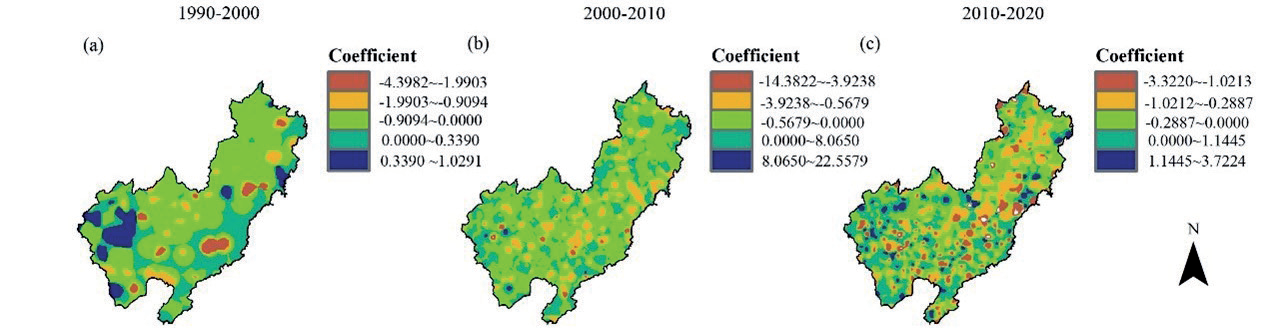
According to Fig. 12, the impact of land use on habitat quality in the study area was mainly negative. In the three stages from 1990 to 2000, 2000 to 2010, and 2010 to 2020, the highest regression coefficients were 1.0291, 22.5579, and 3.7224, respectively. The lowest regression coefficients were -4.3982, -14.3822, and -3.3220, respectively. From 1990 to 2010, the positive correlation area was concentrated in the southwest of the study area. From 2010 to 2020, the positive correlation area gradually spread to the northeast of the study area. From 1990 to 2000, the negative correlation area was mainly concentrated in the middle of the study area. However, from 2000 to 2020, the negative correlation area gradually spread and was distributed in scattered patches within the study area.
Discussions
Effect Mechanism of Land Use Change on Habitat Quality
In the last 30 years, the land use types in the study area were mainly forest land and farmland. Among them, except water land, construction land, and other land, the area of other land types has decreased to varying degrees. The study area is an important agricultural planting area in Anhui province, and its main land use type is farmland, which accounted for 38.88% of the whole area in 2020. The surrounding ecological environment of the study area is superior, with lakes, reservoirs, and wetlands of varying sizes, such as Shengjin Lake and Caizi Lake, which are important habitats for wintering waterbirds [50]. In 2020, the area proportion of water area in the study area reached 7.64%. In the south and west, there are famous mountain attractions such as Jiuhua Mountain, Dabie Mountain, and Huangshan Mountain, and the area proportion of forest land reached 29.96%. Thus, it could be seen that the ecosystem structure of the study area is diverse and rich in biodiversity. The maintenance of regional habitat quality would be of great value for the stability of ecosystems and the enrichment of biodiversity.
Since 2021, China has introduced and implemented a series of protection and development policies of “Yangtze River Conservation” and “Yangtze River Economic Belt” [51], which have provided important guidance for the optimization of land use layout and the stability of ecosystem structure in the middle and lower reaches of the Yangtze River. However, in the past 30 years, with the economic growth of the Yangtze River Delta region, the area of construction land in the study area continued to expand, especially around key cities. Construction land continued to occupy the surrounding ecological land and farmland, which led to the deterioration of the local ecological environment to different degrees. According to the analysis results, from 1990 to 2020, the area of farmland transferred out to construction land reached 391.73 km2, which indicates that a large area of farmland has been occupied as construction land during this period. Meanwhile, the forest land transferred out to paddy land, and dry land reached 192.94 km2, which indicated that some forest land had also been reclaimed into farmland. Therefore, the direct internal relationship between the rapid transformation of land use structure and the continuous deterioration of the regional ecological environment and habitat quality needs to be further discussed.
Based on the InVEST model, the changes in habitat quality in the study area over the past 30 years were obtained. The area of low habitat quality was transferred to the area of lowest quality grade, which led to the decline of the whole habitat quality, and the trend of habitat quality degradation was obvious. Combined with the change in land use structure, the areas with high habitat quality were mainly distributed in the western and southern mountainous areas of Anhui province. The land use types in these areas were mainly forest land, water area, and grassland, whose ecosystem structure was relatively stable and the intensity of human activity was low, so the habitat quality was at a stable and high level. The land use structure of farmland was relatively simple, and the species diversity was low, so the area proportion of low habitat quality grade was the highest, and it was spatially consistent with the distribution area of farmland. The areas with low habitat quality were scattered in spots along the river and the main urban area. The above phenomenon showed a trend that the low habitat quality was gradually spreading from the spots to the periphery, which was basically consistent with the spatial trend of construction land expanding outward to occupy other land in the study area. These findings suggested that urban expansion encroached on the original habitats and created new sources of threat. As a result, the surrounding habitats have been squeezed and segmented, leading to a continuous decline in regional habitat quality [52]. Thus, it could be seen that habitat quality changes are highly correlated with population, economy, and land use structure [53].
According to the regression coefficient analysis of the GWR model on habitat quality and land use type in the study area, the impact of land use on habitat quality in the study area was mainly negative correlation, and the negative correlation showed a spreading trend. Besides, the impact of paddy land and dry land on habitat quality had a two-level differentiation, which might be related to the inevitable expansion of construction land, and frequent human activities have a negative impact on the ecological spatial pattern [33]. Moreover, to pursue more economic interests, such activities as reclamation of forest land, grassland, and lakes, excessive use of pesticides, and high-pollution aquaculture were carried out [54], which has led to the inhibitory effect of paddy land and dry land in some areas on the habitat quality of the region. Besides, the impact of construction land on habitat quality was mainly negatively correlated, while that of forest land was mainly positively correlated, which further verified the conclusions that changes in regional land use structure were closely related to the change of habitat quality, and urban expansion led to the continuous decline of regional habitat quality.
Ecological Function Maintenance and Habitat Quality Improvement
The improvement of regional habitat quality requires not only the intensification of urban construction, but also the common development of natural ecosystems in the regional life community [55]. Similarly, the improvement of habitat quality also affects the maintenance of ecological function level [56]. Biodiversity is one of the important conditions for maintaining regional ecological functions [57]. Most of the areas with high habitat quality in the study area are mountains, forests, and lake wetlands. Human activities are less in these areas. The high vegetation coverage in mountain areas and the abundant water resources in lakes are favorable to the survival of aquatic animals and plants. For instance, wetlands are part of a global migratory flight network that supports waterbirds, which rely on a continent-wide network of wetland habitats to support their annual life cycle needs [58]. However, when the wetland is reclaimed into rice paddies, the density of the soil seed bank and the number of species will decrease dramatically [59]. The construction of urban built-up areas destroys the original habitat, resulting in the segmentation and fragmentation of the habitat [40], which ultimately leads to the deterioration of the surrounding habitat quality and strong disturbance of ecosystem biodiversity. Undoubtedly, the level of regional ecological function will decline. Therefore, water resources and wetland resources should be protected, and the pollution of water bodies by farmland and construction land should be effectively managed. These countermeasures would maintain the diversity of regional ecological functions and the stability of the system. Furthermore, it is widely believed that the expansion of cities is inevitable, and the degradation of habitat quality is gradually aggravated by the trend of globalization. However, if ecological protection of habitats is blindly carried out, will it contradict the development trend of the global economy? Studies have found that the degrading effects of urbanization may be diminished or even eliminated by smart city growth scenarios, which has suggested that the trade-offs between habitat protection and urban development could be achieved [60]. Therefore, how to restore damaged habitats and maintain habitat quality while developing economically is a pressing issue for the development of the study area or even the Yangtze River Basin. Hence, according to the above research results, this study proposed a pattern framework for habitat quality improvement and ecological function maintenance based on regional scale (Fig. 13).
The areas with low habitat quality in the study area were mainly distributed around the Yangtze River Basin. Most of these areas were urban development centers; the main characteristics of this area were too much construction land, frequent human activities, and rapid economic development. In view of the main characteristics of this region, the following measures were proposed: First of all, the spread of construction land would cause damage to the surrounding natural habitats. Therefore, from the perspective of the relationship between humans and land, the ecological compensation mechanism should be improved, and the relationship between construction land and green space should be adjusted. With the increase and change of construction land, the corresponding change of green space should be accompanied, so that it could maintain organic coordination in space and dynamic balance in the total amount [3]. The above measures would contribute to the stability of the overall ecosystem. Besides, because of the frequent human activities in the area, the study area is rich in water resources and lake wetlands resources. In order to prevent human activities from further affecting the ecological environment, the protection red line of farmland should also be strictly delineated in the periphery of urban expansion areas, and buffer zones [61] should be set up around lake wetland and forest land (Yangtze River basin, Shengjin Lake, southern Anhui mountain area, etc.). Secondly, key ecological protection areas and corridors should be established [62, 63], and the expansion of construction land within the ecological corridors should be prohibited. Moreover, the local area could fully utilize the above resource conditions. Some measures, such as river desilting and environment remediation, water quality improvement, and water system connectivity enhancement, should be incorporated into the pattern system [64, 65]. Wetland parks level division and wetland animal reserves should be taken seriously to set up a practice visit base that enhances the ecological protection awareness of young people. Finally, the rapid economic development must be accompanied by the continuous expansion of construction land, so local governments should strictly control the expansion of construction land around local cities. At the same time, the construction of ecological infrastructures should be strengthened to achieve the goal of coexistence between urban development and environmental protection. Local governments should support and encourage low-carbon and environmentally friendly lifestyles so as to realize the joint “smart growth” of cities and towns and ecology.
Fig. 13.
A pattern framework for ecological function maintenance and habitat quality improvement in the study area.
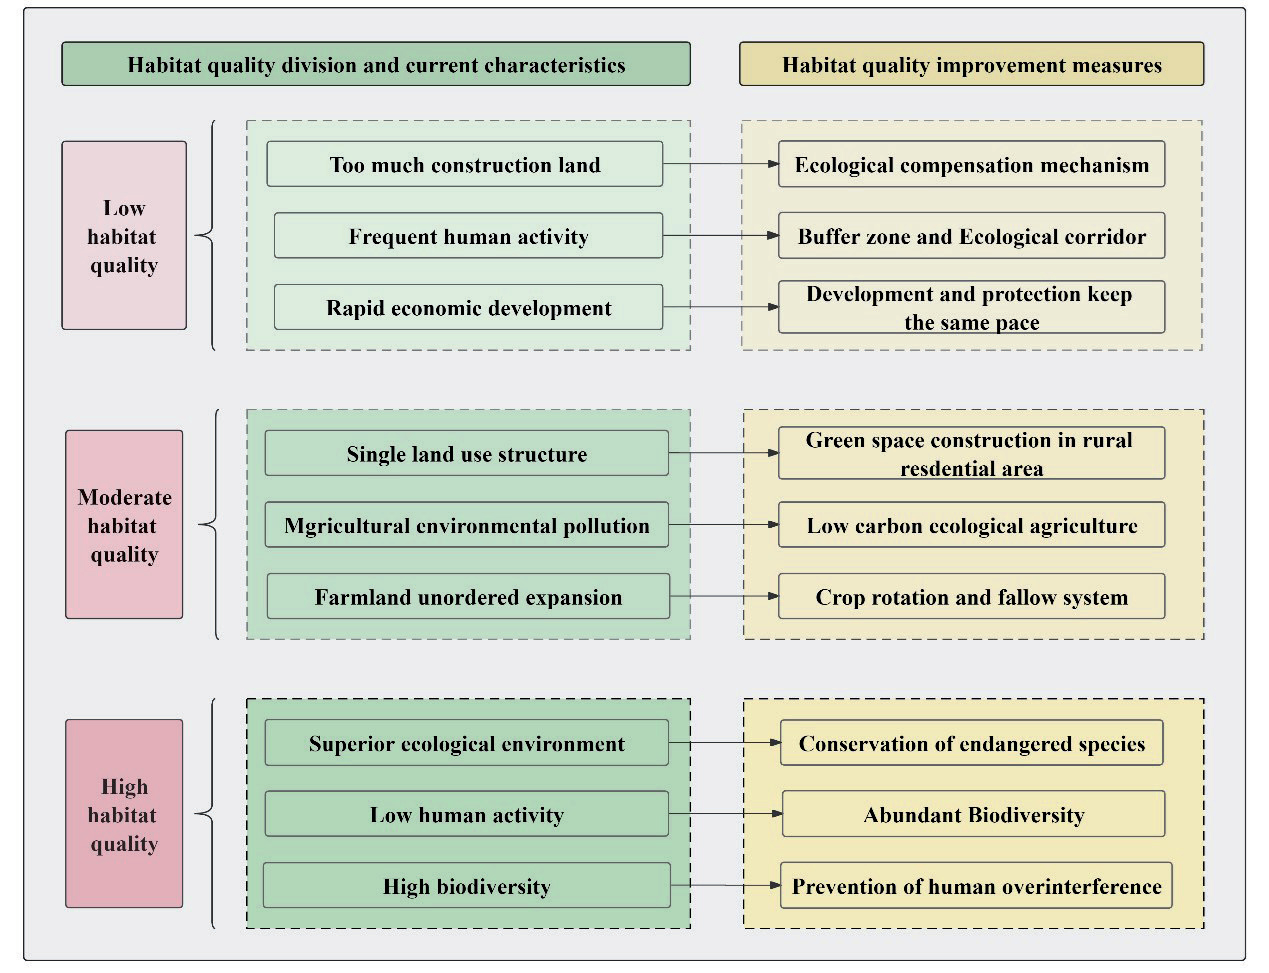
The areas with middle habitat quality were mainly distributed in the middle and northern areas of the study area. The land types of these areas were mainly farmlands. Therefore, the land use structure of the areas with middle habitat quality was relatively simple, which was mainly composed of farmland and rural construction land. The increase of agricultural activities would lead to agricultural environment pollution, and the disorderly expansion of farmland would lead to the reduction of forest land and the obvious degradation of natural habitat, which would affect the security of the regional ecosystem. For this, firstly, it should be necessary to improve the construction of green space in the rural construction area, control the discharge of rural pollutants, prohibit unauthorized occupation of farmland for building houses, and ensure the ecological continuity of rural construction land [66], so as to make up for the defects of land use structure, which is too simple. Secondly, local governments should build low-carbon agriculture, ecological agriculture, and other ecological concepts [67] to reduce environmental pollution caused by excessive use of agricultural fertilizers and livestock and poultry manure. At the same time, the farmland rotation fallow system should be optimized, scientific implementation of managed fallow [68], return farmland to forest and grassland [69], and reasonable adjustment of the planting system should be advocated, so as to reduce the disorderly expansion of farmland and increase soil toughness.
The areas with high habitat quality were mainly distributed in the Dabie Mountains, Jiuhua Mountains, and Huangshan Mountains in the south of the study area, and lake wetlands such as Shengjin Lake in the middle of the study area. These areas are an important part of the ecological corridor system of the area of the Yangtze River in Anhui Province. The ecosystem structure of these areas is relatively stable, human activity is low, the superior ecological environment is suitable for the survival of animals and plants, and it plays a key role in the ecological security of the region [70]. Therefore, the maintenance of natural habitats should be paid attention to in these areas. In addition to the above-mentioned ecological corridors and buffer zones in the surrounding areas to effectively prevent excessive human interference, local governments should also strengthen supervision over deforestation and other acts that would destroy the ecological environment [71]. Besides, the protection of endangered species should be paid attention to in these areas. For example, in the future, on the basis of a biodiversity background investigation and long-term field observation work, combined with technologies such as macro-scale remote sensing observation, satellite tracking, and model simulation [72, 73], scholars could effectively reflect the spatiotemporal changes characteristics of regional biodiversity.
Conclusions
(1) The main land use types in the study area were paddy land and forest land, and the area of two land types accounted for more than 65% of the whole area. In the past 30 years, except for water areas, construction land, and other land, the area of other types of land has decreased to varying degrees. The area of construction land increased from 177.94 km2 to 630.62 km2, the area proportion has increased by 1.3%, and the main source of construction land increase was farmland.
(2) The average habitat quality in the study area was 0.5918 in 1990, 0.5902 in 2000, 0.5850 in 2010, and 0.5814 in 2020, respectively, which reflected a decreasing trend of habitat quality in the study area. The phenomenon of habitat degradation along the Yangtze River and in the northwestern part of the study area was obvious, with the lowest degradation degree being -0.495. The whole habitat degradation trend in the study area was obvious.
(3) In the response of habitat quality to land type, the impact of construction land on habitat quality was mainly a negative correlation, while the impact of forest land on habitat quality was mainly a positive correlation. Among them, the areas with a negative correlation between construction land and habitat quality gradually showed a continuous spatial distribution in the river basin and the rapid urban development area near the north of the study area, and the lowest value was -1.0625.

