

Introduction
In recent years, global warming has intensified, triggering extreme events that seriously threaten the expected survival of human beings and other animals and plants [1, 2]. As a large carbon-emitting country, China is supposed to actively participate in global climate action [3, 4]. According to the Emissions Gap Report 2023 report released by the United Nations Environmental Planning Deployment in 2023, people need to promote the global low-carbon transition; carbon storage and sink function are important links affecting the ecosystem, vegetation, and soil are important carbon reservoirs in the ecosystem, and carbon sinks also seriously affect the climate crisis [2, 5]. In the face of such great pressure to reduce emissions, all regions of China must find out the influencing factors affecting the change of global carbon stock as soon as possible [6].
Land use change is an important part of global environmental change and the main driving force, affected by a variety of factors, and directly affects the global material cycle and energy exchange process [7- 10]. Therefore, land use change is an important factor in determining the carbon stock of ecosystems. It is also the main basis for distinguishing carbon sources and sinks. Human activities have a greater impact on carbon emissions, so how to carry out reasonable planning and optimal allocation of land resources is an important influencing factor in improving the regional carbon sequestration capacity [11, 12]. The climate is also an important influencing factor; climate change affects land use and arable land changes, but it also affects the carbon storage and carbon sink function [7, 9]. At the same time, it is also influenced by population, technology, politics, economy, and culture [13, 14]. Although using carbon density to calculate carbon storage has achieved significant results, regional restrictions are relatively strong. Because carbon density data in some study areas are derived from the research results of the whole country and some places rather than actual measurement results, and carbon density values vary with different climate and soil properties and land use, the standard implementation of this method in specific regions is limited to some extent [15]. For this reason, many scholars have calibrated the carbon density to adapt it for calculating carbon storage in different regions. For example, Chen et al. [2] selected some random forest points and obtained carbon storage through the allometric growth equation of biomass. Zhu et al. [16] ignored the dead carbon density and corrected other carbon density data to obtain carbon storage. Zhao et al. [17] divide the forest carbon stock into several parts and calculate their carbon density separately. Although they all processed the carbon density data, they did not accurately calculate the carbon density of each part. In this study, we used environmental variables to correct the carbon density calculation so as to accurately obtain the value of carbon reserves; it also explores the influencing factors affecting carbon stocks from various aspects.
Manas County is a relatively complete ecosystem functional service area and an important area for constructing ecological environmental protection in Xinjiang and even the whole northwestern region [18]. The forest ecosystem is the largest carbon reservoir in terrestrial ecosystems, accounting for about 2/3 of the carbon stock in terrestrial ecosystems, and it also plays an important role in the whole ecosystem service system in Manas County [19]. However, with the continuous development of industry in recent years, the rapid expansion of urban construction land, excessive deforestation, and occupation of forest land for farming and other operations have led to a gradual increase in atmospheric carbon emissions, resulting in carbon sources and sinks have also changed significantly, and solving this problem has become an urgent need for the construction of the current ecological civilization [20, 21]. To fill this gap, this study aims to (1) improve the assessment of the current status of complex land use in dry areas and overcome the limitations of land use evaluation; (2) analyze the spatial and temporal evolution trends of carbon stocks in terrestrial ecosystems in Manas County over the past 20 years by using the improved carbon density of environmental variables, which will provide a basis for the sustainable development of the regional dual-carbon policy and (3) combine the 10 natural and anthropogenic driving factors to reveal the dominant driving mechanism of carbon stock evolution in Manas County, contributing a guiding basis for future ecological protection and dual-carbon policies.
Materials and Methods
Study Area
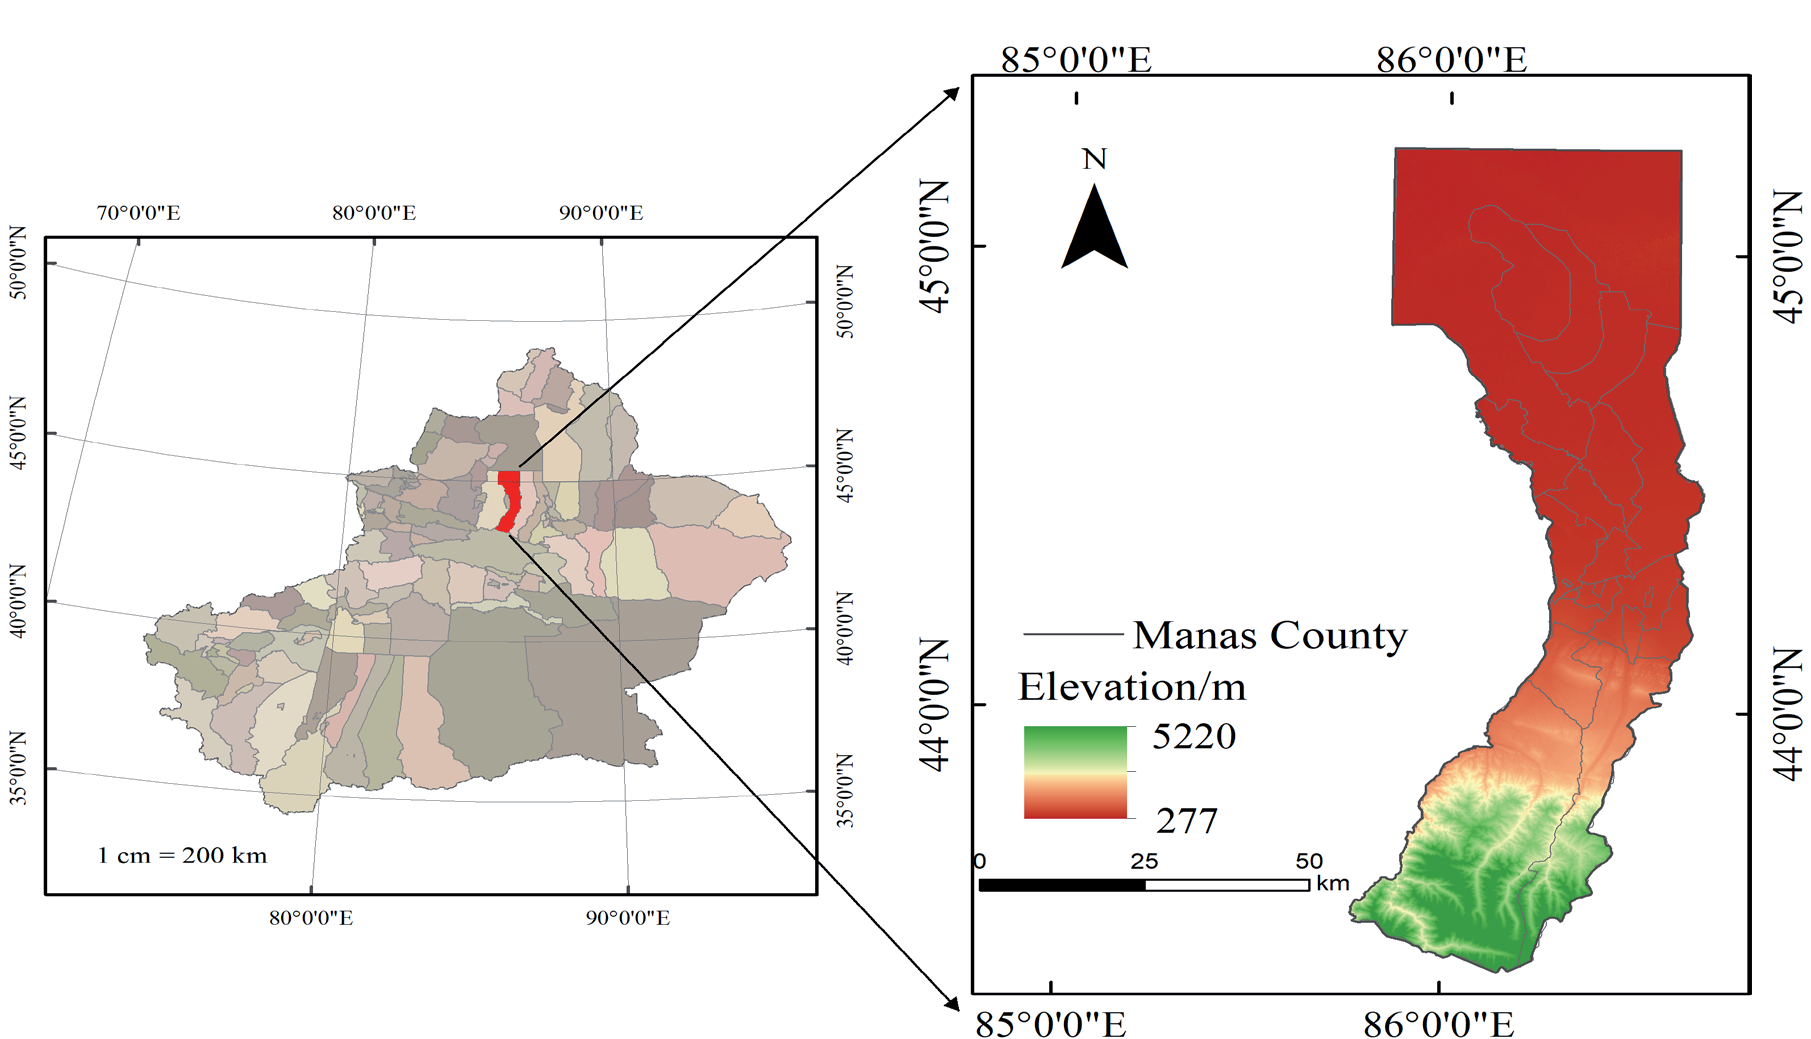
Manas County is subordinate to Changji Hui Autonomous Prefecture of Xinjiang Uygur Autonomous Region and is located in the hinterland of Xinjiang [22, 23]. It is in a triangle, with Tacheng in the north and Yining in the west. Its geographical location is (85°34′~86°43′E,43°28′~45°38′N) (as shown in Fig. 1). It borders Hutubi County in the east, Shihezi City in the west, Hejing County in the south, and Hoboksar Mongol Autonomous County in the north. The total area of the county is 9154.48 square kilometers [24]. The topography of Manas County can be divided into three types: the southern part is the Tianshan Mountains and hilly areas, which are excellent summer pastures; The central region is an alluvial plain area, which is the primary grain production area of the county; The northern region is a desert area, which is part of the Gurbantunggut Desert. The mountain ranges within the area belong to the middle section of the Yilian Habirga Mountains in the Tianshan Mountains.
Data Sources
The dataset used in this study to screen for factors affecting changes in forest carbon storage from 2000 to 2020 mainly includes: (1) land use data, with a resolution of 30 m for 5 periods from 2000, 2005, 2010, 2015, and 2020. Based on Landsat data, combined with field surveys, visual interpretation, and confusion matrix preprocessing, land use types are classified into six types according to the national land use classification: cultivated land, forest land, grassland, water area, construction land, and unused land [25].
(2) Climate influencing factors, such as the annual average accumulated temperature, sunshine duration, and precipitation data of the study area over the years.
(3) Terrain influencing factors, including DEM, slope, etc. (4) Social economic data, including population spatial distribution, gross domestic product (GDP) km grid data, and second-class highway vector data (Table 1).
The land use transfer matrix is often used by researchers in geographical studies. The land use transfer matrix can reflect the structural changes of land use types in different periods and the transfer direction and source quantity of land use types. This study selected land use data from the years 2000, 2005, 2010, 2015, and 2020, preprocessed the data according to the land use types in the study area, and summarized the results (Table 2):
According to previous studies by scholars, the carbon storage of the entire ecosystem can be divided into four parts. This study also adopts this classification method, which is: (1) Aboveground carbon (carbon in vegetation living on the land surface); (2) Underground carbon (carbon in the roots of underground plants);
(4) Dead organic carbon (organic carbon in dead branches, leaves, and dead plants). The model calculation formula is:
Ci,above is the carbon density of aboveground biomass of plants, Mg C/hm2; Ci,below is the biomass carbon density of underground plant roots, Mg C/hm2; Ci,soil refers to the organic carbon density of soil in the soil layer, Mg C/hm2; Ci,dead refers to the organic carbon density of litter, Mg C/hm2 type cover. Ctotal is the total carbon storage, Mg; Ci is the total area covered by each land type, and n represents the total land use.
Table 1.
Impact factor data acquisition.
Table 2.
Land use transition matrix.
The carbon density data used in this study mainly refers to the measured data from existing literature. When selecting data, the following principles should be followed: the carbon density of soil, aboveground organisms, underground organisms, and dead organic matter should be obtained through field investigations. Priority should be given to selecting literature data from Manas County, Xinjiang. Data from nearby Manas County should be used as much as possible for the missing data. If there are still gaps, data from Xinjiang should be used. However, as carbon density varies with soil properties and land use, precipitation data and the relationship between biomass and soil carbon density are used to correct carbon density [26, 27].
The formula for the relationship model between biomass carbon density, soil carbon density, and precipitation used in this study is:
In the formula, CBP is the aboveground biomass carbon density (Mg/ha2) obtained based on annual precipitation; CSP is the soil carbon density (Mg/ha2) obtained based on annual precipitation; PMA is the annual precipitation (mm); KBP is the correction factor for aboveground biomass carbon density precipitation factor; KSP is the correction coefficient for soil carbon density precipitation factor; CBP1 and CBP2 are carbon density data for Manas County and Xinjiang, respectively. The corrected carbon density value of Manas County is obtained by multiplying the carbon density value of Xinjiang by KBP and KSP. According to the above formula, climate data is used to correct the carbon density of Manas County. Some of the carbon density data are shown in Table 3:
Methods
Land Use Transfer Matrix
With the help of tools such as overlay analysis and transition matrix in the ArcGIS 10.8 software, the changes in land use in the study area over the past 20 years can be obtained. This section mainly adopts an N-order matrix structure, which can concisely display the area information of different land types in the early and late stages, as well as the dynamic changes of land type transitions during this time period.
Table 3.
Carbon density values of different land use types in Manas County (t/hm2).
| LULC type | Ci, above | Ci, below | Ci, soil | Ci, dead |
|---|---|---|---|---|
| Cropland | 1.71 | 18.59 | 82.2 | 1.24 |
| Forest | 47.04 | 26.77 | 164.19 | 3.05 |
| Grassland | 9.82 | 17.43 | 66.07 | 0.36 |
| Water | 4.36 | 0 | 0 | 1.23 |
| Constructed | 5.69 | 0 | 0 | 0 |
| Bare land | 3.69 | 0 | 22.33 | 0 |
The general expression for the transition matrix is:
In the formula: S represents the area, Sij represents the area where the i-type land before transfer is converted into the j-type land after transfer; i. j (i, j = 1, 2, 3, ..., n) represents the land type before and after the transfer; N represents the number of land use types before and after the transfer; When i = j, it indicates the area where the land type has not undergone any transfer.
Geographic Detector
The geographic detector is a spatial statistical method and quantitative technique that can detect spatial heterogeneity. It belongs to nonlinear models and can effectively solve the problem of multicollinearity immunity during the calculation process. Each influencing factor is independent of the final model result during the calculation process, and the interactive influence between each pair can also be calculated. Geographic detectors are used to indicate the explanatory power of the independent variable X on the dependent variable Y, represented by the q value; P-values represent significant results. The formula is:
In the formula: h = 1, 2, 3,..., L represents the stratification of the dependent variable Y or the independent variable X; The q value is the detection index for the impact factor of carbon storage spatial variation; Nh and N represent the number of samples in the h layer and the entire region, respectively; And are the variances of the h layer and the entire Y region, respectively. SSW and SST are the intra-layer variance and regional total variance. The range of Q values is [0,1], and the closer the value is to 1, the more significant the spatial heterogeneity of the influencing factors and the greater the explanation of the influencing factors for the spatial variation of carbon storage [28, 29].
Geographic detectors can also measure the interaction between two factors, that is, the strength of the combined effect of two factors relative to the effect of a single factor. This includes the following situations: nonlinear synergy, mutual independence, dual factor synergy, single factor nonlinear synergy, and nonlinear antagonism.
Results
Analysis of Land Use Change Results in Manas County from 2000 To 2020
Analysis of Changes in Land Use Structure
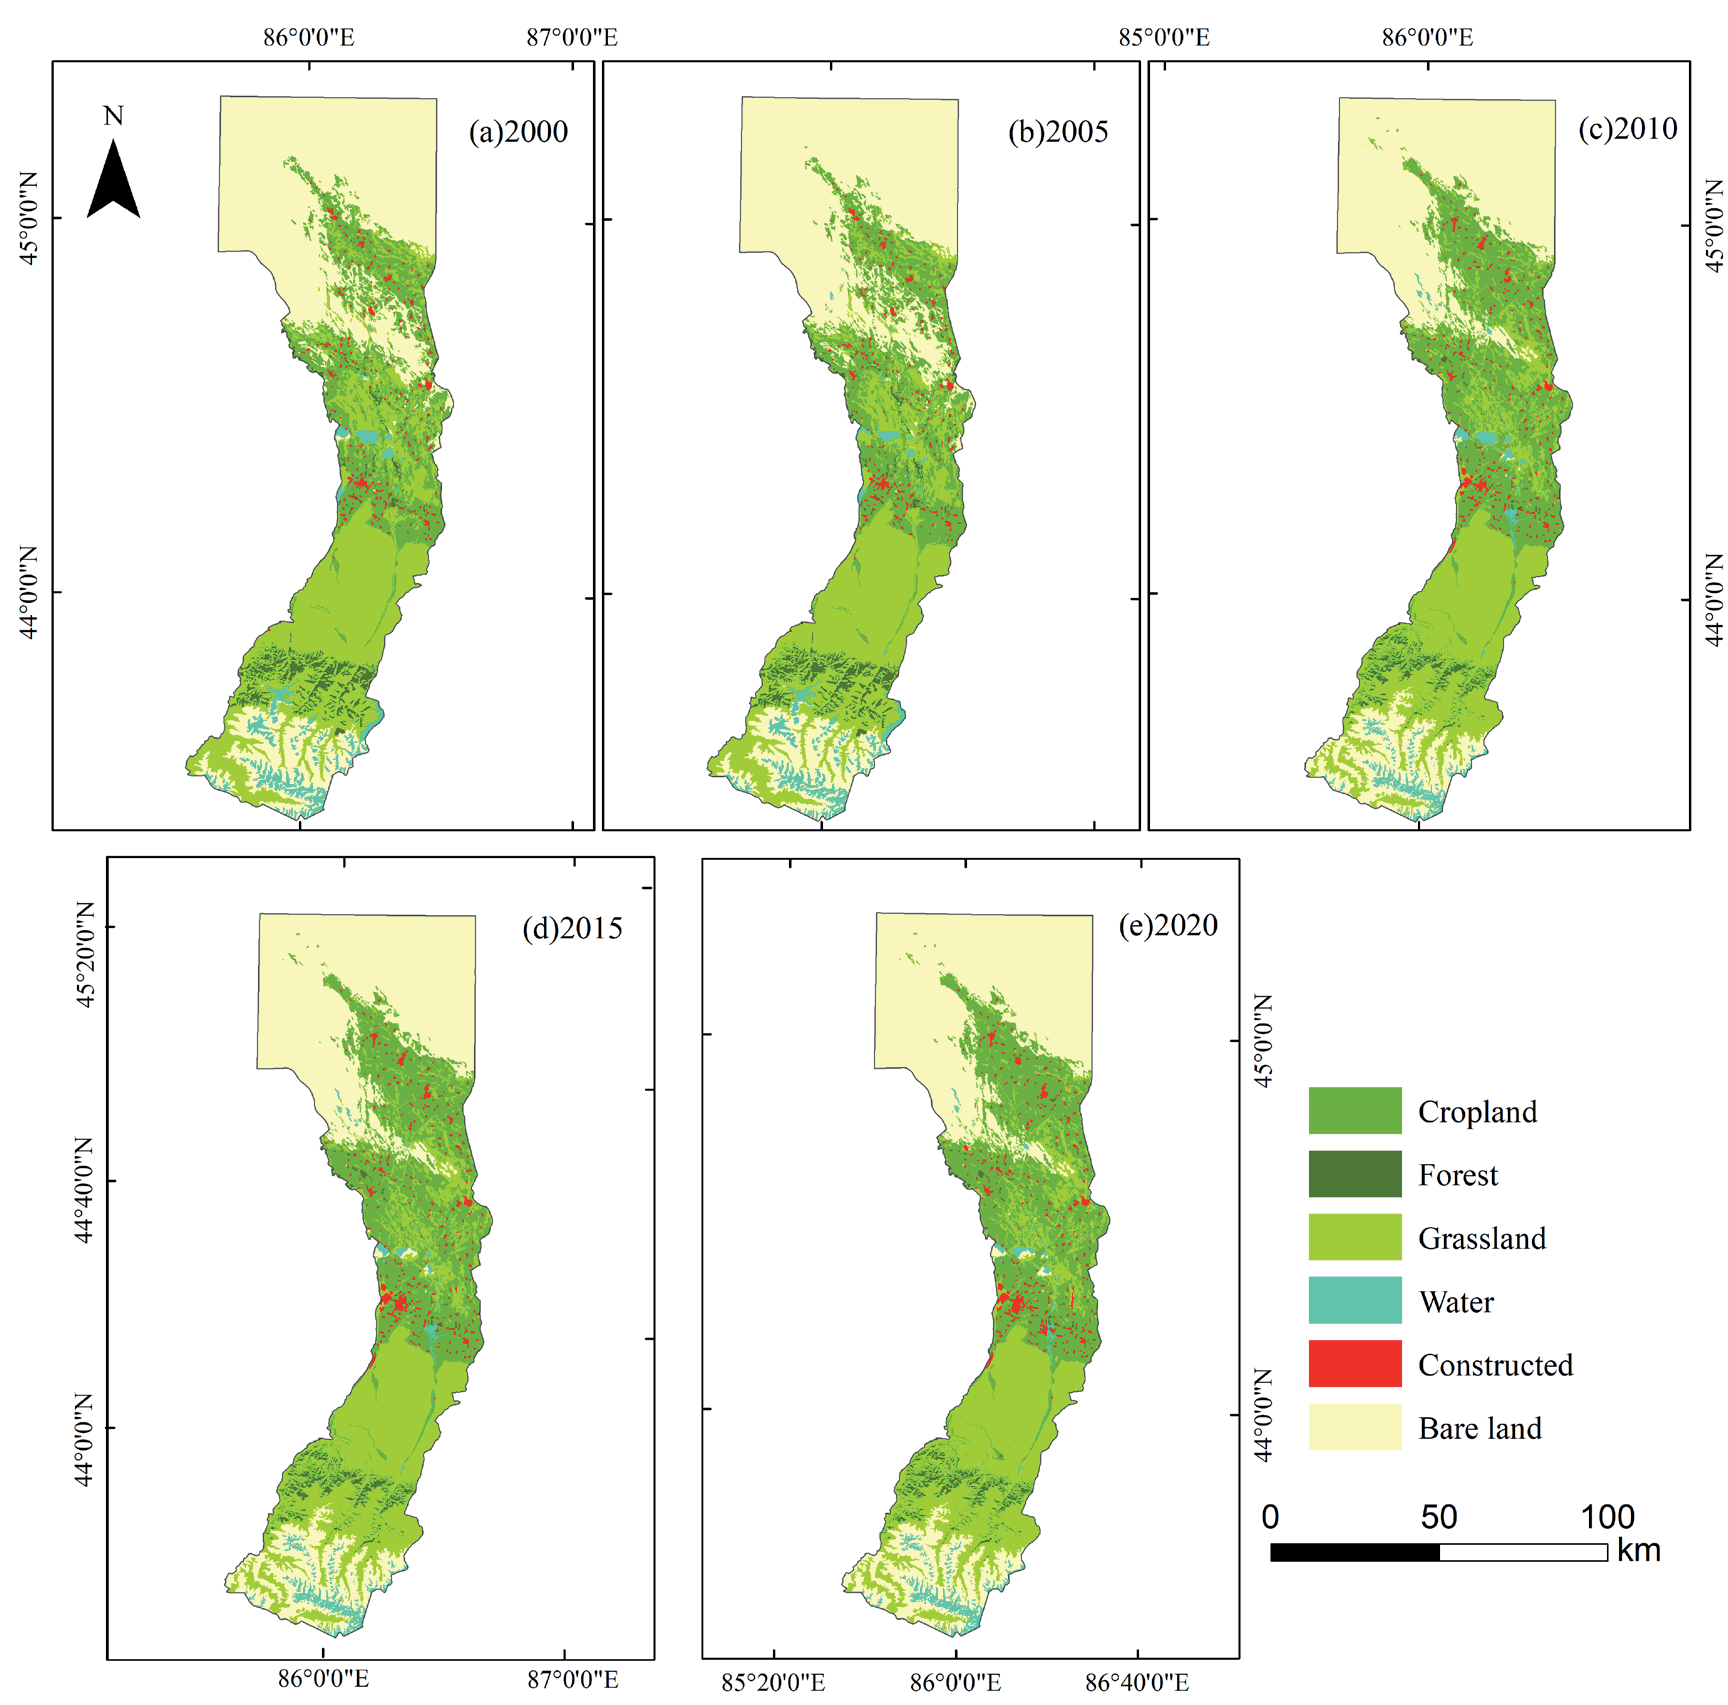
In terms of the proportion of land use types to the total administrative area in 2000, 2005, 2010, 2015, and 2020, cultivated land, grassland, and unused land accounted for a relatively high proportion. According to Fig. 2, there have been significant changes in the areas of arable land, unused land, and construction land between 2000 and 2020. The cultivated land increased from 1700 km2 in 2000 to 2389 km2 in 2020, the unused land decreased from 4081 km2 in 2000 to 3730 km2 in 2020, and the construction land increased from 103 km2 in 2000 to 151 km2 in 2020.
According to Fig. 3, in 2000, unused land in Manas County accounted for a large proportion of the administrative area, reaching 44.5%. The proportion of unused land in Manas County decreased by 4% in 2020. The cultivated land area increased from 18.6% of the total area in 2000 to 26%. From 2000 to 2020, the grassland in this administrative region has consistently accounted for a high proportion of the total land area, reaching 27%. However, the proportion of forest land is relatively small, accounting for only 2.6% of the total area of Manas County. It is mainly distributed in the Xinjiang poplar and spruce forests on the shady slopes of mountains in the Zhongshan area.
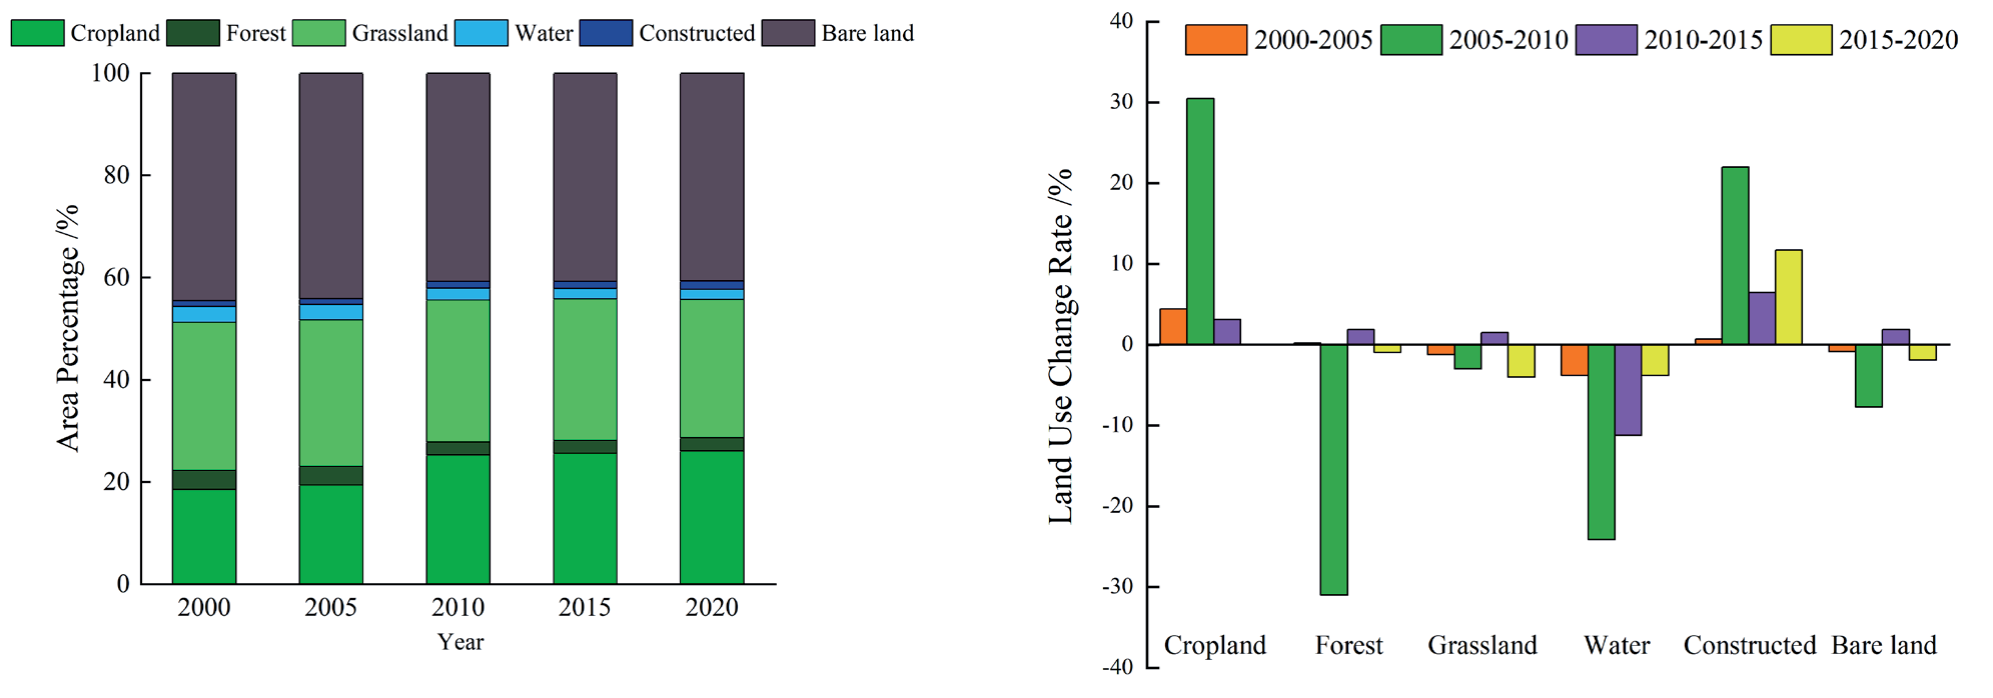
The dynamic change rate of land use reflects the intensity of spatial dynamic changes in land use and provides a certain basis for analyzing the spatiotemporal changes in carbon storage. According to the land use type change map, there have been significant changes in the land use types in the study area over the past 20 years. The cultivated land showed a continuous growth trend from 2000 to 2015, and the dynamic change rate of land use increased by 30% from 2005 to 2010. The water area continued to decline from 2000 to 2020, with the most significant dynamic change rate from 2005 to 2010 reaching -30%. The construction land grew from 2000 to 2020, with a dynamic land use change rate of 25% from 2005 to 2010.
Land Use Transfer Matrix
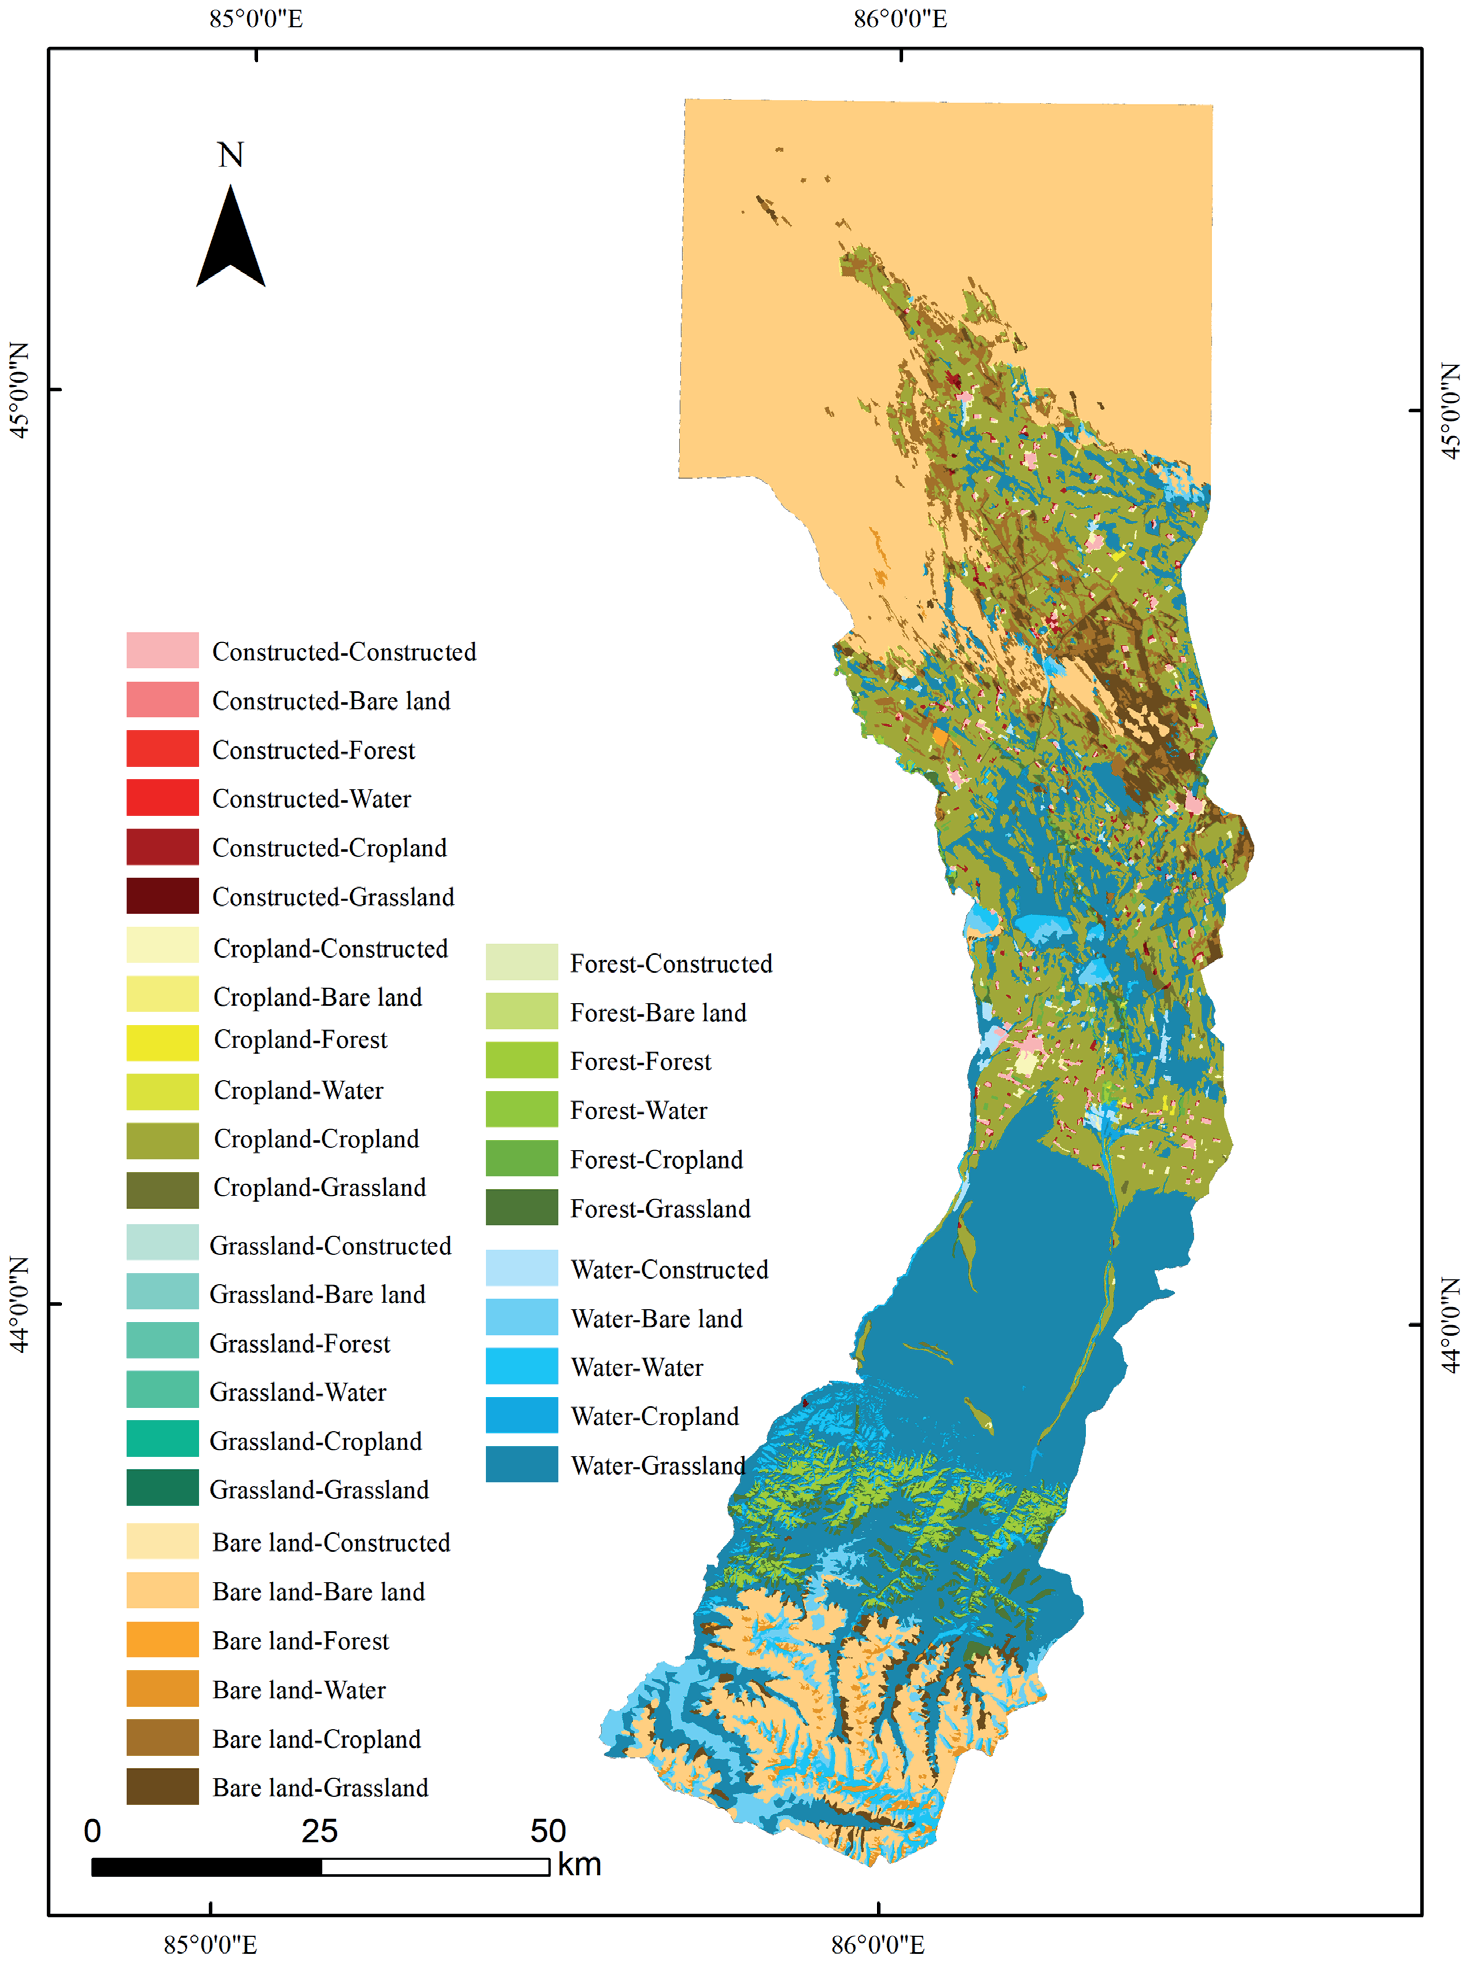
Manas County has significantly changed land use types from 2000 to 2020. According to Fig. 4, compared to 2000, the increase of 700 km2 in arable land in 2020 is mainly due to the conversion of grassland, unused land, and arable land. The decrease of 105 km2 in forest land is mainly shifting towards grasslands and cultivated land. The grassland has decreased by 178 km2, mainly turning to arable land, forest, and construction land. The water area has decreased by 110 km2, mainly turning towards grasslands and unused land. The increase of 50 km2 in construction land mainly comes from cultivated land and grassland. The decrease of 357 km2 in unused land is mainly directed towards cultivated land, grassland, and water bodies.
Temporal and Spatial Variation Characteristics of Carbon Storage in Manas County From 2000 to 2020
Spatial and Temporal Changes in Carbon Stocks
This study used land use and climate data to calculate the carbon density of the study area and conducted a review to ultimately obtain the overall distribution of carbon content in the study area. The total carbon content showed an increasing trend from 2000 to 2020, from 2.9 × 10⁶ TC in 2000 to 5.3 × 10⁶ TC in 2020, with a total increase of 2.4 × 10⁶ TC over the 20 years. Fig. 5 shows that the carbon content in the central and northern regions of the study area has shown a significant increase, from 1.3 × 10⁶ TC in 2000 to 3.0 × 10⁶ TC in 2020. However, the carbon storage in the central and southeastern regions of the study area has been decreasing year by year, with a total decrease of 0.7 × 10⁶ TC over the past 20 years.
Forest Carbon Storage in Manas County
The forest area in Manas County accounts for 2.6% of the total area. This study extracted the carbon storage data of the forest area based on its location in the land use data. As shown in Fig. 6, from the overall distribution, the carbon storage of forest land in Manas County is mainly distributed in the lower reaches of the Manas River basin, with a small amount distributed in the central part. The overall trend of forest carbon storage is decreasing, from 1.7 × 10⁶ TC in 2000 to 1.4 × 10⁶ TC in 2020.
Relationship between Land Use Change and Carbon Storage
There is a positive correlation between carbon and land use change in spatial distribution in Manas County. As unused land gradually migrates towards arable land and grassland, carbon storage also shows an increasing trend, and vice versa (Fig. 7). As shown in Fig. 7, the reasons for the increase in carbon storage in the study area include a decrease in forest area, an increase in arable land area, and an increase in construction land area. The conversion of grassland to construction land, unused land, and cultivated land has also become an important reason for the sharp decline in carbon storage in the study area. Overall, converting grassland, forest land, and construction land to forest land contributes to carbon storage retention, resulting in an increasing trend in carbon storage in the study area (Fig. 7b).
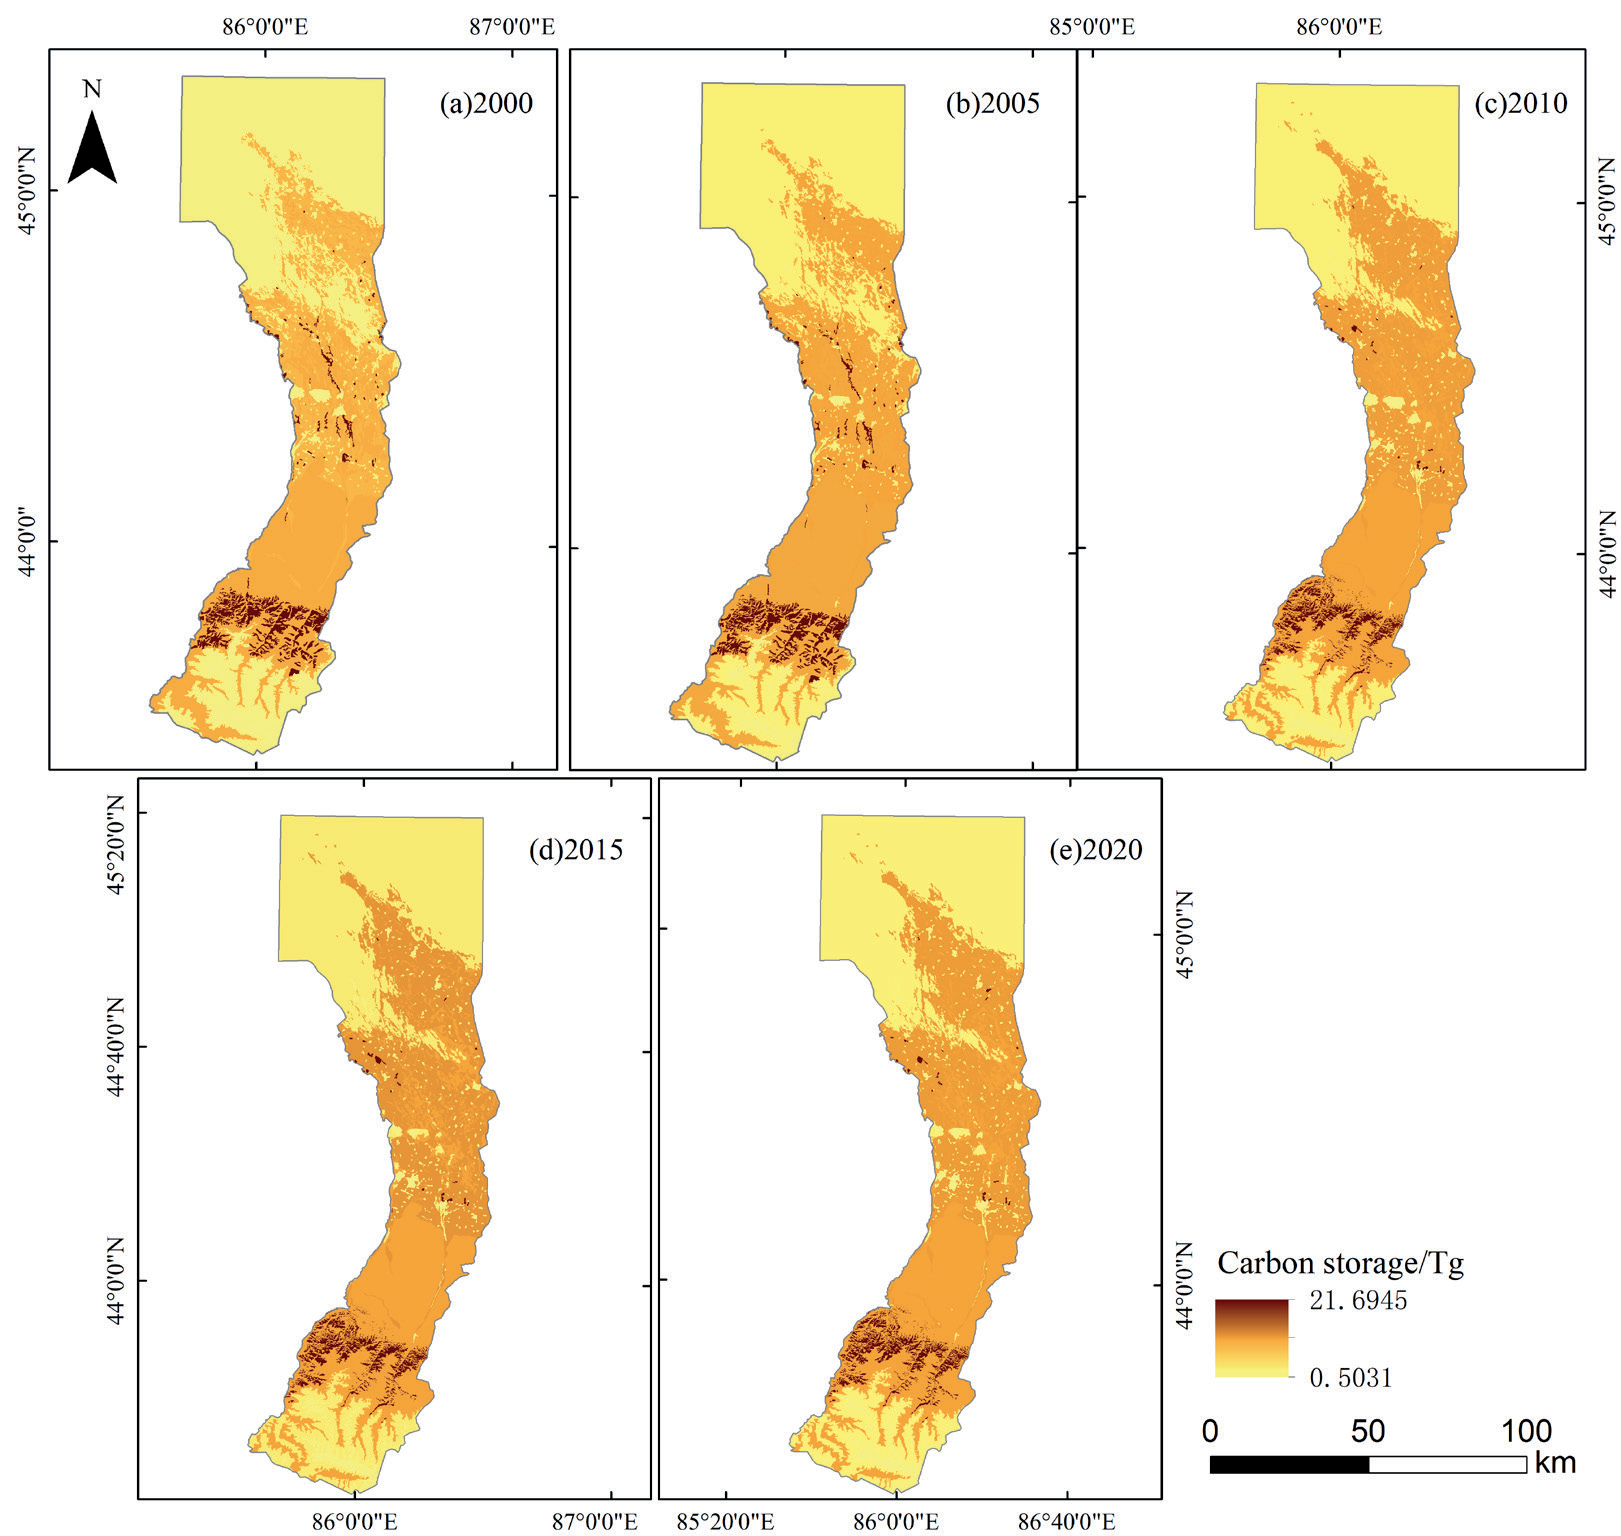
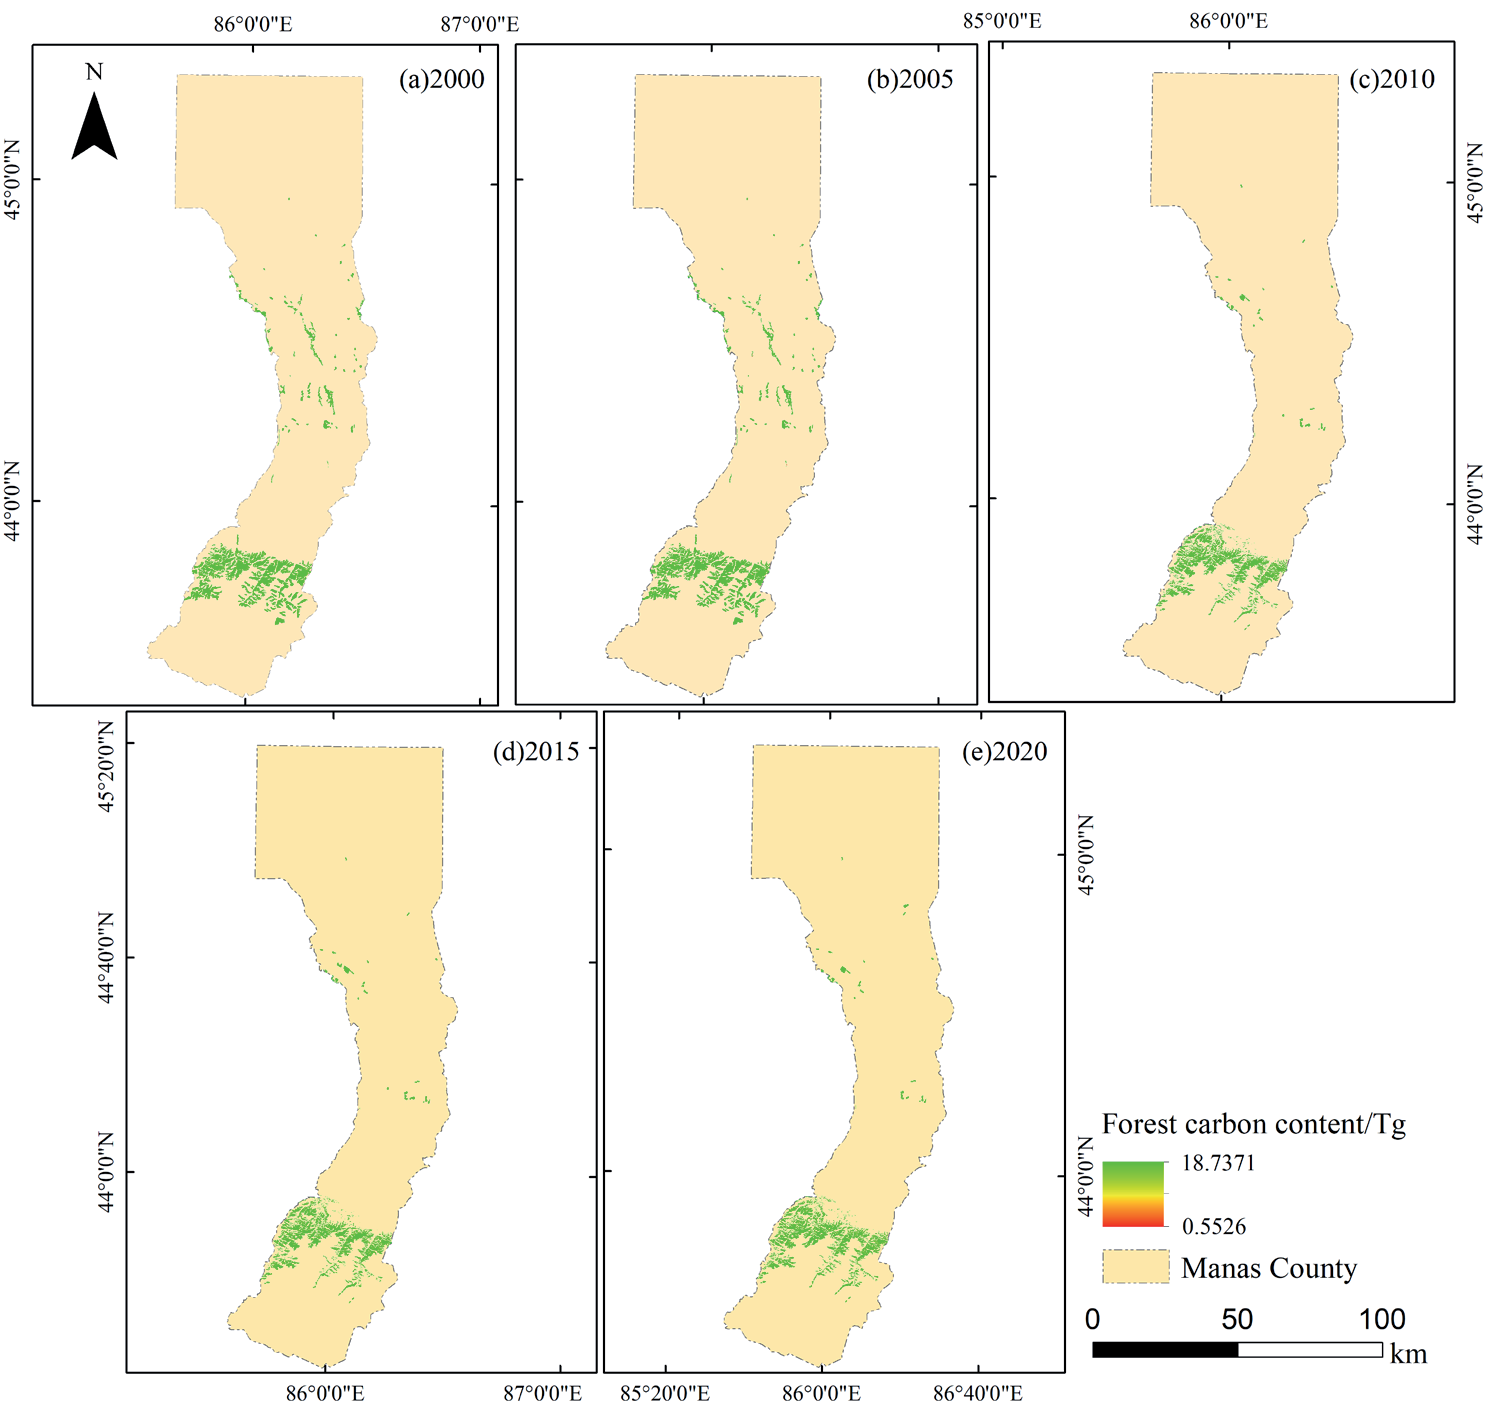
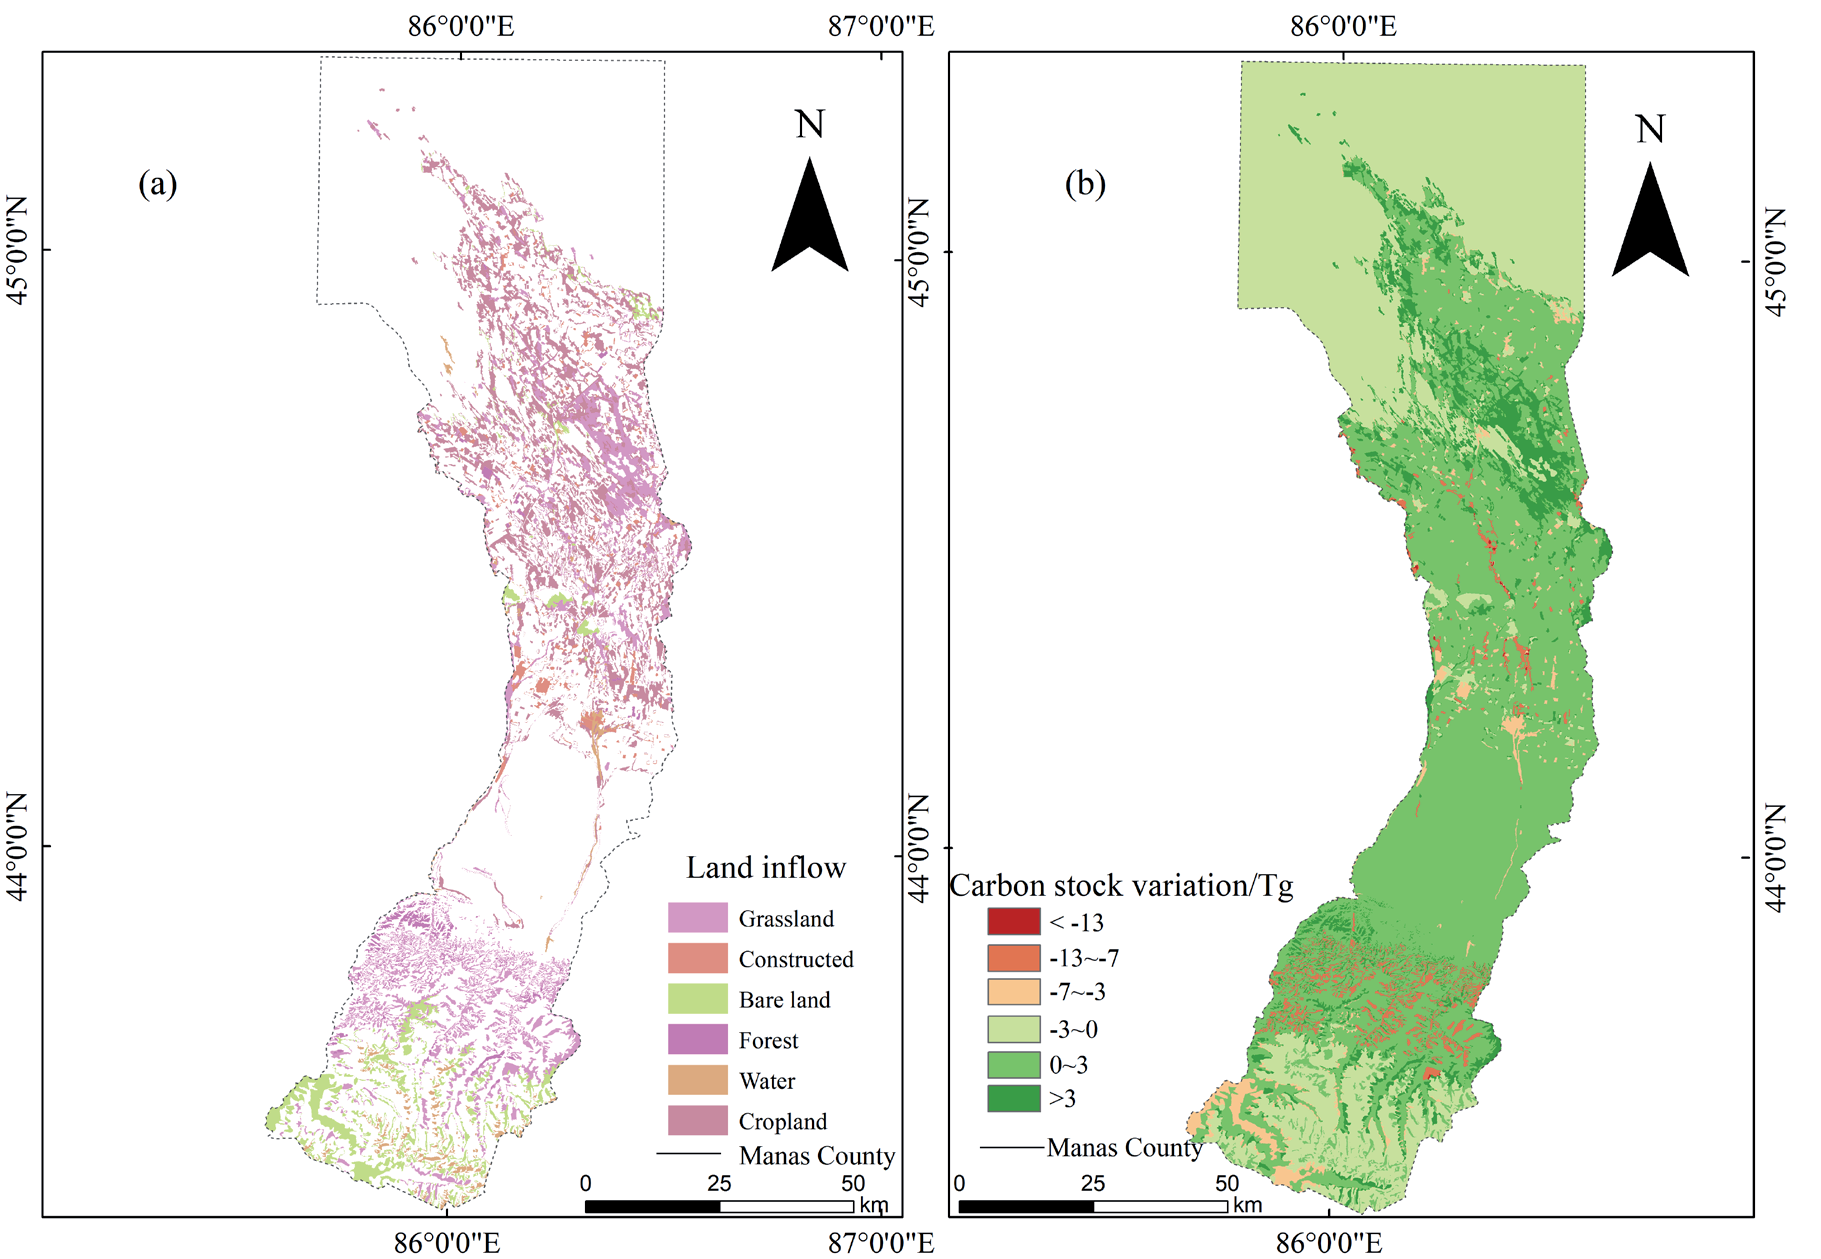
Fig. 8.
Net sequestration/release of converted carbon stocks among different land use types in Manas County from 2000 to 2020.
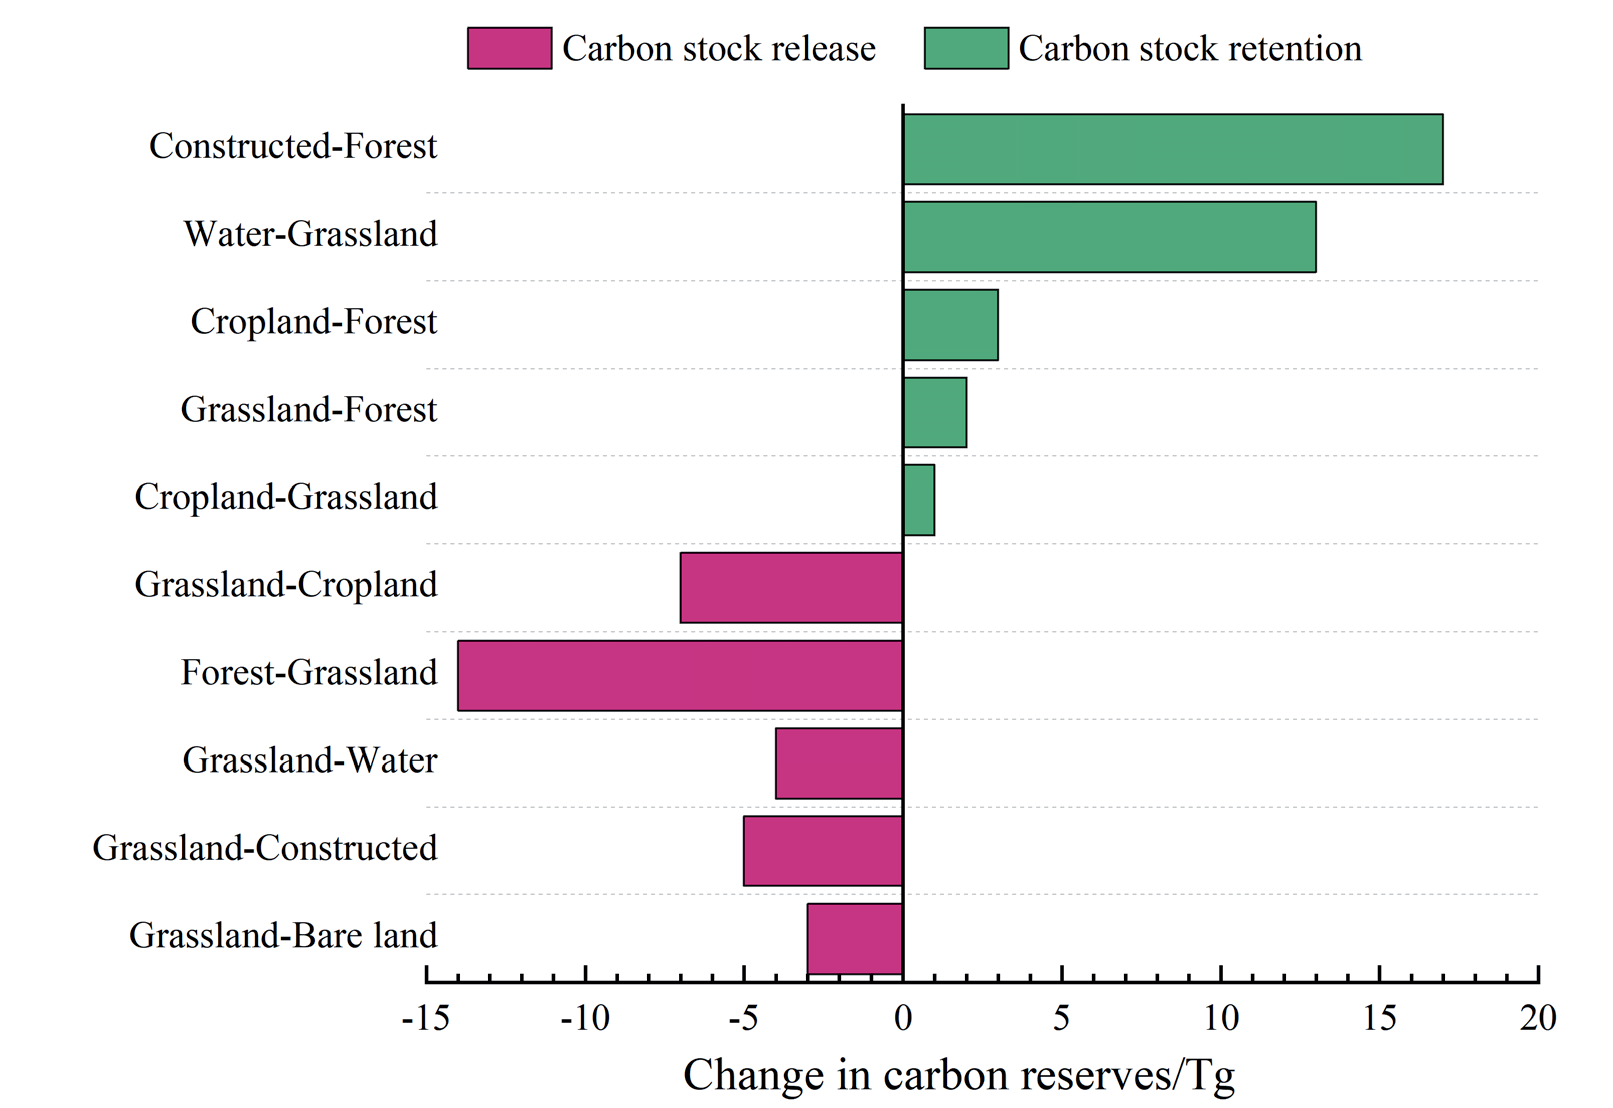
Fig. 8 shows that the conversion of water bodies to grasslands and unused land to forests is the main reason for carbon sequestration, with net carbon releases of 12.8 Tg and 16.7 Tg, respectively. The main reasons for releasing carbon stocks are from grassland to cultivated land, grassland to construction land, and grassland to forest land, with net carbon stocks released of 6.9 Tg, 5.1 Tg, and 14.2 Tg, respectively.
The average carbon density decreases from the middle to both ends, especially in the north, where the carbon density is the lowest. Among them, farmland, forest land, and grassland contribute the most to the carbon density of Manas County. The spatiotemporal trends of carbon sources and sinks in Manas County from 2000 to 2020 are relatively consistent, mainly related to increased arable land, construction land, grassland, and decreased forest land. Carbon sinks are mainly distributed in the central part of Manas County and near Baojiadian Town in Manas Town. The carbon source areas are mainly distributed in the southwest and central regions of Manas County.
Correlation Analysis of Driving Factors for Carbon Storage in Manas County
Analysis of Driver Factor Detection Results
To explore the influencing factors of carbon storage, this study used geographic detector tools to select 10 influencing factors from 3 categories to investigate the factors affecting carbon storage. Treat carbon storage as the dependent variable and climate impact factors, social impact factors, and terrain impact factors as independent variables. The research results of the geographic detector are shown in Table 4: The factors affecting carbon storage in Manas County, in descending order, are population density, GDP, NDVI, rainfall, secondary roads, DEM, temperature, water system, slope, and night light remote sensing. The most significant factors affecting carbon storage are population density, GDP, NDVI, rainfall, and secondary roads, among which the driving force is strong.
Analysis of Interaction Detection Results of Driving Factors
The influencing factors do not independently affect carbon storage, but rather interact directly with each other and affect the carbon storage in the study area in various ways. As shown in Table 5, the correlation between water system and carbon storage is 0.1086, the influence of temperature on carbon storage is 0.1101, and the interaction detection of the two factors shows a correlation of 0.2904 with carbon storage. The interaction detection has the strongest impact on NDVI and urban GDP, with a correlation of 0.5076 with carbon storage. Next is the interaction between NDVI and slope, with a correlation of 0.4920 with carbon storage.
Impact of Climate Factors on Carbon Storage
The single climate impact factor has a significant impact on carbon storage, among which is the precipitation factor, which has a significant impact on carbon storage, reaching 0.2752. At the same time, the interaction between climate factors and other influencing factors also dramatically affects the carbon storage in Manas County, such as the non-linear enhancement of carbon storage when temperature, water system, and secondary roads work together, and the dual factor enhancement of slope, DEM, GDP, precipitation, and other factors. The precipitation factor and secondary roads, NDVI, and GDP show non-linear enhancement, among which the interaction effect of the precipitation factor and GDP factor on carbon storage reaches 0.4792. The precipitation factor and slope, water system, population density, etc., show dual factor enhancement.
Discussion
Dramatic Changes in LULC in Manas over the Last 20 Years Have Resulted in Significant Spatial and Temporal Divergence
In this study, there were significant changes in land use categories in Manas County from 2000 to 2020, mainly manifested as an increase in the number of cultivated land [30], with the most significant changes from 2000 to 2010, while the number of water bodies and grasslands remained unchanged. The results of Aynur Mamat’s [31] research on land use category changes in Xinjiang are consistent with this. The main reason for this change may be the excessive emphasis on fair distribution in the second round of land contracting in 1999, which led to the fragmentation of arable land. Some land parcels were not well utilized, and through later practice, people spontaneously carried out land consolidation activities, resulting in a small piece to large piece, multiple pieces to one piece model, increasing the area of arable land and food output. This result somewhat differs from the study of land use and land type change in Xinjiang conducted by Ma Lina [32]. This is because of the difference caused by the unique geographical advantages of Manas County. In the past 20 years, the grassland and water area in Xinjiang has shown a decreasing trend. However, the utilization of the unique resources in Manas County has made the study area stable. Secondly, the number of forests and unused land has decreased, which is consistent with the research results of Liu Q. et al. [33]. This also indicates that different stages of social development and policy guidance significantly impact on land use types.
Table 5.
Interactive detection results of carbon density facto.
The Calibrated Carbon Densities Changed Our Results Extremely Significantly
The average carbon density of the forest ecosystem in Manas County estimated in this study is 208.29 T/hm2. At the same time, Dai Li et al. [34] found that the average forest carbon density in Xinjiang is 205.72 T/hm2, indicating that the forest unit carbon storage in Manas County is the same. The soil organic carbon density in Manas County is relatively low compared to the whole of Xinjiang, which may be due to some cultivated land being transformed from unused land, resulting in low soil organic matter content and lower soil organic carbon density.
In this study, literature on ecosystem carbon storage from 2000 to 2020 was selected, and the relationship between precipitation data and biomass carbon density was used to correct the carbon density of the soil. The carbon density correction method is consistent with that of Zhou Rubo et al. [35]. This method uses the precipitation data of the study area to correct the carbon density, so we can obtain the accurate carbon density of the study area and then obtain the carbon storage data.
The overall carbon storage in Manas County from 2000 to 2020 showed a pattern of more in the southwest and less in the northeast. Over the past 20 years, total carbon storage has shown an increasing trend, especially in the central and northern regions of the Xinjiang Production and Construction Corps, where significant changes have occurred. The conclusion of Kui Luo et al. [36] is consistent with this conclusion. The main reason for this result is that in recent years, people have started to cultivate or construct unused land, and the changes in land use types have significantly increased the amount of carbon storage. The forest carbon storage in the research area shows a decreasing trend, which may be due to the expansion of arable land and construction land in recent years, leading to a reduction in the area of forest land, which in turn leads to a decrease in forest carbon storage. Moreover, the carbon density of forest ecosystems is also decreasing.
Analysis of Driving Mechanisms Affecting Carbon Stocks in Manas County
In this study, the driving factors affecting carbon storage include population density, urban GDP, and NDVI, and the socio-economic factors have an increasing impact on carbon storage [37], which is consistent with the results of Ningfei Wang’s [38] study. In recent years, due to the continuous development of society and the gradual improvement of the governance system, people have a clearer understanding of the rationalization of land use, and at the same time, carbon storage has been increasing [38, 39]. At the same time, NDVI and temperature showed a nonlinear enhancement relationship. NDVI and precipitation showed a double-factor enhancement relationship, indicating that temperature and precipitation also affect carbon storage to a certain extent, mainly because temperature and precipitation affect the evolution of land use and land type change closely, which affect the carbon density, and indirectly affect the total carbon storage [40].
Conclusions
This study evaluates the complex land-use status of Manas County in the last 20 years, corrects the carbon density data of Manas County with environmental variables, obtains accurate carbon stock data, and finally reveals the dominant driving mechanism of carbon stock evolution in Manas County using probes, which will guide future ecological protection and dual-carbon policies. The most obvious findings of this study are as follows: (1) The increase of cultivated land in Manas County in the last 20 years has been achieved at the expense of the reduction of forested and unused land development, which is most obvious in the central north of the study area. (2) Correcting the carbon density according to environmental variables, it was finally calculated that the carbon stock in Manas County in recent years showed an overall upward trend, and the distribution increased from southeast to northwest. The correction of carbon density is crucial for validating and parameterizing carbon models in China and globally. (3) In this study, we also explored the driving factors affecting carbon stocks, among which population density, urban GDP, NDVI, and other factors are closely related to carbon stocks. Determining the driving factors provides a direction for the subsequent allocation and rational use of carbon stocks. Also, it provides an important reference for the policy of carbon stocks in Xinjiang and the whole country.

