

Abbreviations
ESs, Ecosystem Services; ESSD, Ecosystem Services Supply and Demand; ESDR, Ecosystem Service Supply and Demand ratio; ESDRC, Ecosystem service supply and demand ratio of carbon sequestration; ESDRF, Ecosystem service supply and demand ratio of food production; ESDRS, Ecosystem service supply and demand ratio of soil conservation; ESDRW, Ecosystem service supply and demand ratio of water conservation; AQ, Air Quality; YRB, Yellow River Basin; DSDM, the Dynamic Spatial Durbin model.
Introduction
Ecosystem service (ESs) supply refers to the products and services provided by ecosystems to humans, while demand refers to the total consumption or use of these products and services by humans within a specific period and region [1]. To achieve sustainable environmental development, ensuring that the supply of natural ecosystem services can meet or even exceed human demand is essential. This balance helps to prevent ecological degradation or resource depletion.
In recent years, with the acceleration of urbanization and the increase in human activities, the pressures on society and ecosystems have significantly intensified [2]. This has led to substantial changes in regional ecological processes, structures, and functions, exacerbating the imbalance between the supply and demand of ecosystem services (ESs) [3] and negatively impacting AQ. In response to this issue, China released the "Outline of the Yellow River Basin Ecological Protection and High-Quality Development Plan" in 2021, which aims to promote the sustainable development of the environment in the YRB through ecological protection projects, industrial structure optimization, and the rational allocation of production factors [4]. However, current research on the impact and mechanisms of ecosystem service supply and demand (ESSD) balance on AQ remains limited. Understanding the spatiotemporal dynamics of ESDD in the YRB and assessing its impact on AQ is crucial for fostering harmonious interactions between human and natural systems [5].
Current research on ecosystem services (ESs) covers various aspects, including the evaluation of Ess [6], simulation and prediction [7], driving mechanisms [8], trade-offs and synergies [9], and the supply-demand relationship [10]. Specifically, ecosystem service supply-demand (ESSD) studies have primarily focused on supply-demand calculations, spatiotemporal distribution, and their application areas. The methodologies used include land-use estimation [11], ecological process simulation [12], data overlay [13], and expert judgment [14]. Additionally, applying models such as InVEST and ARIES has opened new avenues for spatial analysis in ESSD research.
In recent years, an increasing number of researchers have explored the complex relationships between natural and socio-economic systems from the perspective of ecosystem service supply-demand (ESSD), aiming to understand better and harmonize their interactions to promote sustainable development [15]. The research has mainly focused on the spatiotemporal patterns of ESSD [16], spatial matching [17], and its influencing factors [18]. Several studies have pointed out that socioeconomic development has a significant impact on ESSD balance, with urbanization [19], land-use change [20], and population growth [21, 56] being considered vital determinants. Although these studies reveal the intricate relationship between human activities and ESSD balance, there is still a lack of systematic investigation into the more specific connections between ESSD and AQ.
Moreover, some studies have indicated that ecosystem services (ESs) directly and indirectly impact AQ. For instance, carbon sequestration reduces atmospheric greenhouse gas concentrations by absorbing and storing carbon dioxide through plants, effectively mitigating climate change and indirectly improving AQ [22, 23]. In this process, ecosystems such as forests, wetlands, and grasslands play a crucial role in maintaining the balance of the global carbon cycle [24]. In addition, practices like ecological and sustainable agriculture contribute positively to the environment by reducing air and water pollution, particularly by minimizing the use of fertilizers and pesticides and managing agricultural waste. These practices help maintain the health and stability of ecosystems [25]. Soil conservation measures include preventing soil erosion and enhancing soil structure, reducing greenhouse gas emissions, improving crop yields, and strengthening the ecosystem’s resilience to climate change [26]. By maintaining a healthy hydrological cycle, water resource management reduces particulate matter dispersion and ensures the sustainable development of agriculture, industry, and ecosystems [27]. However, existing literature tends to focus on analyzing the environmental impacts of specific ecosystem services (such as carbon sequestration or water resource management), with less attention given to the complex spatiotemporal relationships between ESSD and AQ from an integrated perspective.
In summary, although existing research has addressed the relationship between ESs and climate change, much of it focuses on correlation analysis of specific factors or the environmental effects of individual ecosystem services, lacking an exploration of the complex spatiotemporal relationships between ecosystem service supply-demand balance and AQ from a holistic perspective [28]. Therefore, systematically studying how ESSD influences the atmospheric environment across different temporal and spatial scales holds significant academic and practical value. This paper constructs a theoretical framework based on the "social-economic-natural" composite ecosystem, and by integrating a dynamic spatial econometric model, it deeply explores the relationship between ESSD and AQ. This approach expands the research perspective in the field and provides new theoretical and empirical support for regional ecological protection and sustainable development.
As one of China's critical ecological and economic zones, the YRB faces dual environmental protection and economic development challenges. In their pursuit of economic growth, cities along the river often overlook the finite nature of resources, with demand for natural resources far exceeding the environment's supply. This imbalance leads to the degradation of ESs functions and has an irreversible negative impact on AQ. Therefore, evaluating the spatiotemporal changes in YRB's ecosystem service supply-demand balance and thoroughly investigating its effects on AQ are essential prerequisites for achieving regional ecological protection and high-quality development goals. This study enables policymakers to promote sustainable development goals (SDGs) while driving economic growth, ensuring the stability of regional ecosystems and the sustainability of the environment. It also offers management strategies for balancing ecological protection with economic development, helping to address climate change and enhance resource utilization efficiency.
The contributions of this study are as follows: (1) This research introduces a theoretical framework based on the "social-economic-natural" composite ecosystem process to analyze the impact of ESSD on AQ. By deeply exploring the spatiotemporal evolution of ESSD in the YRB, the study advances the understanding of the complex relationship between ESs and AQ. (2) From the perspective of spatial economics, the study employs the Dynamic Spatial Durbin Model (DSDM) to investigate the short- and long-term effects of the ESSD on AQ as well as its spatial spillover effects. (2) In contrast to most previous studies based on provincial or city-level data, this study refines the spatial unit by covering 500 counties in the YRB, providing a more precise understanding of inter-regional interactions and spatial dynamics. The paper offers innovative policy recommendations based on the findings, providing new perspectives for regional environmental management and policy-making.
Analysis Process and Logic
Natural systems offer a wide range of beneficial functions and processes to both humans and the environment, upon which human society depends and makes use. The more balanced the supply and demand of ESs are, the more efficient environmental regulation will be, thereby ensuring the stability and sustainability of economic activity. However, excessive development and the destruction of the ecosystem can result in demand far exceeding natural supply, potentially depleting resources and ultimately influencing AQ. Therefore, evaluating environmental sustainability reports is of crucial importance for determining whether regional socio-economic development is in harmony with the natural environment (Fig. 1).
Carbon cycling services in ecosystems play a crucial role in the global carbon balance [29]. Ecosystems such as forests, wetlands, and oceans absorb carbon dioxide from the atmosphere through photosynthesis and store it in organisms and soil, effectively reducing greenhouse gas concentrations and mitigating global warming [30]. However, when these carbon stores are released due to human activities such as deforestation, wetland degradation, or the burning of fossil fuels, the greenhouse effect is intensified. As CO2 emissions increase and climate change progresses, the structure and functions of ecosystems may be disrupted, further deteriorating AQ.
The influence of food production services on AQ showcases diversity. On the supply side, contemporary agricultural activities such as cultivation, fertilization, and pesticide application directly or indirectly impact AQ [31]. Additionally, deforestation for expanding farmland not only undermines the carbon absorption capacity of forests but also releases the previously stored carbon. On the demand side, driven by the global population growth and changes in food consumption patterns, the application of fertilizers and pesticides has augmented, together with the demand for long-distance food transportation. These factors jointly increase the concentrations of methane, nitrogen oxides, and carbon dioxide in the environment [32].
Soil and water conservation services mitigate soil erosion and preserve soil fertility and structure, thereby safeguarding water resources from contamination and minimizing natural disasters like floods and landslides. Additionally, augmenting vegetation coverage not only curtails soil erosion but also enhances AQ, sequesters carbon dioxide, and offers crucial ecosystem services and habitats [33, 34]. On the demand side, global population growth and urbanization have intensified the demand for high-quality soil. Urban expansion modifies land cover, disrupts soil structure, and reduces the soil's capacity to regulate moisture and nutrients. Furthermore, the expansion of intensive agriculture has augmented the utilization of fertilizers and pesticides, exacerbated soil erosion, and disturbed the hydrological balance of surface water and atmospheric water [35].
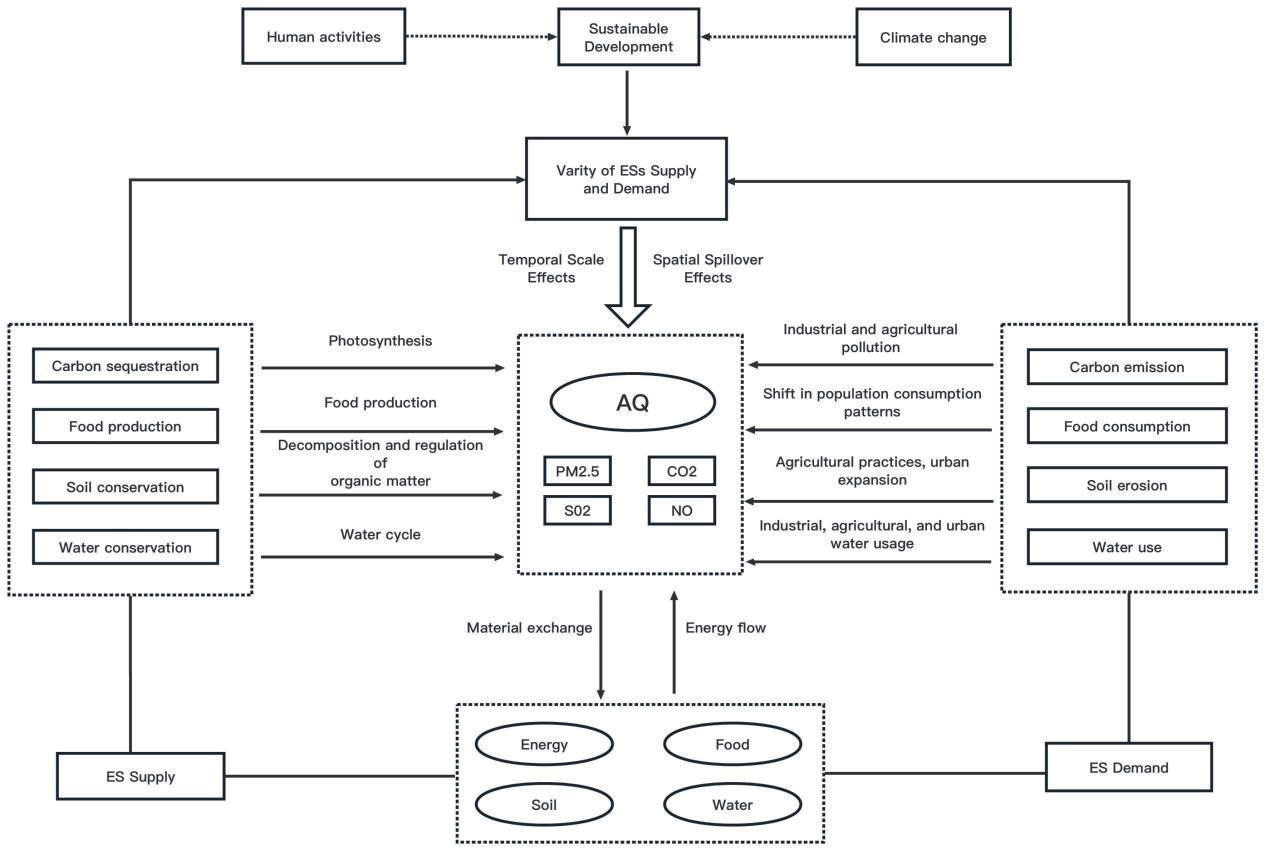
Water conservation services have an impact on AQ through both environmental and socio-economic factors. On the supply side, forest transpiration plays a crucial role in influencing rainfall patterns, while wetlands act as natural filters and purifiers of water flows, simultaneously replenishing groundwater. These essential processes not only increase air humidity but also regulate temperature, indirectly leading to improvements in AQ [36]. On the demand side, industrial water usage and pollution result in the release of harmful substances into the ground through atmospheric deposition, which has an impact on AQ. Agricultural irrigation involves significant extraction of groundwater, which affects plant growth and surface water cycles, subsequently influencing atmospheric water vapor content and temperature regulation.
Study Area and Data Sources
Study Area Overview
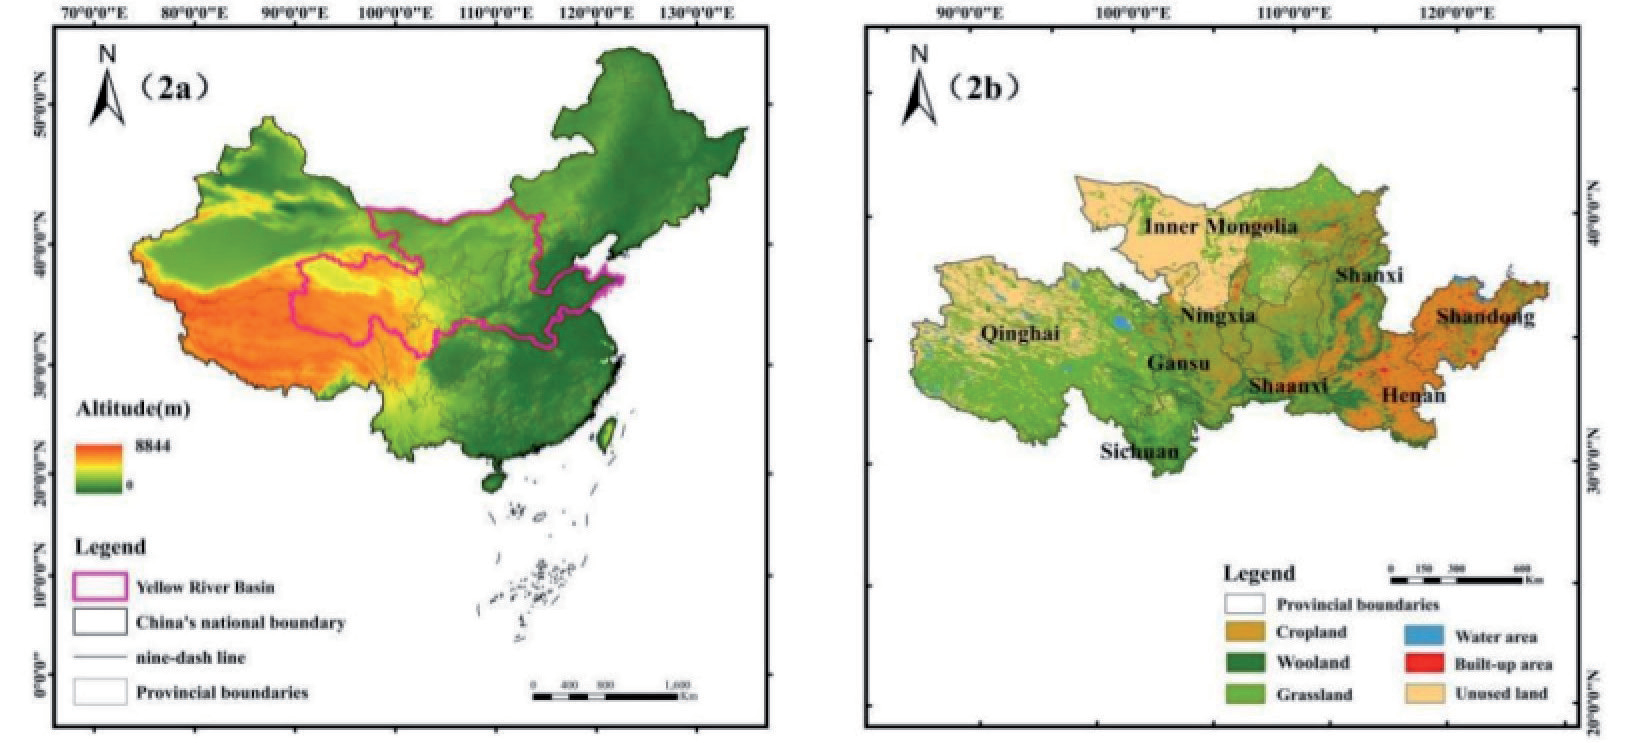
The YRB, situated in China within the latitude range of 32° to 41° north and the longitude range of 95° to 119° east, encompasses nine provinces (Fig. 2). By the end of 2022, the region will support 30% of China's population and contribute 26% to its GDP. It is a significant energy and chemical production hub and plays a crucial role in grain production. The region's ecosystems are susceptible to damage due to the complex interaction between diverse natural factors and substantial human activity. This study takes 500 districts and counties in the YRB as research samples to systematically explore the dynamic impact of the balance between the supply and demand of four types of ecosystem services on AQ.
Data Sources
This study incorporates geographical data such as land cover/land use, potential evapotranspiration, and other relevant factors to estimate ecosystem service supply. The socio-economic data used for calculating the demand for ESs encompasses population numbers, food consumption, water resource usage, energy consumption, and emissions of industrial wastewater and particulates. Other types of data are used as control variables. The entropy approach calculates a comprehensive index ranging from 0 to 1. This index combines four different types of natural circumstances and reduces their impact on the model. Annual datasets from 2010 to 2020 are utilized for a comprehensive assessment of changes and trends during the study period (Table 1).
Research Method
Quantifying for the ESSD
Carbon Sequestration Services
Supply: Carbon sequestration services encompass the capacity of ecosystems to capture atmospheric carbon dioxide via vegetation and soil mechanisms, stabilizing it in natural reservoirs. This process lowers carbon levels in the environment, helping mitigate climate change [37]. This research uses the InVEST model's carbon storage module for its estimation purposes. The calculation is based on LULC and its corresponding carbon density and includes all the surviving plant parts above the soil as part of the aboveground biomass. Calculated as follows:
In equation (1), CSx indicates the grid's yearly average carbon sequestration, measured in Mg/ha. The terms Cx,above, Cx,below, Cx,soil, and Cx,dead denote the carbon storage in aboveground, belowground, soil, and human sources, all measured in Mg/km².
Demand: Assessing the need for carbon storage services involves measuring and analyzing carbon emissions from human activities. In this study, calculations are performed using the carbon emission factor method.
In equation (2), the carbon storage requirement of grid x, denoted as CDx, is quantified in tons. Equation (3) represents the carbon emissions denoted by ACD and the total population represented by TPOP. EC denotes the population at the end of the year. NVC represents the net energy calorific value, set at 0.0209 TJ/t. EF measures the amount of carbon dioxide or other greenhouse gases emitted per unit of energy or activity. The value is 98.3 t/TJ [38].
Food Production Services
Supply: The ecosystem's ability to supply food and agricultural products through agricultural activities is known as food production services. This study utilizes NDVI data as an accurate indicator of food production capacity. It calculates the food supply in the research region by distributing the total food production based on the ratio of the grid NDVI to the overall NDVI of cultivated land [39]. The formula is as follows:
FSx stands for the grid's food supply service in equations (4) and (5). NDVImean indicates the average NDVI value across all grids, while NDVIx, cropland, refers to the NDVI value for arable land in grid x.
Table 1.
Data sources and descriptions.
Demand: To calculate the per capita energy intake needs, determine each individual's dietary requirements and use the energy conversion table. The formula is as follows:
The population density, expressed in kJ/km², is multiplied by the energy demand based on per capita food intake to get the average food energy demand for grid x in equation (6).
Soil Conservation Services
Supply: The RUSLE model is utilized for quantifying soil conservation, employing the following formula:
In equation (7), several elements define the supply of SSx: rainfall erosivity (R), soil erodibility (K), computed based on DEM, the crop management component (C), and the conservation practice factor (P).
Demand: Reducing soil erosion in locations where soil erosion is a risk is the driving force behind the demand for soil retention services.
SDx is the demand for soil retention services, represented in the formula found in equation (8).
Water Conservation Services
Supply: The InVEST water yield model deducts the actual evapotranspiration from the rainfall to determine the quantity of water generated. The water yield supply is defined as the amount of water that a grid cell can deliver [40].
Demand: The entire amount of water used for household, industrial, agricultural, and ecological uses is included in the demand for water resources. This total demand is calculated by multiplying the per capita water usage of each city and town, as reported in the water resources bulletin, by the population density.
In equation (9), WDx denotes the demand for water conservation services in grid x.
Ecosystem Services Supply and Demand Ratio
Formula (10) establishes a connection between the availability of ecological services and human demand. This allows us to determine if there is an excess or shortage of specific categories of ecosystem services [41].
In Equation (10), ESDRk denotes the supply-demand ratios. ESkSis the actual demand amount of the ESs; ESkD is the actual supply amount of the ESs; ESkSmax is the highest supply amount of a certain ESs in the study area; ESkDmax is the highest demand amount of a certain ESs in the study area. An ESDR value greater than 0 indicates an excess of supply compared to demand; an ESDR value less than 0 shows a supply shortage compared to demand; and an ESDR value of 0 indicates a balance between the supply and demand of ESs.
Level of AQ
Current studies lack a unified standard for measuring regional AQ. This study references relevant research and selects PM2.5, SO2, NO, and carbon emissions to construct an environmental pollution evaluation index system. The entropy method integrates these factors into a composite index ranging from 0 to 1, used to assess regional environmental pollution levels. A lower AQ index value indicates better regional AQ.
Spatial Econometric Model
Moran's I Test
Moran's I index evaluates both the spatial lag correlation and the spatial error correlation of the research object. This metric is frequently employed to assess spatial autocorrelation. The formula for its calculation is as follows:
In equation (11):
Dynamic Spatial Durbin Model
DSDM integrates the spatial dependence of the spatial econometric model with the temporal dependence of the dynamic model, thereby effectively extending the conventional spatial and temporal models [42]. The YRB region encompasses numerous ecological and administrative areas where ESs interact with each other. Furthermore, changes in environmental systems and the accumulation of atmospheric conditions often exhibit time-lag characteristics. Therefore, more is needed to solely examine the relationship between ESSD and AQ from either a temporal or spatial perspective. Utilizing DSDM facilitates a more in-depth analysis of the dynamic impact of ESSD on AQ, encompassing both short- and long-term effects. This is essential for devising effective environmental management and pollution control policies in the YRB. Consequently, a DSDM was created in this research to comprehensively examine the influence of the four categories of ESDR on AQ.
In equation (12): Y(i,t-1) represents the dependent variable lagged by one period; W represents the spatial weight matrix; Xit represents the ESDR of region i at time t; Zit represents the control variables of region i at time t. α and βrepresent the estimated coefficients. vi represents the regional effects, ut represents the time effects, εitis the error term.
Results
Characteristics of Ecosystem Services Supply and Demand
The YRB is a significant agricultural and pasture zone in China and a vital industrial hub for energy, chemicals, and raw materials. Between 2010 and 2020, the amount of supply, consumer demand, and equilibrium for ESSD for the four categories of ESs in the YRB show considerable variations and have seen noticeable shifts. More precisely, the items are as stated:
Characteristics of Supply and Demand for Carbon Sequestration Services
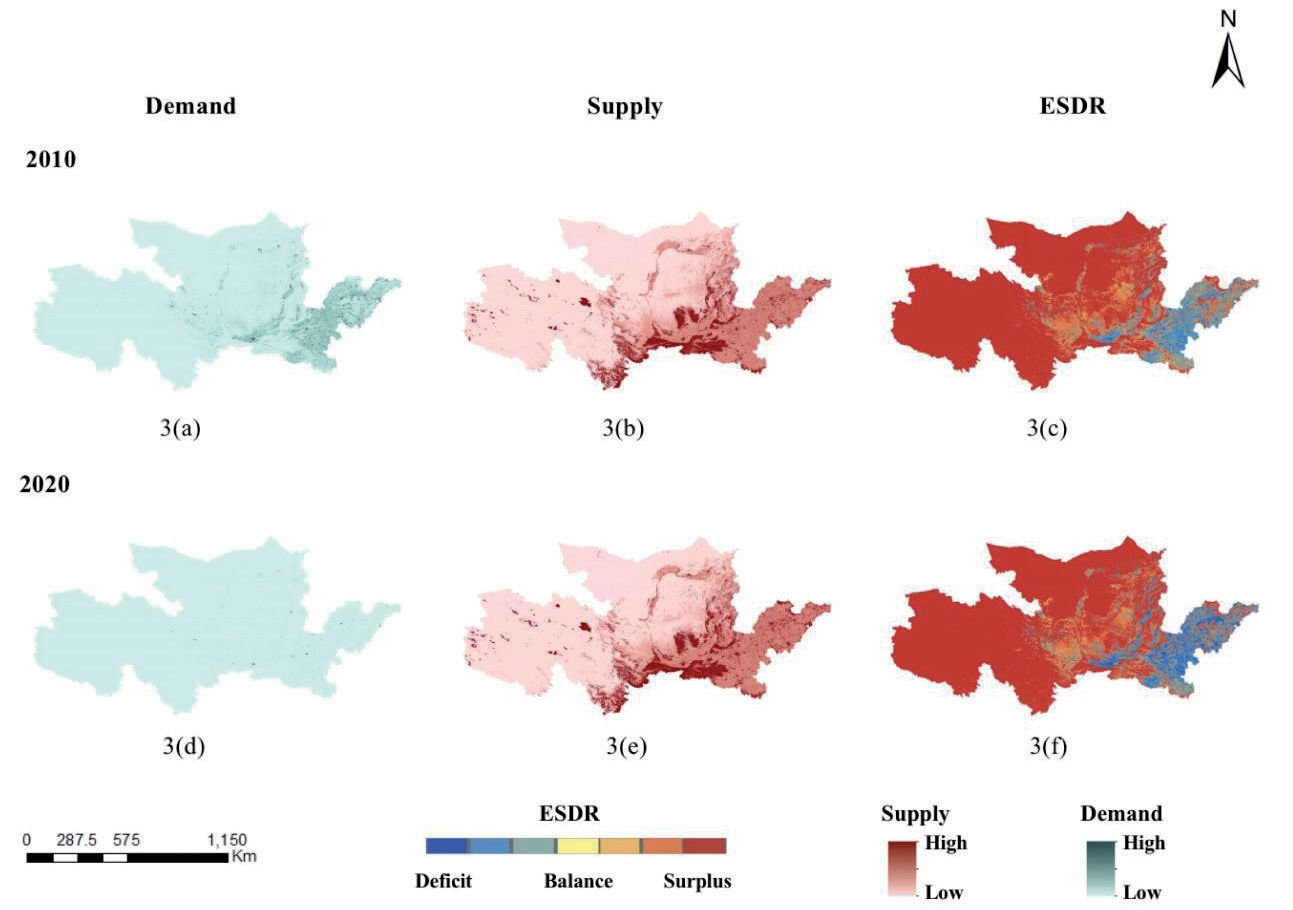
Notable fluctuations in the availability and need for carbon sequestration services in the YRB were noted from 2010 to 2020. In 2010, the central and eastern parts of the basin, such as Henan and Shandong, had the most significant demand for carbon sequestration services, as shown in Fig. 3(a). On the other hand, the northern regions, including Inner Mongolia and Shaanxi, had relatively low demand. By 2020, the overall demand had decreased, as illustrated in Fig. 3(d), with relatively higher demand still observed in the southeastern regions compared to the western and northern areas. Regarding supply, Fig. 3(b) demonstrates that in 2010, the central and southeastern regions had the highest carbon sequestration capacity, while the western and northern areas, such as Gansu and Inner Mongolia, had lower carbon sequestration capacities. By 2020, as shown in Fig. 3(e), the carbon sequestration capacity had significantly increased in the southeastern and central regions, with little change in the western and northern areas, where the capacity remained low. From a supply-demand balance perspective, in 2010, most areas of the YRB had a surplus of supply over demand, especially in the central and western regions, as depicted in Fig. 3(c), while some areas in the southeast had a deficit. By 2020, as shown in Fig. 3(f), the surplus areas had decreased, with more regions showing a balanced supply-demand state, and the deficit areas in the southeast had increased, indicating a rise in demand.
Characteristics of Supply and Demand for Food Production Services
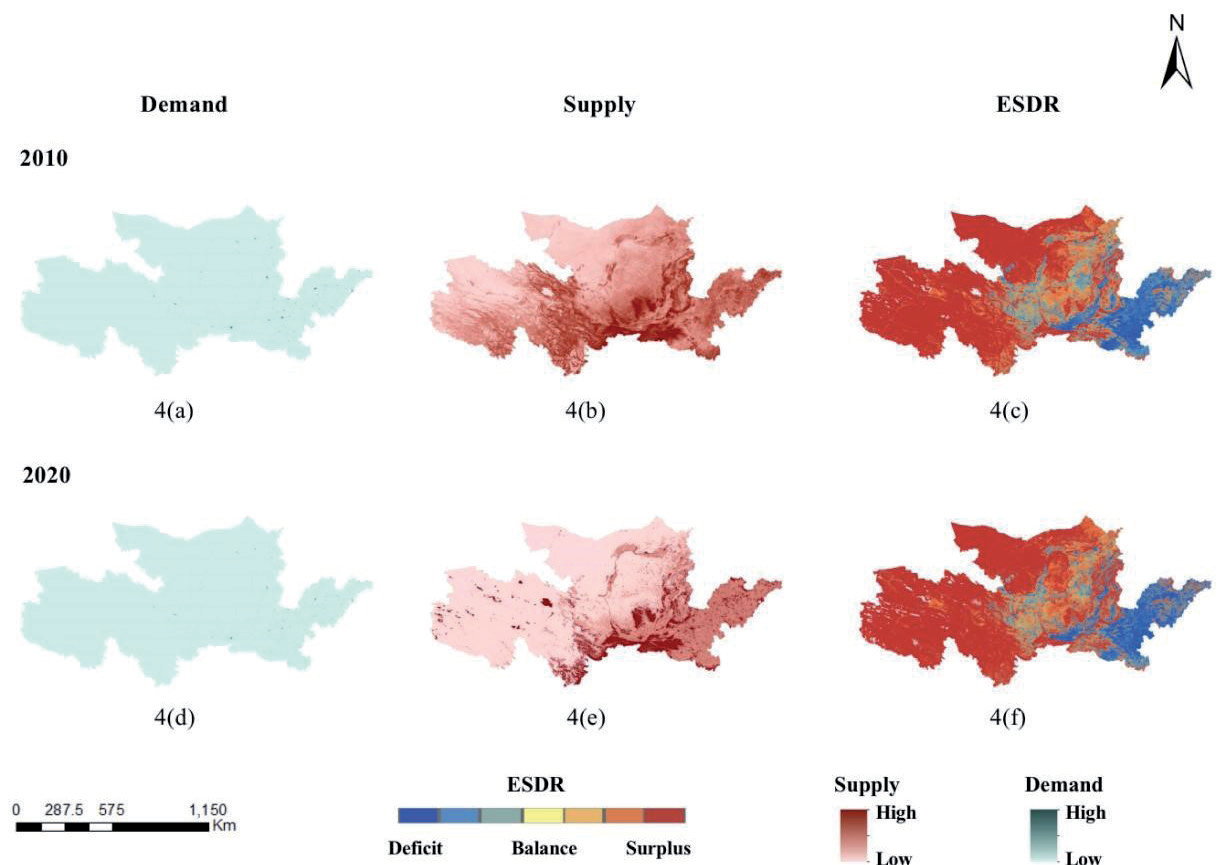
Between 2010 and 2020, the overall demand for food in the YRB increased. The central and southeast regions primarily experienced high demand, whereas the western and northern regions had relatively low demand. As depicted in Fig. 4(a), in 2010, the central and southeastern regions of the YRB were the primary areas for food supply. By 2020, as illustrated in Fig. 4(b), the food supply in the central and southeastern regions had significantly increased, whereas the supply in the western and northern regions had improved but remained relatively low. From a supply-demand balance perspective, in 2010, the central and western regions exhibited a noticeable supply surplus, where supply exceeded demand (Fig. 4(c)). However, by 2020, the degree of supply surplus in these regions had weakened (Fig. 4(f)). At the same time, in low-supply areas such as Shandong and Henan, the food demand further exceeded production capacity, exacerbating the deficit situation. Some regions in the central and southeastern areas showed a trend towards a balanced supply-demand relationship, indicating that during the process of increasing demand, the supply growth in these areas was relatively stable and able to meet the continuously increasing demand.
Characteristics of Supply and Demand for Soil Conservation Services
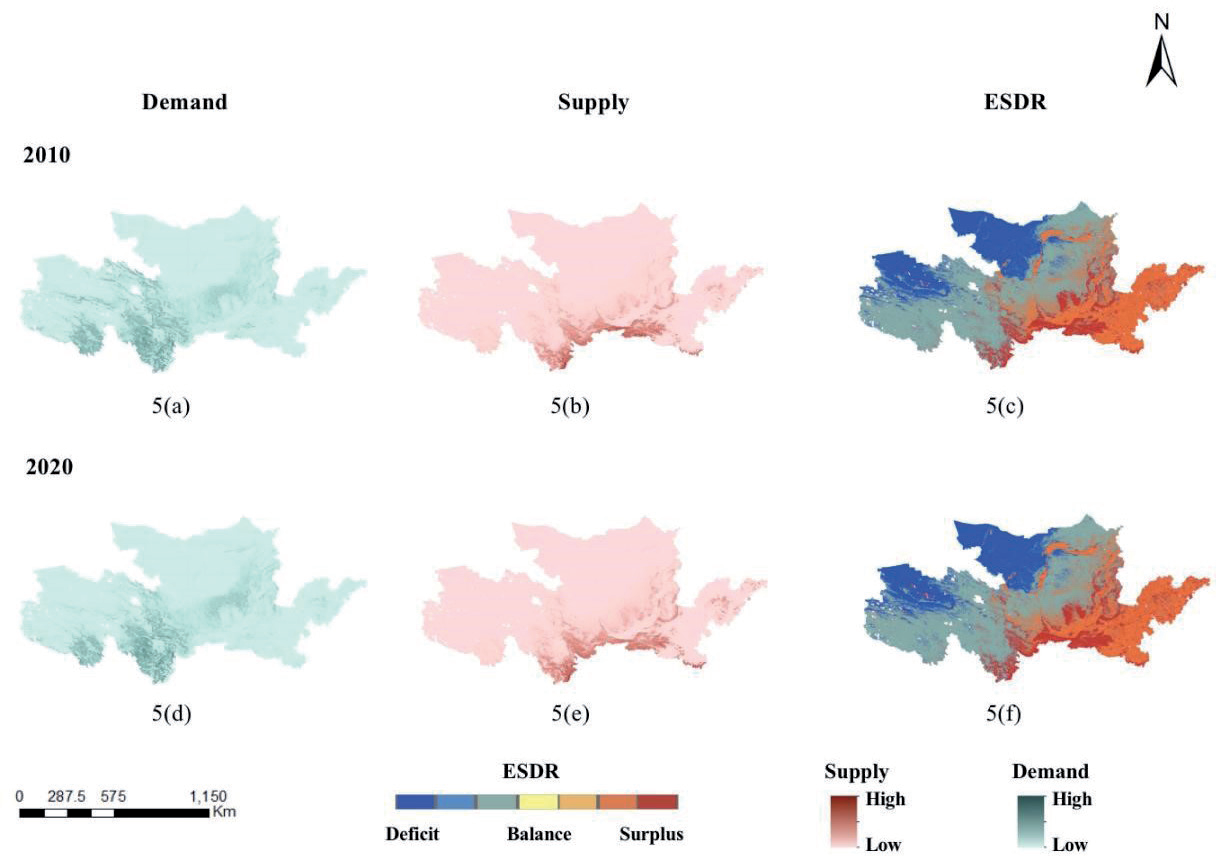
Between 2010 and 2020, there was a rise in the total need for soil conservation services in the YRB. The central and eastern regions, such as Henan and Shandong provinces, were the primary locations for high-demand areas. (Fig. 5(a) and 5(d)). During this time frame, there was a noticeable rise in soil erosion in the YRB, resulting in an increasing need for soil conservation services. Conversely, the western and northern areas exhibited a shallow requirement for soil conservation. Between 2010 and 2020, there was an overall rise in the provision of soil conservation services in the YRB. The locations with a high supply were primarily concentrated in the western and southern regions, as shown in Fig. 5(b) and 5(e). While the supply levels in the central and eastern regions saw improvements, they remained relatively low compared to those in the southern and western regions. The center and southern portions of the YRB showed more red areas from the standpoint of supply-demand balance, suggesting that supply exceeded demand in these locations (Figs 5(c) and 5(f)). In contrast, large blue zones were detected in the western and northern provinces, including Inner Mongolia, Gansu, and Ningxia. These places have substantial soil erosion because the requirement for soil conservation services exceeds the available supply.
Characteristics of Supply and Demand for Water Conservation Services
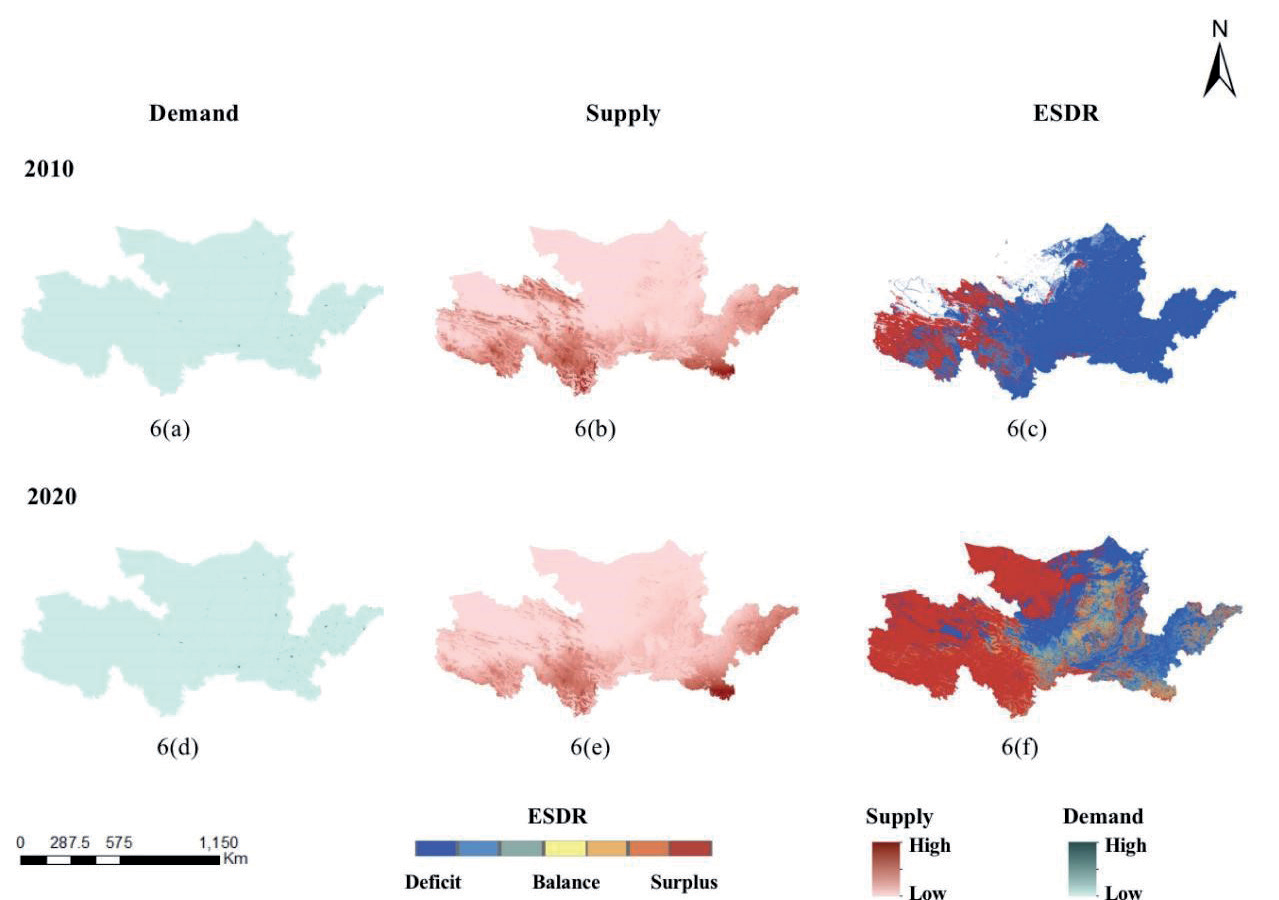
Between 2010 and 2020, the overall demand for water resources in the YRB increased. The central locations with a high demand for water resources were primarily in the east and central regions, namely in provinces like Henan and Shandong. These areas are known for their dense population and frequent economic activity, as seen in Figs 6(a) and 6(d). In contrast, the western and northern regions, with lower population density and fewer economic activities, exhibited relatively lower demand for water resources, although there was still an overall increase. Nevertheless, the YRB saw a substantial decrease in its water resource availability. Primarily, locations with abundant supply were situated in the western and southern areas, including Qinghai Province, which marks the starting point of the YRB. These regions have abundant precipitation and snowmelt water, along with good vegetation cover, making them rich in water resources (Figs. 6(b) and 6(e)). Conversely, parts of Inner Mongolia and Shanxi Province showed lower supply levels. From a supply-demand balance perspective, most areas of the YRB in 2010 were shown in blue (Fig. 6(c)), indicating that demand far exceeded supply, particularly in the central and lower sections of the basin. By 2020, the balance levels in the middle and lower reaches had significantly improved (Fig. 6(f)), but there remained a challenge of water supply not being able to satisfy the increasing need.
Analysis of the ESDR and AQ
Fig. 7 illustrates the changes in the mean values of AQ and the four types of ESDR in the YRB from 2010 to 2020. It can be observed that the four types of ESDR exhibited significant fluctuations in different years. The mean values of ESDRC and ESDRS mostly fluctuated between 0.2 and 0.4, indicating that supply slightly exceeded demand. The mean value of ESDRF fluctuated around the X-axis, showing a relative balance between supply and demand. ESDRW had negative values for most years and exhibited larger fluctuations, indicating that supply was insufficient to meet demand. From 2010 to 2020, the AQ exhibited a fluctuating rising trend, with a notable increase occurring between 2015 and 2018, showing a rise in air pollution levels in the area.
The results show the following by examining the temporal characteristics of ESDR in the research region using kernel density analysis: The kernel density results for ESDRC indicate relatively small variations, maintaining a bimodal "M" shape, which demonstrates a trend from clustering to dispersing. Over time, the peak values gradually shift from -0.2 to 0.6, suggesting an improvement in the supply-demand relationship. For ESDRF, the kernel density results display a slight dispersion trend. As time progresses, the kernel density curve gradually shifts to the right, with the central peak moving from 0 to 0.5, also indicating an improvement in the supply-demand balance. The supply-demand ratio analysis for ESDRS reveals a clear clustering trend, transitioning from a small peak close to 0 in 2010 to a main around 0.8 in 2020. This indicates a yearly improvement in the supply-demand relationship for soil services. ESDRW changes display a more complex pattern, with irregular fluctuations starting with initial dispersion, moving to clustering, and then leading to further dispersion. These fluctuations reflect the dynamic balance of ESDR in the region, likely influenced by various natural and anthropogenic factors.
Impact of ESDR on AQ
Model Selection Test
Before the regression analysis, the Moran I test for the residual of ordinary least squares (OLS) regression was conducted using the geographical distance matrix. The findings in Table 2 demonstrate that the model's residuals exhibit noteworthy spatial autocorrelation. The spatial interaction term is incorporated into the analysis to address this issue. Subsequently, spatial econometric models are employed to investigate the spatio-temporal effects of ESDR on AQ.
We conducted several statistical tests on the model, as shown in Table 3. The Hausman test results indicate significant spatial and temporal fixed effects, making their inclusion in the model necessary. Additionally, all LM tests, including LM error, LM lag, robust LM error, and robust LM lag, were significant, confirming the appropriateness of using the Spatial Durbin Model. The significance of LR-Test-lag and Wald-Test-lag based on spatial lag rejects the possibility of simplifying the model to a spatial lag form. Similarly, the significance of LR-Test-error and Wald-Test-error based on spatial error eliminates the option of simplifying the model to a spatial error form. Therefore, the selection of the Spatial Durbin Model as the final analytical method was appropriate. The Durbin-Watson test result of 0.7811 indicates the presence of autocorrelation issues in the model. To address this, the Yt-1 term was added to improve both the precision and explanatory power of the model. Collectively, these tests validate the robustness and reliability of the Spatial Durbin Model in analyzing the impact of ESDR on AQ.
DSDM Regression Results Analysis
This research used econometric models to investigate how ESDR affects AQ in different counties of the YRB. OLS and the Spatial Durbin Model (SDM) served as references, while the DSDM was used as the final regression model. The spatial weight matrix defined by geographical distance was employed for the analysis. The specific model settings refer to formula (11), and the regression results are detailed in Table 4. Table 4 presents detailed regression results, indicating that the significant parameter ρ suggests strong spatial spillover effects on AQ. This suggests that a decline in AQ in one area negatively affects the environment in neighboring areas. Because the SDM accounts for the spatial effects of both dependent and independent variables, the coefficient WXij does not directly reflect the marginal effect of the independent variable on the dependent variable. Hence, this research used the partial derivative technique of spatial econometrics proposed by LeSage & Pace to separate the overall impact into direct, indirect, and total effects. Table 4 illustrates significant spatiotemporal differences in the impacts of the four types of ESDR on AQ. Specifically:
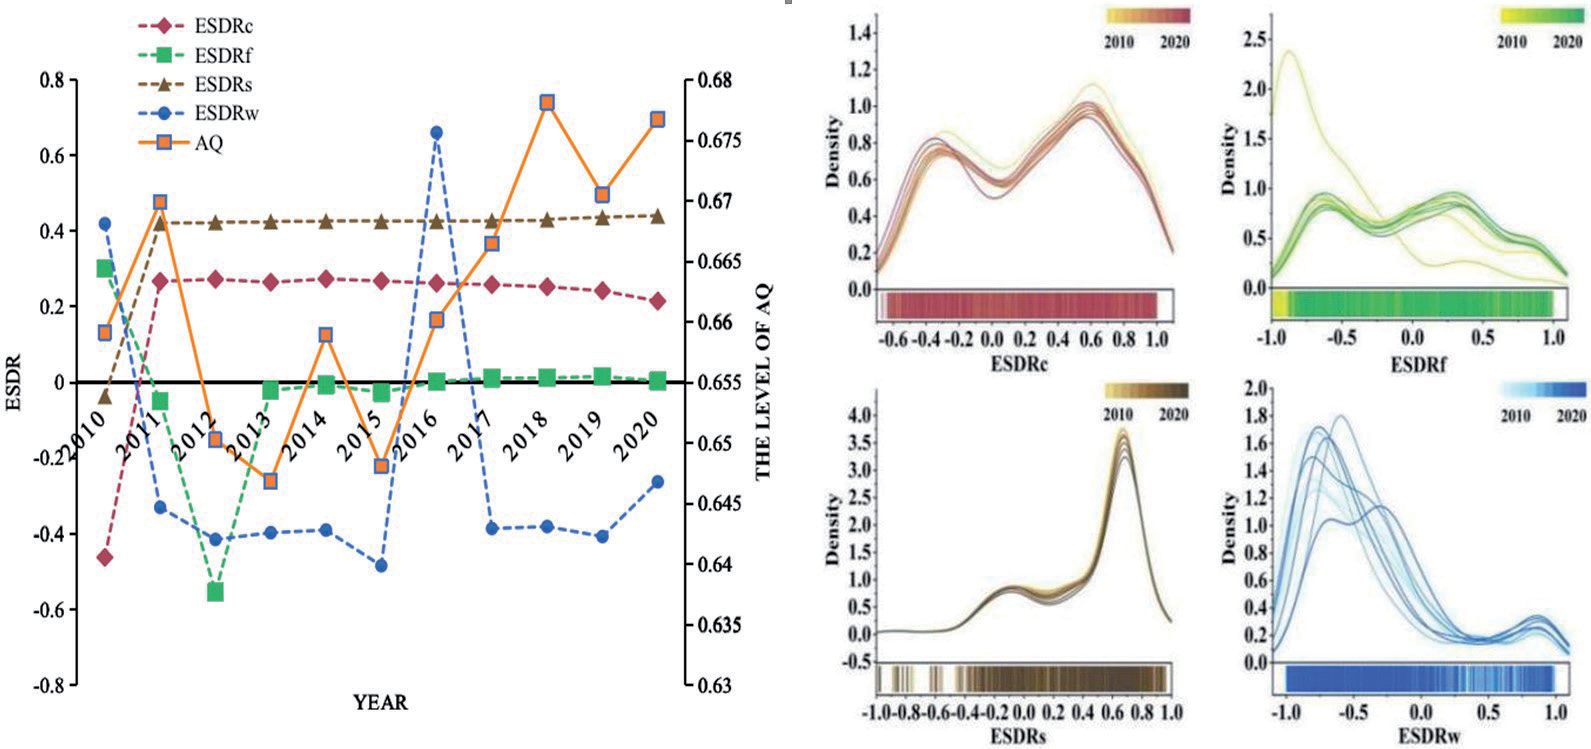
Table 2.
Moran’s I Test Results.
| Year | 2011 | 2012 | 2013 | 2014 | 2015 | 2016 | 2017 | 2018 | 2019 | 2020 |
|---|---|---|---|---|---|---|---|---|---|---|
| Moran’s I | 0.15*** | 0.16*** | 0.16*** | 0.15*** | 0.17*** | 0.16*** | 0.13*** | 0.16*** | 0.13*** | 0.13*** |
| T | 50.59 | 50.89 | 50.84 | 48.84 | 54.28 | 52.29 | 43.35 | 52.73 | 43.07 | 44.58 |
Table 3.
Test Results for Spatial Model Selection.
ESDRC: In the short term, the direct coefficient of ESDRC is -0.0344, which is statistically significant. However, the indirect coefficient is not statistically significant. This implies that a higher balancing level of ESDRC results in a reduction of environmental pollutants in the region without any notable impact on surrounding regions. In the long term, the direct coefficient of ESDRC is -0.0529, and the indirect coefficient is 0.0349. This suggests that in the long term, increased ESDRC balance levels improve local AQ but have a negative impact on the surrounding area. This result may be attributed to changes in land use, industrial layout, or policy adjustments associated with the increase in carbon sequestration services. While these improvements enhance local AQ, they also affect the environmental status of surrounding areas [43].
ESDRF: In the short term, the direct coefficient of ESDRF amounts to 0.0092, suggesting that the higher the equilibrium level of ESDRF is, the more severe the environmental pollution in the region becomes. This could be attributed to augmented production activities, encompassing the utilization of fertilizers and pesticides and energy consumption from agricultural machinery, resulting in a deterioration of AQ [44]. In the long term, the direct and total effect coefficients of ESDRF are both positive and significant. This suggests that a higher balance level of ESDRF over time leads to a decline in AQ within the region and its surrounding areas. This finding reflects the potential consequences of prolonged high levels of agricultural production, including resource overexploitation and the accumulation of environmental pollutants.
Table 4.
Analysis of model regression results.
ESDRS: Short-term effects of ESDRS on AQ are minimal. Conversely, the long-term ESDRS indirect coefficient is -0.0654, and the long-term direct coefficient is 0.0355. This suggests that although raising the ESDRS balance level has a detrimental influence on the immediate environment, it has a good effect on nearby places. Possible reasons for this include increasing vegetation cover and implementing soil conservation measures during the enhancement of soil conservation services might lead to resource overuse and heightened environmental pressure [45]. For instance, augmented irrigation, fertilization, and conservation approaches could result in excessive utilization of soil and water resources, exerting a negative influence on the environment. Additionally, the enforcement of soil and water conservation measures in the region can effectively curb the discharge of pollutants and erosive substances, thereby alleviating the adverse impact on the surrounding area. These measures not only enhance the AQ of adjacent areas but also offer an ecological buffer zone.
ESDRW: In the short term, ESDRS has no significant impact on AQ. However, in the long term, both the direct and total effect coefficients of ESDRS are positive and significant, indicating that increasing the balance level of ESDRS negatively affects the environment. This may be due to the efficient use of water resources promoting industrial and agricultural development within the region, but also leading to increased use of chemicals such as pesticides and industrial wastewater treatment chemicals, thereby affecting AQ. Additionally, reservoir construction may submerge large areas of land, impacting local ecosystems, and wetland restoration may require changes in land use, thus affecting AQ.
Discussion
Main Findings
This study utilizes the DSDM to reveal the spatiotemporal effects of the balance between the supply and demand of four types of ESDR on AQ in the YRB. Specifically, carbon sequestration services can significantly improve AQ in the short term by reducing greenhouse gas emissions through carbon absorption and storage. However, in the long run, an increase in the balance of carbon sequestration supply and demand may have adverse spillover effects on surrounding areas, potentially due to the pressures caused by resource allocation or the displacement of ecological services. Food production services have negative environmental impacts both in the short and long term, especially in the context of intensive agricultural production. The excessive use of fertilizers and pesticides, along with the high energy consumption of agricultural machinery, has led to the overexploitation of resources and the accumulation of pollutants. Soil retention services have no significant short-term impact on AQ, but in the long term, improving the supply-demand balance positively impacts neighboring regions while increasing environmental pressure locally. Finally, the balance of water retention services exerts a negative long-term effect on the environment. While the efficient use of water resources has promoted industrial and agricultural development, it has also increased the use of chemicals, which in turn has impacted AQ levels.
Comparison with Existing Research
This study confirms the direct impact of ESs on environmental quality and reveals the supply-demand balance's complex spillover effects across different temporal and spatial scales. This is a significant contribution that distinguishes it from existing literature.
Carbon Sequestration Services
Firstly, in terms of carbon sequestration services, the findings of this study indicate that carbon sequestration has a significant positive impact on AQ in the short term, consistent with the results of Daba & Dejene (2018). They pointed out that carbon sequestration significantly improves AQ by reducing carbon dioxide emissions, particularly in the context of forest restoration and increased vegetation cover [46, 47. This study further reveals that, over time, an increase in the balance of carbon sequestration supply and demand may lead to adverse spillover effects on surrounding areas. This phenomenon could be attributed to resource redistribution or land-use changes, intensifying ecological pressure or environmental degradation in neighboring regions. This finding addresses the gap in previous studies that focused solely on the localized benefits of carbon sequestration, highlighting the need to consider its cross-regional impacts when formulating carbon sequestration policies. It emphasizes the importance of avoiding policies that are overly concentrated in one area while neglecting potential environmental pressures in other regions.
Food Production Services
Regarding food production services, Reay et al. (2012) emphasized that agricultural activities, particularly the extensive use of nitrogen fertilizers and pesticides, are significant sources of greenhouse gas emissions and environmental pollution. The emission of nitrogen oxides (N2O), in particular, substantially impacts global climate and AQ [48]. This is consistent with the conclusions of the present study. Our research further extends this argument by revealing the spillover effects of the supply-demand balance in food production services. It points out that high-intensity agricultural production activities not only affect local environmental quality but also have long-term negative impacts on neighboring areas. These spillover effects may result from soil erosion, chemical runoff, and overexploitation of land resources caused by agricultural expansion, particularly in uneven distribution regions [49]. These results suggest that cross-regional coordination of agricultural policies and the establishment of ecological compensation mechanisms are necessary to mitigate the negative environmental impacts of agricultural production.
Soil Conservation Services
In the field of soil conservation services, Pimentel et al. (2020) highlighted the environmental and economic costs associated with soil erosion. They pointed out that implementing soil conservation measures can significantly reduce erosion and enhance the stability of ecosystems [50]. However, this study further reveals that soil conservation measures may increase environmental pressure in the local area. Although these measures can effectively reduce soil loss, their implementation is often accompanied by significant resource consumption and intensified agricultural activities, which in turn exacerbate environmental pressure, particularly in regions with high-intensity agriculture [51]. In addition, this study found that the improvement in the supply-demand balance of soil conservation services positively affected neighboring areas. This is primarily due to the reduction of pollutant runoff from the local area, which subsequently improved the AQ in surrounding regions [52]. This finding highlights the complexity of agricultural resource utilization and suggests that when implementing soil conservation policies, careful consideration should be given to the equitable distribution of ecological resources in order to achieve a balanced regional ecological benefit.
Water Conservation Service
The findings of this study regarding water conservation services indicate that, although the improvement in the supply-demand balance of water resources supports agricultural and industrial development in the short term, it has a negative impact on AQ in the long term. This is consistent with the research by Gordon et al. (2010), who pointed out that unbalanced water resource utilization can exacerbate ecosystem stress, leading to the accumulation of pollutants [53]. This study further demonstrates that the improper allocation and overuse of water resources, particularly in the agricultural and industrial sectors, increase the emission of chemicals, which in turn negatively impacts AQ. This finding aligns with the perspective of Grafton et al. (2015), who noted that imbalances in water resource management can lead to environmental degradation [54]. Additionally, the research by Sun et al. (2016) also pointed out that rapid urbanization and industrialization in different regions of China have exacerbated the imbalance in water resource supply and demand, resulting in long-term negative impacts on environmental quality [55]. This finding echoes the conclusions of the present study.
Significance and Interpretation
The findings of this study provide several policy recommendations for regional environmental management, particularly in terms of how optimizing the balance of ESDR can improve AQ, address extreme weather events, and achieve sustainable development goals. Given the significant differences in ESs supply and demand across different regions, policymakers need to implement differentiated management strategies to ensure the stability of regional ecosystems and the sustainability of the environment.
Regarding carbon sequestration services, regions with rapid industrialization and urbanization face particularly pronounced imbalances in the supply and demand of carbon sequestration due to higher carbon emissions. Therefore, policies should focus on enhancing carbon sequestration capacities in these areas. Measures such as afforestation and wetland restoration, which have been proven to improve AQ significantly, should be prioritized to increase carbon absorption capacity [56]. At the same time, attention should also be given to the spillover effects on neighboring areas, ensuring that the redistribution of carbon sequestration resources does not impose additional pressure on the ecosystems of surrounding regions. Additionally, the study by Thanapongporn et al. (2023) highlighted that the low-carbon behaviors of millennials are significantly influenced by incentives and persuasive technologies, especially when they perceive a sense of control over their actions [57]. This suggests that when promoting carbon sequestration policies, introducing incentives and technological tools targeted at younger populations— such as eco-reward programs and carbon footprint tracking apps—can effectively encourage their active participation in low-carbon behaviors. Such approaches not only enhance carbon sequestration capacity but also raise public awareness and motivation for environmental protection, particularly among the younger generation.
This study emphasizes the importance of sustainable production methods such as precision agriculture in the agricultural sector. These technologies can reduce the negative environmental impacts of farming activities by utilizing resources more efficiently. Precision agriculture leverages modern technologies, such as sensors, data analytics, and satellite navigation, to optimize agricultural production, which can significantly reduce the use of fertilizers and pesticides, lowering pollutant emissions [58]. In addition, promoting eco-friendly agrarian models such as organic farming and circular agriculture can also help alleviate the ecological pressures caused by food production. Policymakers should actively encourage adopting these sustainable agricultural practices, especially in environmentally sensitive areas and regions with high-intensity agrarian production. This is crucial for maintaining the balance between supply and demand and improving overall AQ.
To address the environmental pressures caused by imbalances in soil conservation supply and demand, policies should promote low-emission and eco-friendly soil conservation measures. By advancing practices such as organic farming, reducing the use of chemical fertilizers, and implementing ecological restoration techniques—such as returning farmland to forests and restoring vegetation—the natural recovery capacity of soil can be significantly improved. These measures can effectively reduce erosion and decrease pollutant runoff by increasing vegetation cover [59]. In addition, the study by Saroji et al. (2023) demonstrated that land adjustment and optimization can significantly improve land resource utilization efficiency and financial feasibility [60]. This indicates that, in the agricultural sector, rational land planning and management can not only mitigate soil erosion and reduce environmental pressure but also bring long-term economic benefits. Therefore, policymakers should encourage farmers and landowners to participate in these soil conservation measures actively. By providing financial compensation or technical support, more environmentally friendly land use models can be promoted. This approach helps reduce the environmental impact of soil erosion and improves soil quality, enhancing the sustainability of agricultural production and the stability of regional ecosystems.
In terms of water resource management, this study found that the balance between water supply and demand significantly impacts AQ, especially in water-scarce regions where efficient water management becomes a crucial factor in ensuring AQ. To address this issue, policies should encourage regions to develop management measures based on their actual water supply and demand conditions. For example, in the industrial sector, promoting the recycling and reuse of industrial water can help reduce the environmental pressure caused by industrial wastewater discharge [61]. At the same time, water-rich regions should take on certain cross-regional ecological compensation responsibilities by providing technical support and financial assistance to water-scarce areas, promoting a balance in water resources across regions. Such cross-regional ecological cooperation can not only help alleviate local supply-demand imbalances but also ensure the sustainable development of the overall ecosystem.
Advantages, Limitations, and Future Research Directions
The primary advantage of this study lies in its use of the DSDM combined with high-resolution data from 500 districts and counties in the YRB. This approach systematically reveals the spatiotemporal effects of different types of ESDR on AQ. By applying the DSDM model, this study effectively captures the complex spatial spillover effects of supply-demand balance between different regions, thereby deepening the understanding of the interaction mechanisms between ESSD and AQ. Compared to traditional static analyses, the dynamic spatial analysis method employed in this study not only examines the direct effects of ESDR on AQ but also provides deeper insights into its long-term indirect effects. This offers a more scientific and precise basis for decision-making in regional environmental governance.
However, this study also faces certain limitations. Firstly, due to the differences in measurement methods and units for different types of ESs, the study could not integrate the four kinds of ESDR (such as carbon sequestration, food production, soil conservation, and water resource management) into a single composite index for analysis. As a result, the research perspective is limited to examining the independent effects of each ESDR on AQ without evaluating their combined overall impact. Secondly, the availability of socioeconomic data presents a limitation, particularly in regions where data may be missing or inconsistent, which could lead to some degree of bias in the analysis results and affect the generalizability and precision of the conclusions. Additionally, while the model effectively analyzes the impact of the supply-demand balance on AQ, the supply-demand relationships of ecosystem services involve multiple complex ecological mechanisms. The simplified assumptions of the model may only partially capture these complexities, especially in highly dynamic ecosystems.
Looking ahead, although this study conducts a detailed analysis at the county level, future research should expand the scale to include city or regional levels for comparative macro-level analysis. This would help to understand better the broader impacts of cross-regional ecosystem service supply-demand balances on AQ. Furthermore, future studies should make full use of big data technologies and advanced environmental monitoring tools to enhance the precision and timeliness of data. For example, integrating remote sensing technology, sensor networks, and machine learning algorithms could provide a more accurate assessment of AQ and its multidimensional relationship with ESDR. This would offer more robust support for environmental governance.
Conclusion
This study provides a comprehensive analysis of the spatiotemporal effects of ecosystem service supply-demand balance in the context of the YRB, focusing on changes between 2010 and 2020. The results indicate that, despite some progress in improving ESDR, significant disparities remain between regions. High-value ESDR areas in the western and central regions showed notable improvements, while the eastern regions, particularly in terms of food production and water resource services, still face substantial challenges in meeting demand. By applying the DSDM, we revealed that ESDR has both positive and negative effects on AQ. The study demonstrates the complexity of the relationship between ESDR and AQ, with carbon sequestration services showing a positive impact on AQ, while improvements in food production, soil conservation, and water resources may have negative impacts due to increased resource exploitation and industrial activities. This highlights the need to carefully balance the overall environmental impacts when enhancing ESDR. The spatiotemporal effects of ESDR are closely tied to land-use changes, human consumption patterns, and industrial activities. Specifically, improvements in carbon sequestration and water resource services exhibit significant spatial spillover effects, suggesting that measures such as establishing low-carbon pilot cities and low-pollution industrial parks can promote coordinated regional development. On the other hand, the negative impact of ESDR on food production underscores the necessity of strict management of agricultural land to prevent overexploitation.

