

Introduction
Greenhouse gas emissions, especially carbon dioxide from human activities, are a primary factor in global warming, threatening the world’s ecological balance and stability [1]. International accords, such as the United Nations Framework Convention on Climate Change, the Kyoto Protocol, and the Paris Agreement, have been implemented, instituting regulatory limitations on greenhouse gas (GHG) emissions. Developed and developing nations have the responsibility and obligation to reduce carbon emissions. China wants to reach a “dual carbon” goal of a carbon peak by 2030 and carbon neutrality by 2060. This goal serves as both a plan for going green and reducing carbon emissions in China and a strong sign of China’s commitment to taking an active role in managing climate change and meeting its international obligations. The proposed execution of this objective further underscores China’s leadership and contribution to global climate governance. China has engaged in the negotiation and execution of the Paris Agreement, pledging to restrict the rise in global average temperature to 2ºC and endeavoring to reduce it to 1.5ºC. The “dual-carbon” objective embodies this commitment. Consequently, examining the relationship between land use carbon emissions and carbon sequestration can furnish a theoretical foundation for achieving the “double carbon” objective.
The term “carrying capacity” was initially established in physics to denote the maximum load an object can sustain without incurring harm [2]. In 1921, Park et al. [3] introduced the notion of carrying capacity, defined as the greatest number of persons that may persist in a given territory under stable ecological conditions (e.g., territorial space, accessible natural resources, etc.). The notion of environmental carrying capacity was initially introduced by Catton in 1986 and subsequently broadened to encompass ecological carrying capacity. International researchers characterize ecological carrying capacity as the maximum human population that a specific place can sustain without detrimental effects on its environment [4]. The prevalence of issues such as land degradation, resource scarcity, environmental contamination, and population expansion has prompted the active consideration of the notion of carrying capacity in numerous domains of environmental and ecological research. For instance, the carrying capacity of water resources, the carrying capacity of land resources, and the carrying capacity of water resources, among others. Xiao et al. [5] initially introduced the notion of carbon carrying capacity in 2013, characterizing it as the quantity of CO2 that may be sequestered through photosynthesis by plants. Subsequently, the concept of carbon carrying capacity was further refined, leading to the emergence of studies on carbon sequestration ecological carrying capacity [6]. A review of pertinent studies conducted by domestic and international experts reveals that research has evolved from examining the isolated effects of land use change [7, 8] to investigating the combined implications of urban sprawl [9, 10], climate change [11], and human activities [12, 13]. Research on carbon emissions has examined various aspects of carbon. This encompasses the application of spatial autocorrelation models, center of mass models, and additional methodologies to investigate the geographical and temporal distribution properties of carbon emissions [14-16]. Carbon emissions are quantified in accordance with the IPCC 2006 measuring methodology. The entropy weight method and coupling coordination degree are utilized to evaluate carbon emissions efficiency [17, 18], alongside identifying critical areas for developing a scientific and comprehensive carbon compensation mechanism by establishing the object, value, and priority of carbon compensation [19-21]. The aforementioned investigations have yielded specific outcomes regarding land use carbon balance and have offered insights for carbon sequestration and emission reduction. To achieve the objective of “dual-carbon”, it is essential to enhance the carbon sequestration ecological carrying capacity (ESC). Given the insufficient exploration of urban ESC, it is crucial to investigate the development landscape of ESC in China to provide a baseline for urban ESC.
ESCs in various places display distinct properties. Significant geographical disparities exist in China’s carbon sources and sinks, including total carbon emissions, total carbon sequestration, and carbon carrying capacity metrics. Anhui Province is a geographically representative province in the central area. Municipalities exhibit considerable disparities in industry composition, economic advancement, and energy consumption trends. It is crucial in advancing the development of ESC in the central area. In 2022, Anhui Province’s total carbon emissions will constitute 4.00% of the national total emissions. The average annual growth rate of carbon emissions from 2016 to 2022 is 3.50%, exceeding the national average of 2.80% by 25 percentage points for the same timeframe. Anhui Province confronts a significant difficulty in reaching the carbon peak target by 2030, according to current development trajectory forecasts. By the conclusion of 2022, the forest coverage rate in Anhui Province will reach 28.65%, and the total annual carbon sink will be maintained at 5.70×10⁷ tons of CO2 equivalent. The growth trajectory of carbon sinks exhibits distinct phases: the growth rate is projected to stay elevated throughout the 13th Five-Year Plan period from 2016 to 2020, followed by a substantial fall from 2021 to 2022. The rationale is that the development of forestable land resources is nearing the theoretical saturation point (about 90%), with available space for additional afforestation totaling less than 300,000 hectares. Anhui Province is confronted with dual challenges on the way to carbon neutrality: managing the persistent increase in carbon emissions while simultaneously overcoming the ecological constraints to develop carbon sinks. The current literature predominantly examines the carbon emissions from various sectors, including agriculture and industry, in Anhui Province [22-24]. The regional and temporal distribution characteristics of ESC and its driving variables in Anhui Province remain underexplored. Consequently, utilizing the CLCD dataset alongside economic, social, and environmental information, this article assesses the carbon sequestration ecological carrying capability of Anhui Province and investigates the subsequent aspects:
(1) Employing the Moran Index and cold hotspot analysis to investigate the spatial and temporal distribution and clustering characteristics of ESC at the municipal level;
(2) Developing the random forest method and spatial Durbin model to identify the primary influencing factors of the ESC in Anhui Province across various time scales. Additionally, investigate the spatial impact of these influencing elements. Our objective was to enhance the research on the ESC at both provincial and municipal levels, thereby offering a foundational reference for the future low-carbon sustainable development of Anhui Province.
Overview of the Study Area
Anhui Province, located in East China, is an important section of the Yangtze River Delta economic belt, an important energy-exporting province in China, and a typical area for carbon emission and carbon sink research. Fig. 1 illustrates that its geographical coordinates are situated between 29º41′ and 34º38′ north latitude and 114º54′ and 119º37′ east longitude. The landscape features diverse and intricate topography, with mountains, hills, plateaus, and plains, with mountains and hills constituting a predominant share. The province’s geography is elevated in the southwest and diminished in the northeast, exhibiting significant variation from north to south. The northern region of Anhui Province is characterized by the Huaibei Plain, where agricultural land predominates. The southern region of the province is characterized by the southern Anhui mountains. Forestry predominates land use, with wooded land comprising 29.2% of the total land area. The overall land area of Anhui Province is around 1.401 million hectares, including 4.22 million hectares of arable land, 3.29 million hectares of forest land, and 1.05 million hectares of water surface in the province. Agricultural land constitutes 80% of the total land area, with arable land being 40.9% of agricultural land. Unutilized land resources are minimal, representing only 2.3% of the province’s total land area, far lower than the national average of 25.8%. The average annual temperature in Anhui Province fluctuates between 13ºC and 22ºC, with an average annual precipitation of 1967.450 mm, indicating a temperate and humid climate. The predominant soil type in Anhui Province is red soil, encompassing an area of 438,032,000 hectares, primarily located in the central and lower regions of the hills and foothills in western and southern Anhui. Rice soil constitutes the most prevalent agricultural soil, with 29.42% of the province’s total soil area. Consequently, Anhui Province is recognized as the “grain repository of the Yangtze River and Huaihe River”. As Anhui Province assimilates into the Yangtze River Delta economic belt, it has undergone swift industrialization and urbanization, resulting in economic advancement alongside substantial rises in carbon emissions and environmental issues.
Materials and Methods
Data Sources
This study utilizes panel data from 16 prefecture-level cities in Anhui Province spanning the years 2008 to 2022 as the research sample. The Anhui Provincial Statistical Yearbook (2008-2022) is where the energy consumption numbers and measures used in this paper come from. The 16 prefectural cities’ statistical yearbooks and bulletins are where the socio-economic variables are found. The land use data is sourced from the China Land Cover Dataset (CLCD), created by Xin Huang’s team at Wuhan University. This dataset offers high-precision information on China’s land cover and is applicable in geographic information systems (GIS), environmental monitoring, urban planning, and various other research domains. The National Land Cover Classification System (CLCD) is utilized in the Ecological Decade Remote Sensing Monitoring. ArcGIS was employed to extract CLCD data and statistically produce land use data for 16 prefecture-level cities in Anhui Province. The unprocessed data for the other indicators were sourced from the China Statistical Yearbook, Anhui Provincial Statistical Yearbook, Anhui Provincial Urban Statistical Yearbook, and the National Economic and Social Development Statistical Bulletin for the respective study years. Certain missing numbers are addressed using linear interpolation and the method of approximate annual average. Furthermore, previous research indicates adherence to the notion of non-redundancy of information among indicators. Ten factors, including population size, urbanization rate, environmental regulation, GDP per capita, industrial structure, fixed asset investment, scientific and technological innovation, average annual temperature, water network density, and air quality attainment rate, are chosen for the analysis of key influencing factors. The pertinent data originate from credible sources, and the analytical outcomes possess significant reliability and explanatory capacity.
Research Strategy
This work systematically assesses the dynamic evolution characteristics of carbon sequestration, carbon emissions, and carbon sequestration carrying capacity (ESC) utilizing time series data from 2008 to 2022. Initially, the spatial autocorrelation analysis technique is employed to examine the spatial correlation pattern of ESCs utilizing the global/local Moran index. The spatio-temporal cold hotspot detection technique is subsequently employed to uncover large concentration areas of ESCs, their evolutionary trajectories, and to characterize their spatio-temporal heterogeneity characteristics and spatial differentiation patterns. In the examination of driving mechanisms, multivariate machine learning models, including ridge regression, XGBoost, gradient boosted regression trees, support vector regression, and random forest, are developed for comparative analysis. The random forest model is chosen for its optimal performance in quantitatively assessing the influence of several multidimensional factors, including social, economic, and natural geographic aspects, on ESC. The geographic Durbin Model (SDM) is employed to analyze the geographic spillover effects of the primary influencing elements of ESC, taking into account the transmission mechanism of the spatial effect. Conduct a comprehensive examination of its operational trajectory and spatial interaction mechanism, ultimately establishing a systematic analytical framework of “factor-driven - spatial response” (Fig. 1).
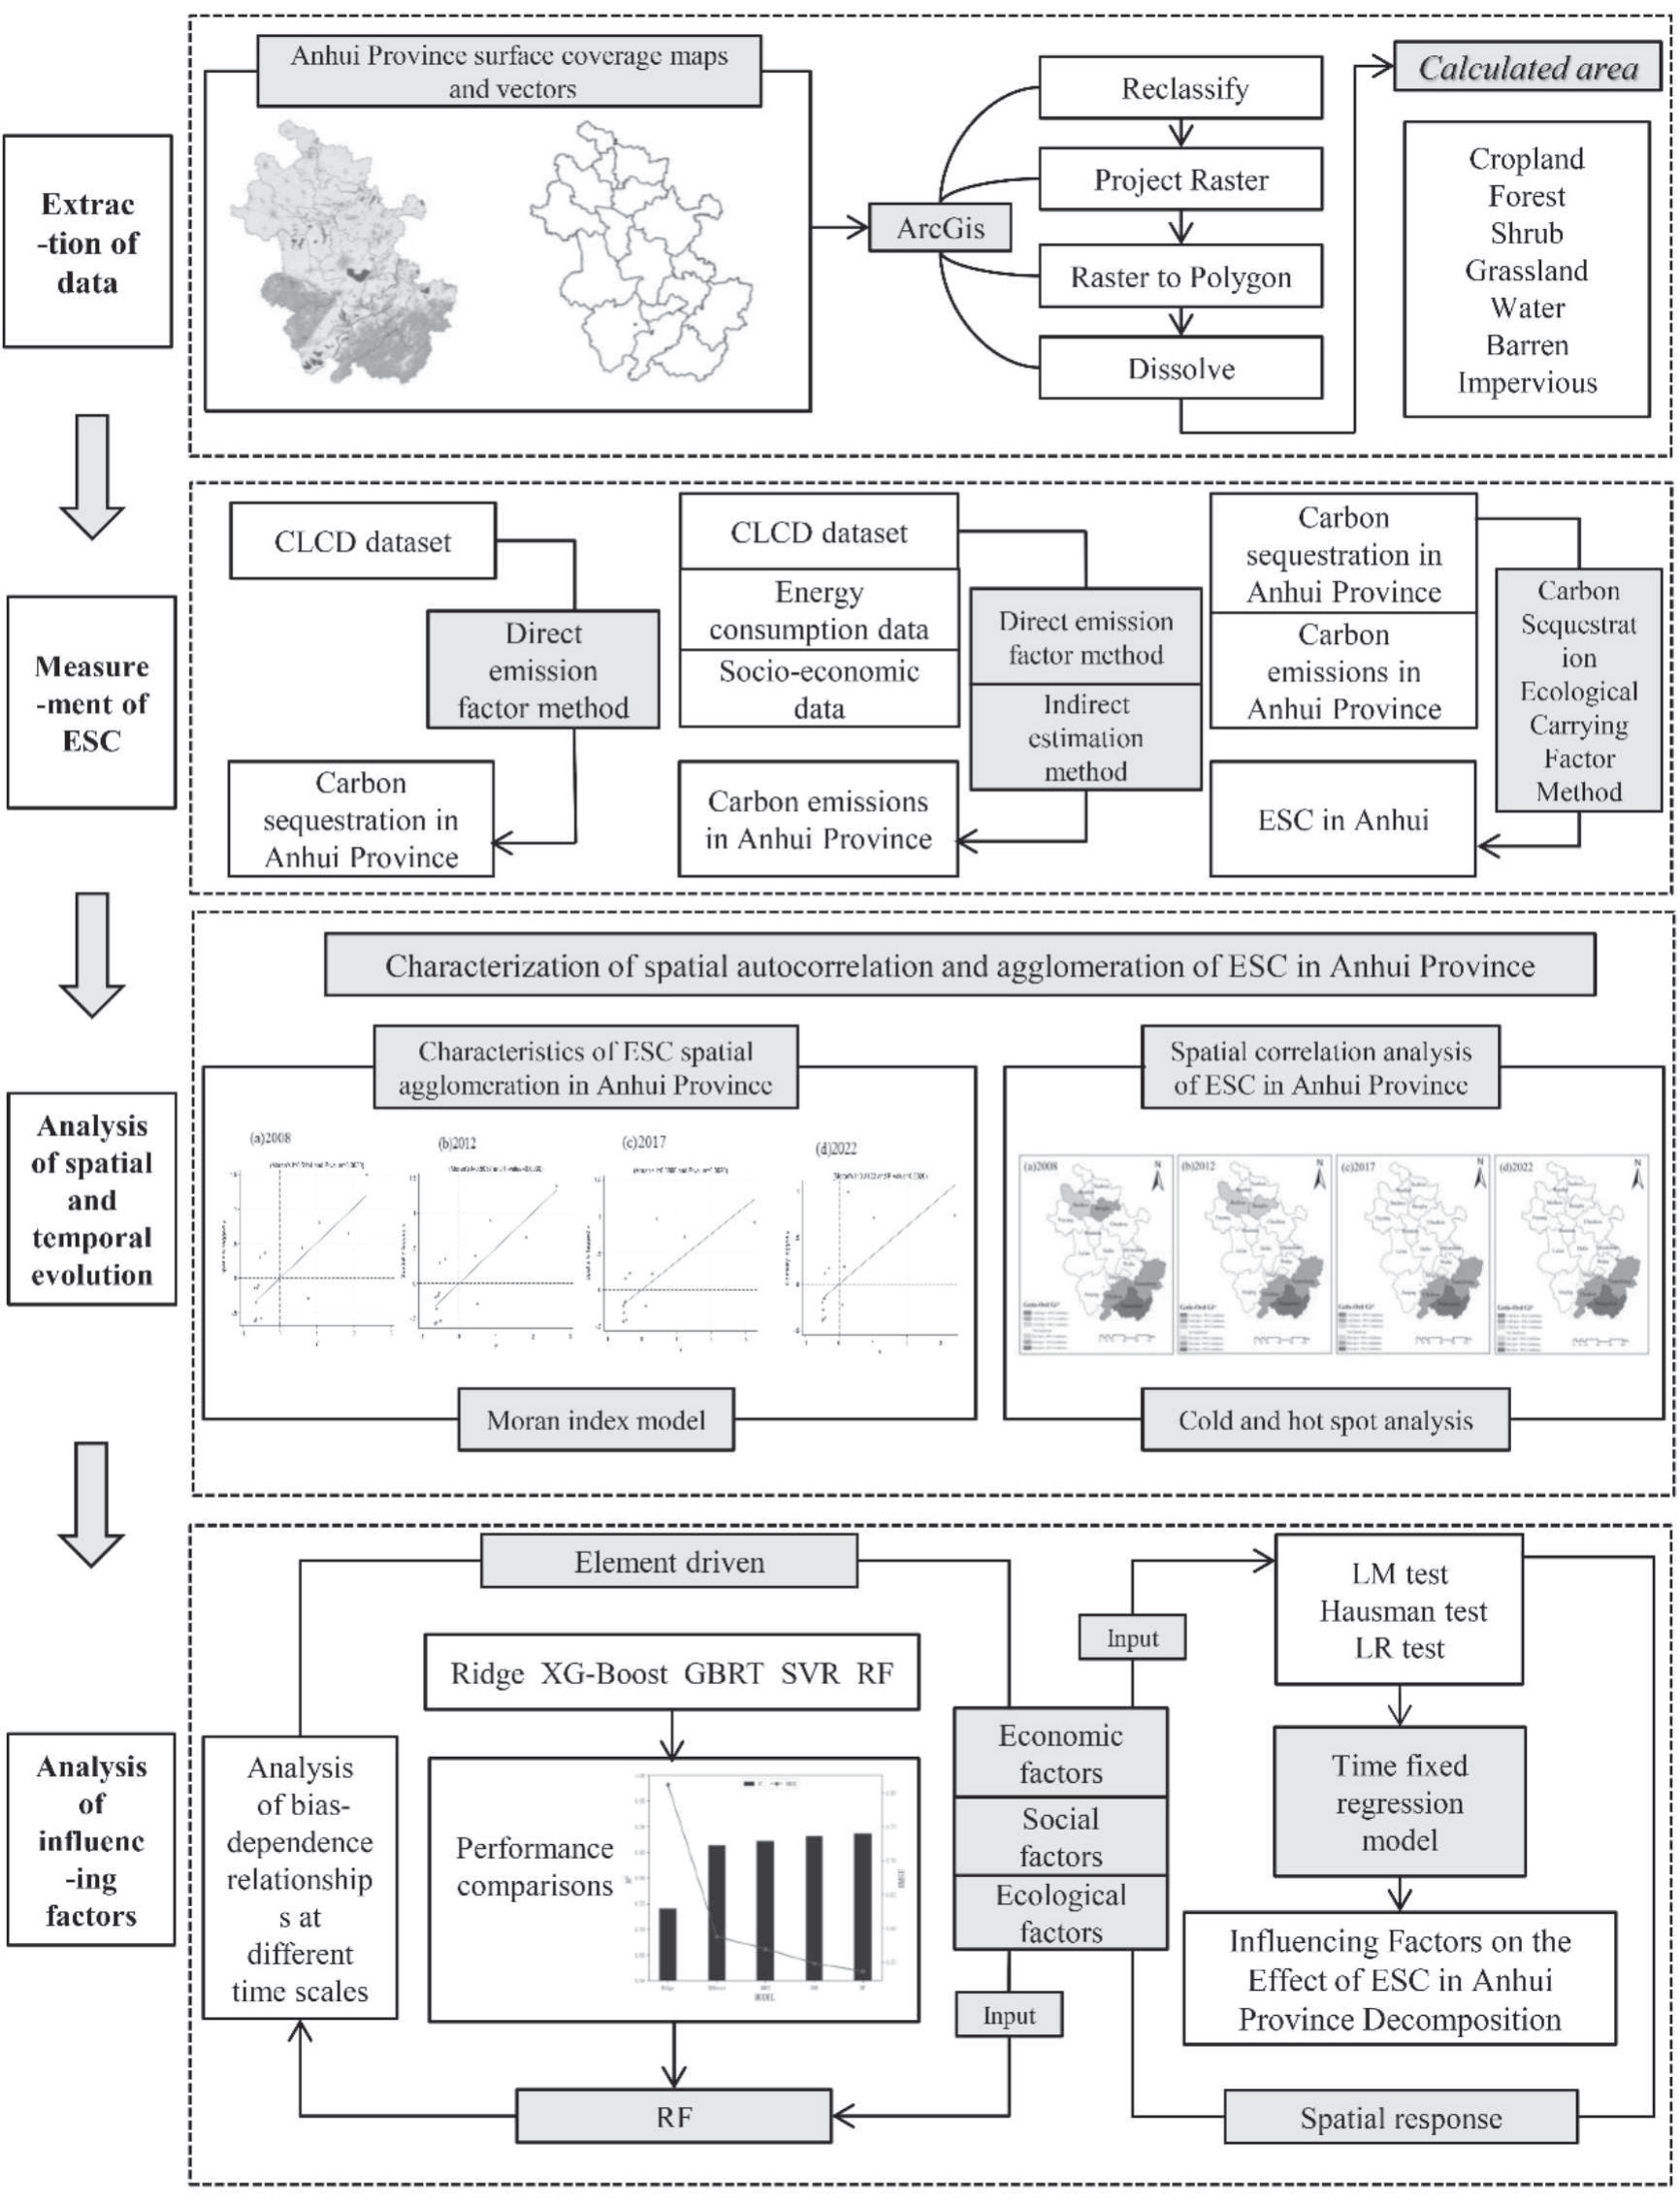
Research Methodology
Estimation of Carbon Sequestration
ArcGIS was employed to delineate the areas of six land use categories – cropland, forest land, grassland, watershed, unutilized land, and construction land – across 16 cities in Anhui Province annually from 2008 to 2022. Arable land and developed land served as carbon sources. Forested areas, grasslands, watersheds, and unused land serve as carbon sinks. The carbon sequestration of forest land, grassland, watersheds, and unused land was assessed utilizing the direct carbon emission factor approach with the following formula:
Where En is the direct carbon emissions of the nth city; Ei, Si, φi are the carbon emissions, area, and carbon emission coefficients of the i-th land use type, and the carbon absorption coefficients of forest land, grassland, watershed, and unutilized land are 0.644, 0.021, 0.253, and 0.005 t/hm2, respectively [25].
Estimation of Carbon Emissions
The carbon emissions from cropland, considered as a carbon source alongside construction land, are determined through direct estimation using formula (1), with a carbon emission coefficient of 0.422 for cropland. Construction land encompasses numerous human activities, typically assessed indirectly via the energy consumption associated with its use. Based on the current research findings [26, 27], the carbon emissions from construction land in each city were indirectly computed using the energy consumption per unit of GDP. While the carbon emissions from arable land and construction land were determined using the following formula:
Where Cn, Ccro, En, GDPn, Eg are indirect carbon emissions, carbon emissions from arable land, total energy consumption, gross regional product, and energy consumption per unit of GDP of the nth city; Scro, φcro, Φ are the carbon emission coefficients for cropland area and cropland carbon emission coefficients for standard coal, respectively.
Estimation of Ecological Carrying Capacity for Carbon Sequestration (ESC)
The ESC indicates the extent of carbon sequestration potential in this location, specifically expressed as follows [27]:
Where Cn denotes the carbon sequestration of the nth city, while C represents that of Anhui Province; En signifies the carbon emission of the nth city, while E denotes that of Anhui Province. ESC>1 signifies a high carbon sequestration ecological carrying capacity coefficient, indicating robust carbon sequestration ecological carrying capacity within the ecosystem; 0<ESC<1 denotes a low carbon sequestration ecological carrying capacity coefficient, reflecting diminished carbon sequestration ecological carrying capacity.
Moran Index
Global Moran Index
The global Moran’s I index and Moran scatterplot are used to measure the regional spatial layout characteristics and agglomeration. The formula is as follows:
where I denotes the global Moran index of Anhui Province, n denotes the number of prefecture-level cities (n = 16), xi and xj denote the ESC of the i-th and j-th cities in Anhui Province, respectively, x̅ is the mean value of carbon sequestration ecological carrying capacity of each city in Anhui Province, ωij is the spatial weight matrix of cities i and j, and S is the sample variance value.
Localized Moran Index
Local autocorrelation was tested using the local Moran index to further characterize the spatial clustering, heterogeneity, or random distribution of the ESC.
A local Moran index exceeding 0 signifies spatial agglomeration between the city’s ESC and its surroundings, with larger values indicating a more pronounced agglomeration effect. Conversely, a local Moran index below 0 denotes spatial dispersion of the city’s carbon sequestration ecological carrying capacity, with smaller values reflecting a stronger radiative effect. An index equal to 0 indicates the absence of spatial correlation, resulting in a stochastic distribution of the city’s ESC.
Cold Hot Spot Analysis
This paper uses the Getis-Ord Gi* coefficient to determine the significant aggregation zones of ESC in Anhui Province. Monitor the evolution or alteration of ESC hotspot regions over time. To identify spatio-temporal hotspots and examine the distinct geographical distribution pattern. The standardized Z-value can be utilized to assess the statistical significance of Getis-Ord Gi*. A positive Z-value and an elevated value signify that the aggregation of high values (hotspots) is more compact, whereas a negative Z-value and a diminished value suggest that the aggregation of low values (coldspots) is more compact.
xj represents the recognized ESC of city j; Wij and n are consistent with Eq. (4); Gi* denotes the aggregation index of patch i. A positive and significant Getis-Ord Gi* index signifies that the value around city i is comparatively high, categorizing it as a hotspot area; conversely, a negative index shows that the value is relatively low, designating it as a coldspot area. Wij represents the spatial weights between rasters i and j; if the distance between raster i and raster j falls within the defined range, then Wij = 1; otherwise, Wij = 0. n represents the total number of patches; it denotes the mean value of all panels within the space; S signifies the standard deviation of all patch attribute values.
Random Forests
The random forest algorithm, introduced by Breiman in 2001, is an ensemble learning technique grounded in decision trees. It is straightforward to build and possesses high interpretability relative to other machine learning methods, and it is more adept at addressing multicollinearity across variables and mitigating model overfitting. The algorithm can manage various data formats and assess feature significance, demonstrating robust prediction capability [28]. In the processing of unstructured data, it markedly enhances classification accuracy relative to linear approaches and fulfills the engineering requirements of land surveys. This paper employs Python software to implement a random forest model for constructing a regression analysis model for each city in Anhui Province, incorporating relevant social, economic, and natural factors, and identifying the principal influences on the variation of ESC.
Spatial Durbin Model
To explore the key influencing factors of ESC and its mechanism of action, the spatial spillover effect of ESC should be considered. In view of this, this paper constructs the spatial Durbin model (SDM). The spatial Durbin model addresses the pseudo-independence assumption inherent in classic linear regression by incorporating the spatial effect endogenously, hence providing a more accurate representation of spatial interactions in regional ESC. The model expression is as follows:
where X is the influencing factors in “social-economic-environmental”, Y is the ESC of each city in Anhui Province, i is each city in Anhui Province, t is time, α represents individual effects, β represents individual effects ω is the spatial weight matrix, μ is the regression coefficient, θ is the coefficient of the spatial lag term, λ is the coefficient of the spatial interaction term, and ε is the random perturbation term.
Results
Carbon Sequestration, Carbon Emission, and ESC Time Series Change
The examination of the time series data on carbon sequestration and carbon emissions in Anhui Province from 2008 to 2022 (Table 1, Fig. 2 Ⅰa)) indicates that the carbon sink system in the research area exhibits notable spatial differentiation and dynamic evolution patterns. The province’s overall carbon sequestration exhibits a gradual decline, with a 3.3% reduction from 2008 to 2022. Forest land, as the primary carbon sink, accounts for about 90% of carbon absorption; yet, its relative contribution rate exhibits a declining trend annually. Carbon sequestration in aquatic environments exhibits substantial development, but carbon sequestration in grasslands and uncultivated land remains rather steady. Carbon sequestration exhibits a gradient distribution: southern Anhui (>60%), central Anhui (≈37%), and northern Anhui (<3%). The carbon absorption in the three regions exhibited a persistent decline. Central Anhui has the most significant yearly average decline rate at 4.4%, followed by northern Anhui at 2.3% and southern Anhui at 2.6%, indicating a continuous reduction in regional carbon sink capacity. Anhui Province exhibited a rapid increase in carbon emissions during the research period (Table 1, Fig. 2 Ib)). The overall quantity increased from 6.700×10⁷ tons to 15.231×10⁷ tons. The proportion of emissions attributed to construction land increased from 94.6% to 97.6%, underscoring the impact of urbanization on carbon emissions. Regional carbon emissions exhibit considerable variability: northern Anhui experienced the highest growth rate (2.32×10⁶ t in 2008, representing 34.7%; 38.2% in 2022), followed by central Anhui (increasing from 35.4% to 37.5%). Central Anhui exhibits the second-highest growth rate, increasing from 35.4% to 37.5%. Conversely, the proportion of the southern Anhui region dropped by 5 percentage points. Anhui Province has established a classification of its emission pattern as “high in the north and low in the south”. This spatial heterogeneity is significantly correlated with the gradient of regional economic development and the alteration of industrial structure.
Table 1.
Carbon Emissions, Carbon Sequestration, and ESC Levels in Anhui Province.
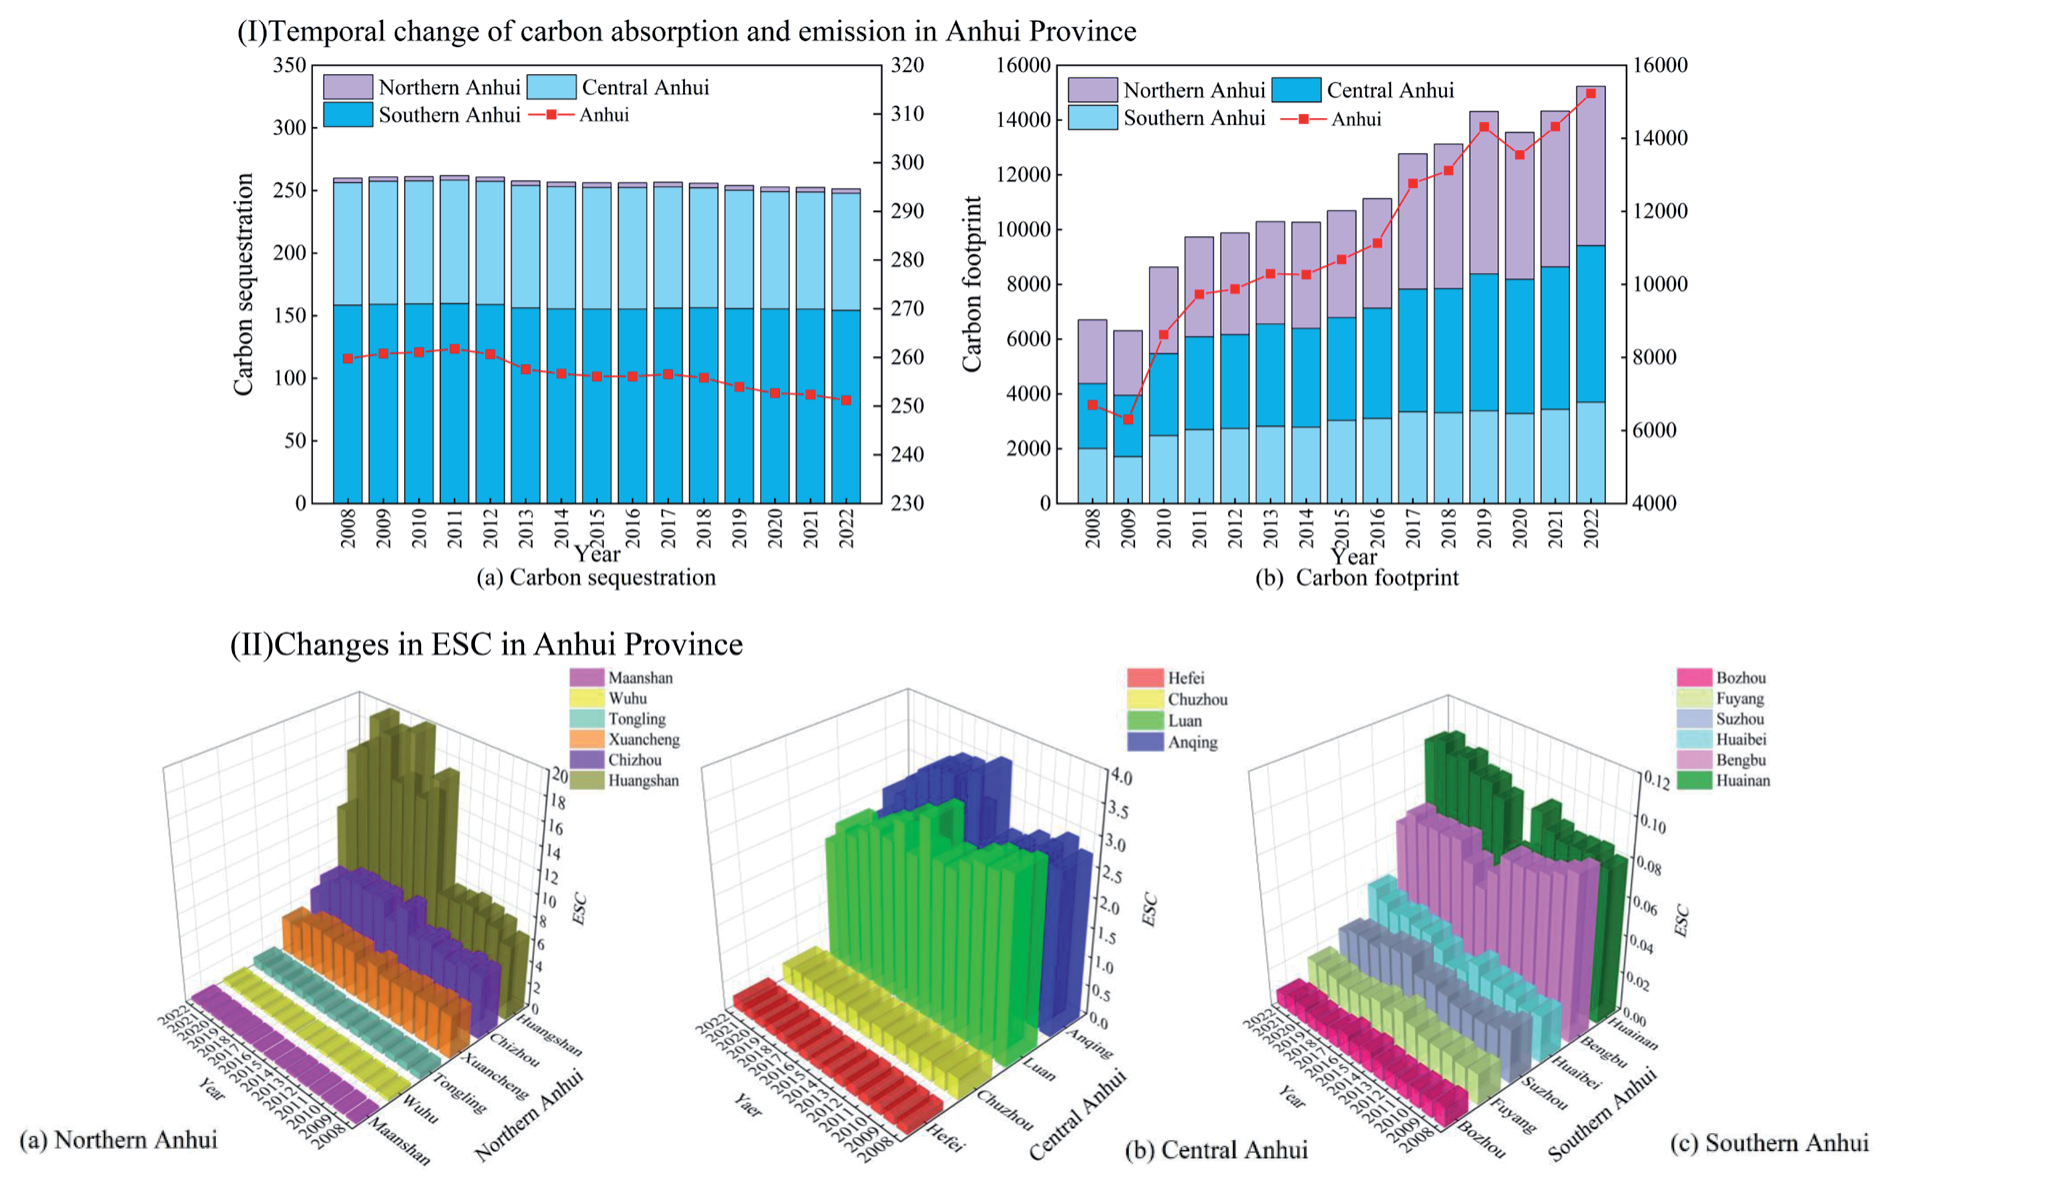
The examination of the temporal evolution of the ecological carrying capacity (ESC) for carbon sequestration in Anhui Province from 2008 to 2022 is presented in Fig. 2 Ⅱ). The analysis indicates that the province’s overall ESC exhibits a declining trend and is marked by considerable regional variability. Sub-regional analyses indicated that the spatial distribution of ESC was as follows: southern Anhui urban agglomeration (7.20)>central Anhui urban agglomeration (1.54)> northern Anhui urban agglomeration (0.12), with inter-regional disparities of 3.77 (southern Anhui - northern Anhui) and 1.42 (central Anhui - northern Anhui). The southern Anhui region exhibits a phased evolution characterized by an initial rise followed by a decline, accompanied by notable internal disparities. Huangshan City, Xuancheng City, and Chizhou City form a high-value cluster, exhibiting an average ESC of 7.20 during the study period. The City of Yellowstone experienced a substantial increase post-2014, with an average ESC value of 16.90 from 2014 to 2022. This represents a 169% increase from the prior period (2008-2013: 6.0-10.0). Conversely, the cities of Maanshan, Wuhu, and Tongling continuously have low values (0-1), signifying a structural imbalance in the biological function of carbon sinks within the region. The evolution of ESC in central Anhui exhibits regional differentiation: Lu’an and Anqing form a region of relatively high values (ESC>2.00), whereas Hefei and Chuzhou consistently display low values (ESC<1.00). The ESC level in the regional core city of Hefei did not exceed the threshold value of 1, indicating a substantial restriction on ecological carbon sequestration due to growing urbanization. The ESC depression of the province indicates that the northern Anhui region exhibits typical “M”-type bimodal fluctuation characteristics in its dynamic evolution. The extreme value of the six cities’ ESC consistently remains below 0.12, exhibiting a magnitude difference of 3.77 compared to the southern Anhui region. The ongoing low level of ESC in this region underscores the necessity for ecological restoration amid the transition of resource-oriented communities.
Characterization of Spatial Autocorrelation and Agglomeration of ESC
Table 2 presents the outcomes of the global Moran index test, Moran’s I indicates the extent of connection between the similarity and spatial proximity of attribute values within spatial units. The p-value signifies the likelihood of witnessing the present or more extreme Moran’s index assuming the null hypothesis of no spatial autocorrelation is true. Z-value is the standardized difference between Moran’s index and its expectation. A z-value indicates significant spatial autocorrelation when it exceeds 1.96 or is below -1.96, equivalent to a p-value of less than 0.05. If the p-value is less than 0.05, considerable spatial autocorrelation is deemed to exist. This indicates that the Moran index remains positive throughout the study period, with a gradual general decline observed. From 2008 to 2022, the global spatial autocorrelation analysis index was above the 1% significance threshold, indicating a significant positive spatial autocorrelation in the ESC throughout the sixteen cities in Anhui Province. The Moran’s I index declines from 0.511 in 2008 to 0.312 in 2022, indicating a gradual lowering of spatial autocorrelation of ESC in Anhui Province over the study period. Cities exhibiting high ESC are spatially clustered with adjacent high-value cities, while those with low ESC cluster with neighboring low-value cities, with the degree of clustering diminishing annually. This may result from the variability in land area alterations among the 16 cities in Anhui Province from 2008 to 2022.
Fig. 3 Ⅰ) illustrates that the proportion of cities in Anhui Province exhibiting ESC in quadrants I and III during the years 2008, 2012, 2017, and 2022 exceeds 80% in 16 cities, signifying a predominantly favorable global spatial correlation in these regions. Huangshan, Xuancheng, Chizhou, and Anqing are regions of significant agglomeration, characterized by a land use pattern predominantly comprising ecological land types, including forest land, grassland, and water bodies. Forested terrain comprises 87.25% of Huangshan’s total area, 61% of Xuancheng’s, and 65.81% of Chizhou’s. Anqing’s arable land encompasses a greater expanse, with its aquatic area reaching 125,200 hectares. The superior ecological conditions of the four cities significantly enhance the ESC. 66.7% of cities in the third sector are situated in northern Anhui. In 2022, the population density in northern Anhui will reach 538 people per square kilometer, higher than the provincial average of 216 people per square kilometer. In the past 10 years, there has been a net decrease of 142,000 hectares of arable land, 68% of which has been converted into industrial and residential land. In 2022, 15.7% of the area will be forested, which is below the provincial average of 5.8% and the national average of 7.3%. The proportion of strategic emerging industries is less than 20%, the capacity of scientific and technological innovation is weak, and the intensity of R&D investment is lower than the average level of the province. The industrial framework is characterized by significant heaviness, elevated energy consumption, and pronounced emission issues, with the energy consumption intensity in northern Anhui exceeding the provincial average by 15% in 2022. The overloading of land resources and the expansion of construction land under rapid urbanization in northern Anhui, superimposed on the weak ecological background and resource constraints, have led to the ecological carrying capacity of carbon sequestration at a low level. Huainan is the prototypical low-low aggregation area. As of 2022, the cumulative area of coal mining subsidence in Huainan is about 290 square kilometers, and the urbanization rate is about 61%. The expansion of construction land results in an amplified carbon source effect. The carbon sink effect is relatively weakened, resulting in a low level of ESC. In the unusual regions of quadrants 2 and 4, just one city, Lu’an, has a high level of carbon sequestration ecological carrying capacity, encircled by areas with poor carbon sequestration ecological carrying capacity. The types of land in Lu’an are mainly farmland and forest land. The proportion of cultivated land is about 40-45%, and the proportion of forest land is about 30-35%. It possesses a favorable humanistic environment and abundant natural resources; yet, the radiation impact on its neighboring areas is minimal. Wuhu, being an industrial city, depends on high-energy-consumption industries for its economic development, resulting in substantial carbon emissions during production. It accounts for more than 60% of the city’s total carbon emissions. Tongling is a quintessential resource-dependent metropolis. The industrial structure is inefficient. Resource-based sectors, including non-ferrous, chemical, and construction materials, constitute over 70%, while coal usage represents more than 85% of overall energy consumption. The irrationalization of both the industrial and energy structures has resulted in a decline in ESC.
Table 2.
Results of Moran’s I test.
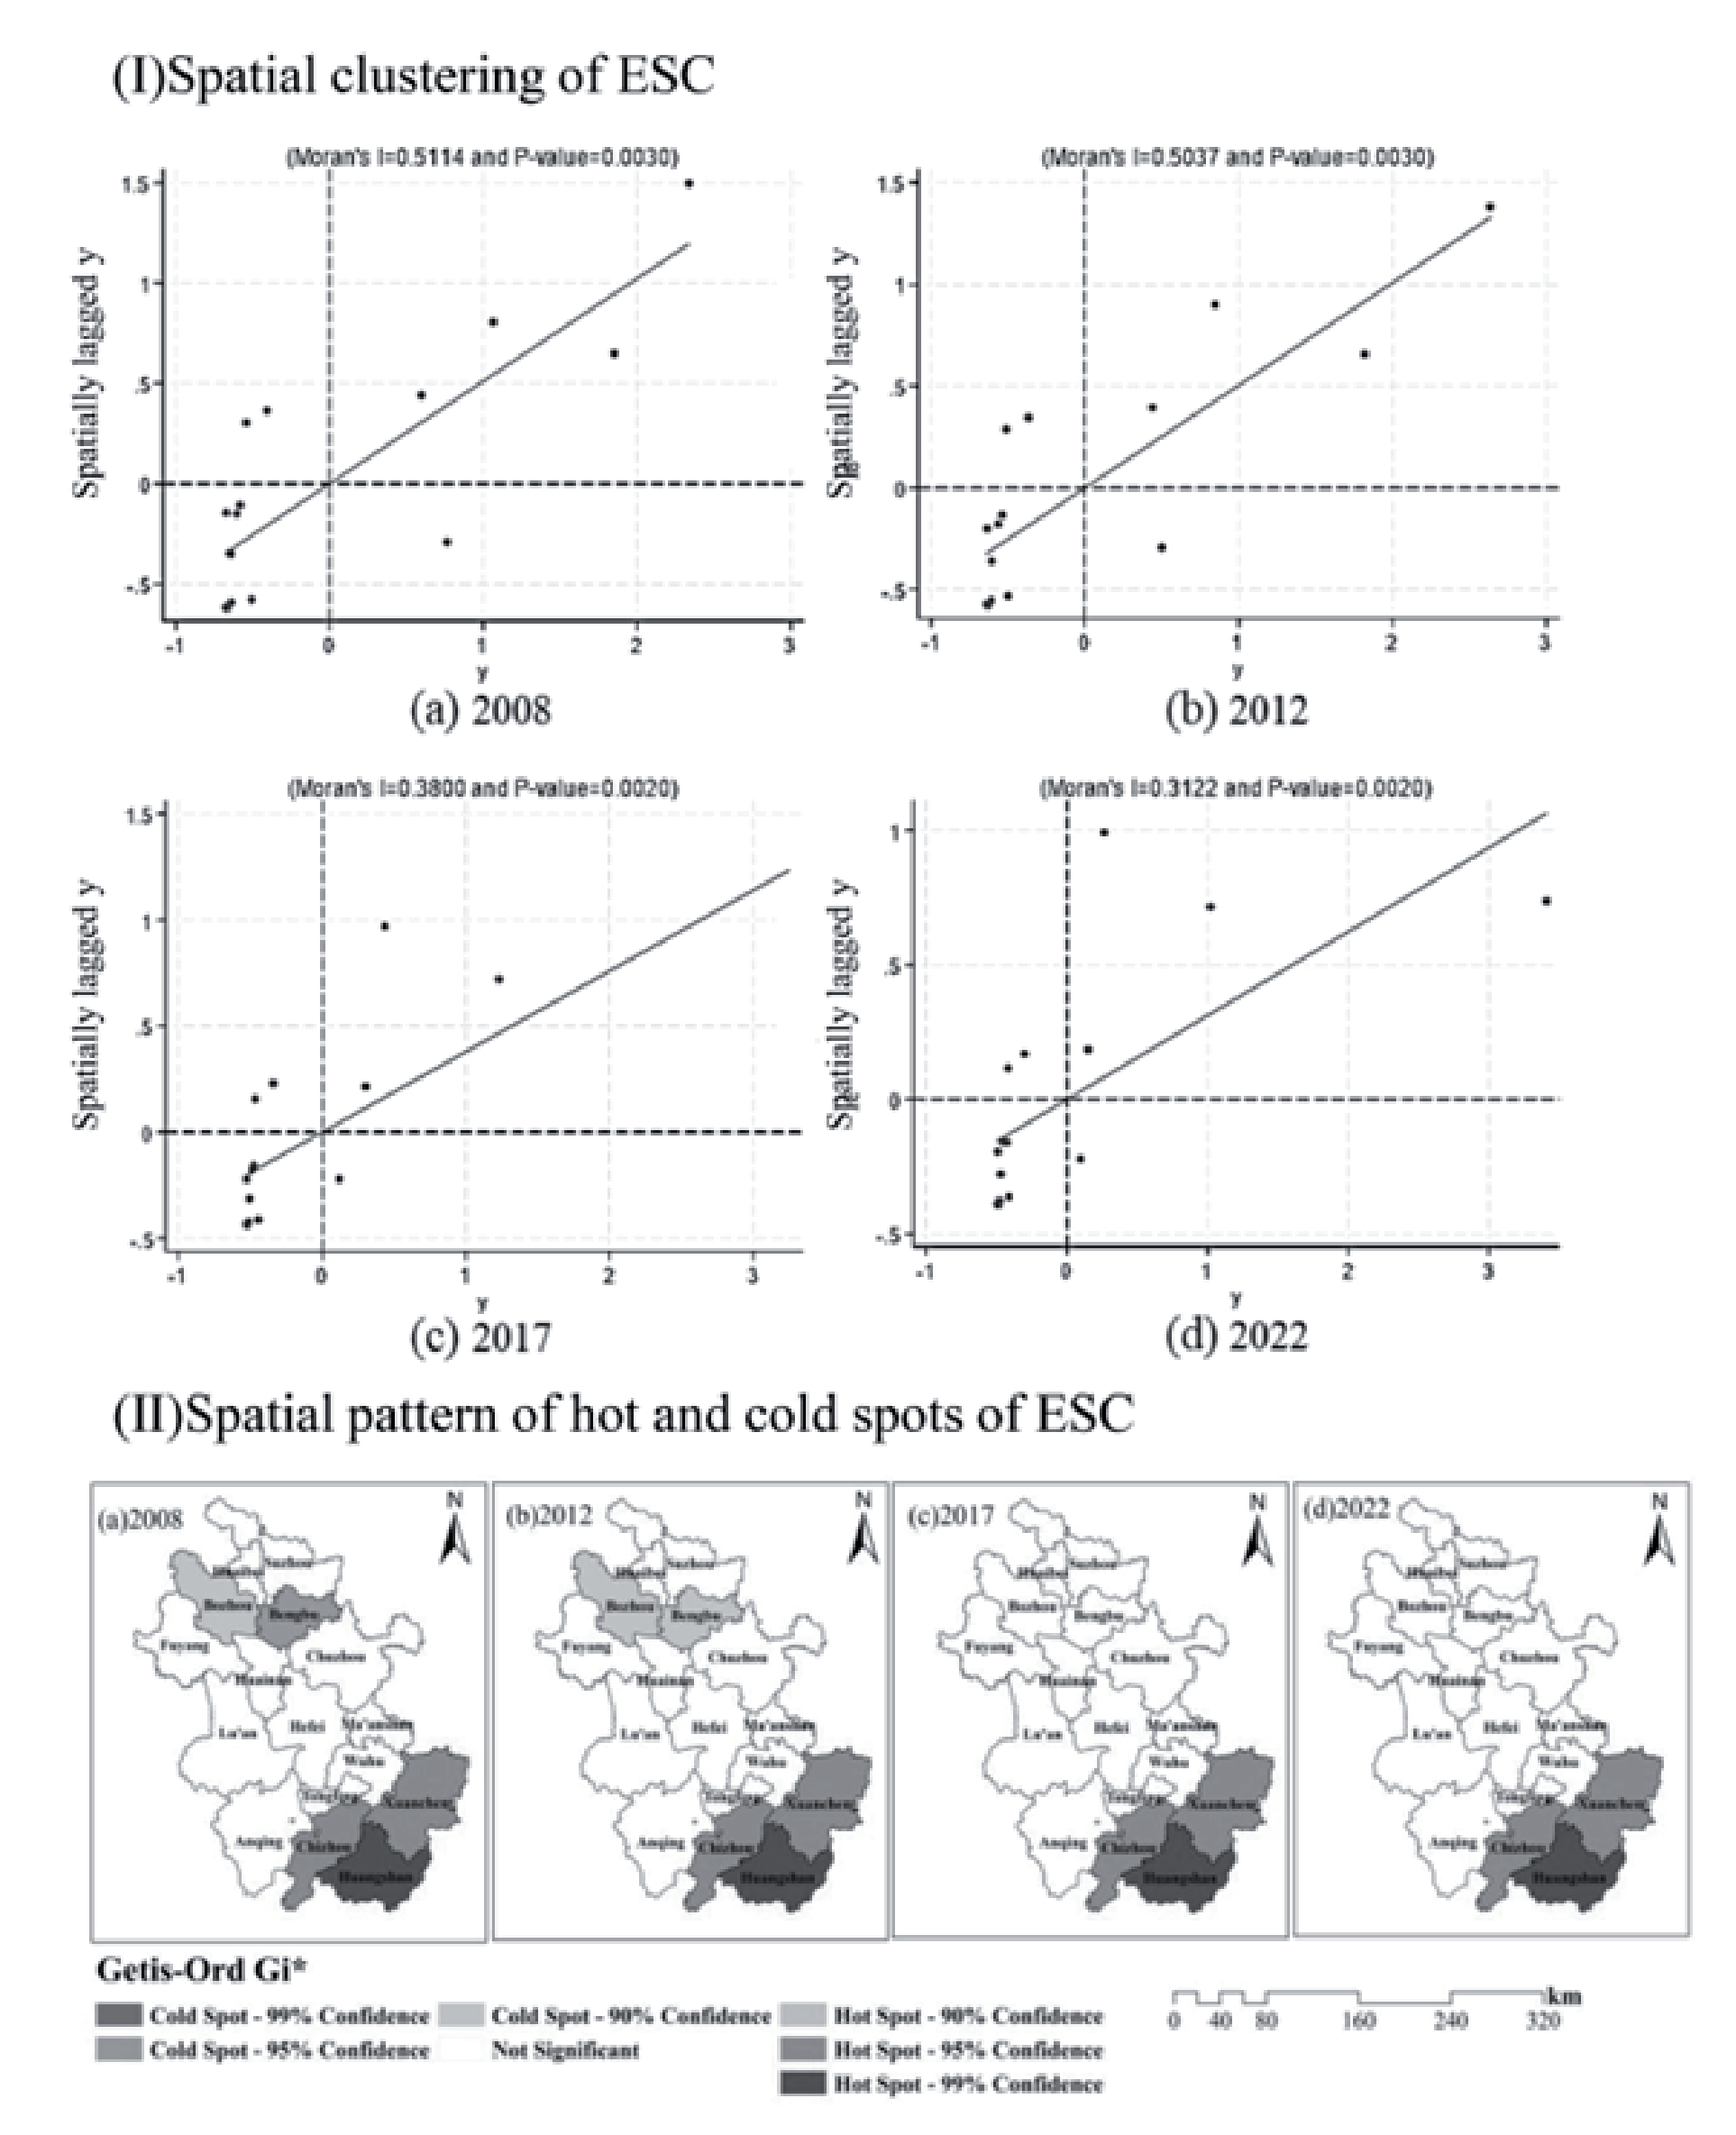
Cold hotspot analysis effectively detects spatial correlations in ESC patterns using the Getis-Ord Gi* index, which addresses the limitations of Moran’s I in uncovering spatial characteristics and enhances the detailed structure of autocorrelation. Hot and cold spot research can elucidate the geographical relationship between a municipality and its adjacent municipalities regarding ESC. This facilitates the discovery of hot and cold areas, namely spatial groups of high- or low-value items, within the study area. The findings of the cold hotspot analysis (Fig. 3 II)) indicate that the regions with high ESC in Anhui Province are predominantly located in southern Anhui, characterized by a favorable ecological environment. Their primary distribution is in Chizhou City, Huangshan City, and Xuancheng City. This aligns with the findings of the local Moran index investigation. The data indicate that the ESC in these locations is not only elevated but also exhibits a notable spatial concentration of high values. The ESC of these places much exceeds the average, resulting in the formation of a high-high hotspot. Furthermore, the study indicates that in 2008 and 2012, regions with low ESC in Anhui Province were predominantly located in areas characterized by robust industrial and economic activity, specifically in Bozhou City and Bengbu City. Post-2012, Anhui Province exhibits no discernible regions of low ESC, nor does it contain any low-low cold spots. This indicates that the ESC in the majority of the province is near or above the average level. No location exhibits a much lower than average ESC. The regional distribution of ESC is very equitable. In areas with comparatively low carrying capacity, the degree of carbon sequestration ecological carrying capacity is inadequate to create statistically significant low-low cold patches.
Table 3.
Factors influencing the ESC.
ESC Key Impact Factor Driver Analysis
Existing studies [29] examine the impact of social, economic, and environmental factors on ESC. The variables chosen for this investigation, along with data accessibility, are presented in Table 3. To guarantee data processing accuracy and enhance model performance, the data were standardized and outliers addressed, followed by the construction of Ridge regression (Ridge), eXtreme Gradient Boosting (XGBoost), Gradient Boosted Regression Tree (GBRT), Support Vector Regressor (SVR), and Random Forest model (RF). Upon evaluating the performance of these five models on the test set, it was determined that the Random Forest model exhibited a goodness-of-fit (R²) of 0.895, whereas Ridge Regression achieved an R² of 0.740, XGBoost recorded an R² of 0.859, Gradient Boosted Regression Tree (GBRT) attained an R² of 0.872, and Support Vector Regression (SVR) reached an R² of 0.881, with Random Forest significantly outperforming the other four models. Furthermore, regarding prediction error (RMSE), the random forest model exhibited an RMSE of 0.517, which was inferior to that of the other four models. Consequently, the random forest model shows superior performance in elucidating the principal determinants impacting carbon sequestration ecological carrying capacity in Anhui Province, with enhanced model accuracy.
ESC in the short term may be enhanced in long time scales. And vice versa, such changes may lead to different main influences on ESC under different time scales [30]. Three time scales of 5, 10, and 15 years were selected, and the driving mechanism of ecological carrying capacity (ESC) of carbon sequestration under different time scales was analyzed based on the random forest model (Fig. 4). In the 5-year scale analysis, water network density showed significant dominance (contribution = 0.81, p<0.001). Its unit increment (0.1 km/km²) enhances ESC by 12.3%. This is closely related to the efficient carbon sequestration capacity and microclimate regulation effect of watershed ecosystems. Among the second-order drivers, population density (contribution = 0.09) and air quality attainment (contribution = 0.07) showed negative (β = -0.21) and positive (β = +0.17) bias, respectively. The carbon source intensity of the overpopulated area (>540 people/ km²) amounted to 1.82 tCO2/million yuan, which was significantly higher than that of the low-density area. At the 10-year time scale, the dominant role of water network density showed a marginal decreasing trend (contribution decreased to 0.63, Δ = -22.2%), and its elasticity coefficient decreased from 0.81 (5 years) to 0.67 (p<0.01). At this time, the effect of population size (contribution 0.13, β = -0.29) and air quality attainment rate (contribution 0.13, β = +0.35) was significantly stronger. In particular, a 10 μg/m³ decrease in the annual average PM2.5 concentration could increase the efficiency of the vegetation carbon sink by 7%. In the 15-year scale analysis, the urbanization rate (contribution 0.19, β = -0.41) replaced the air quality attainment rate as the second driver (Fig. 4 I) and II)). The contribution of water network density further declined to 0.51 (Δ = -37.0%) and its coefficient of variation narrowed to 0.08, indicating that water resources development is close to the regional threshold (water resources per capita <500 m³). A 1% increase in the urbanization rate leads to a 0.7% increase in the rate of cropland loss, and it is worth noting that the long-term effect of population size (contribution of 0.11) is flattened by increasing aging (26.3% of the population over 60 years of age). The annual average PM2.5 concentration in Anhui Province in 2022 is μg/m³, a decrease of about 46% from 2015. The air deterioration is strongly controlled, and air quality is significantly improved on a long-term scale. In addition, the increase of water network density can improve the local climate and promote the growth of vegetation, while good air quality is conducive to plant photosynthesis, and the synergistic effect of the two can significantly enhance the carbon sequestration capacity of forests and green spaces, and improve the ESC. The influence of the role of the ESC in Anhui Province gradually decreases. While the population size and urbanization rate on ESC show a significant growth trend, the total population fluctuation is small, the urbanization rate increased significantly by 19.7%, and the energy demand of the urban population continues to increase. Population size and urbanization rate work together to produce a superimposed effect on ESC, with urbanization taking up more land and exacerbating the pressure of population growth on forests and green spaces. Weakening the carbon absorption capacity of forests and green spaces together suppresses ESC.
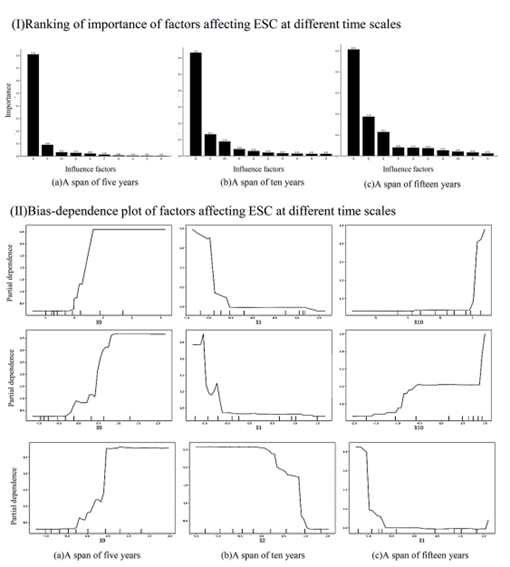
Table 4.
LM, Hausman, LR test results.
| Test | Statistic | P-value |
|---|---|---|
| LM test | 27.65*** | 0.000 |
| Hausman test | 673.15*** | 0.000 |
| Ind-LR test | 17.00 | 0.454 |
| Time-LR test | 548.65*** | 0.000 |
Table 5.
ESC regression results and influence effect decomposition.
ESC Spatial Response Analysis
The findings of Moran’s I test in Table 2 indicate a substantial regional association of ESC in Anhui Province. To further examine the spatial association of factors impacting ESC and the spatial spillover effect. The regression findings underwent the LM test, the Hausman test, and a two-way fixed effects likelihood ratio test. We conducted the regression analysis using the three fixed effects in the appropriate order. The LR test findings and the importance of each variable indicate that the regression of time-fixed effects is optimal (Table 4). The time-fixed effect spatial Durbin model (SDM) was ultimately chosen to regressively evaluate the impacts of social, economic, and environmental factors on the ESC in Anhui Province.
Table 5 (Ⅰ) displays the outcomes of the three regressions concerning carbon sequestration’s ecological carrying capacity. Table 5 Ⅰ Column (2) presents the impact of each explanatory variable on ESC and its relevance. The population size, urbanization rate, industrial structure, and fixed asset investment exert a substantial negative inhibitory influence on the ESC. The influence coefficient of industrial structure was -49.52, signifying that an increased proportion of secondary industry in GDP correlates with a diminished ESC. This is due to the elevated energy consumption and emission profiles of the secondary industry, particularly within a coal-centric energy framework, where energy usage and carbon emissions have escalated, hence diminishing the ecological potential for carbon absorption. Environmental control, scientific and technological innovation, water network density, and air quality compliance rate significantly enhance ESC. The coefficient of influence of water network density is 4.049, which predominates in enhancing ESC. The second factor is scientific and technological innovation, exhibiting an impact coefficient of 2.548. Innovations in science and technology can augment regional ESC by refining industrial structures, enhancing energy efficiency, and promoting the digitalization and intelligence of ecological governance. Four influential factors – population size, urbanization rate, water network density, and air quality attainment rate – demonstrated substantial effects, aligning with the findings of the random forest regression.
The spatial lag component in the spatial Durbin model inhibits conventional point estimates from effectively reflecting the spillover effects of explanatory factors. Consequently, more comprehensive methodologies are required to examine the impacts of these variables. The overall spatial spillover effect is categorized into direct and indirect effects. The direct effect denotes the extent to which local explanatory variables impact the carbon sequestration ecological carrying capacity. The indirect effect denotes the extent to which the explanatory factors in adjacent regions impact the carbon sequestration ecological carrying capacity. Table 5 Ⅱ displays the outcomes of the decomposition of particular spatial effects. Table 5 Ⅱ illustrates that the direct and spatial spillover effects of population size (X1), urbanization rate (X2), industrial structure (X5), and fixed asset investment (X6) are markedly negative. The coefficients for the direct effects are -0.958, -0.394, -34.29, and -0.185, whereas the coefficients for the geographical spillover effects are -0.462, -0.402, -70.23, and -0.426, respectively. The spatial spillover impact of X5 exhibits significant inhibition, demonstrating that a 1% increase in X5 decreases the local ESC by 34.29% (direct effect) and concurrently diminishes the nearby ESC by 70.23% via industrial gradient transfer. The rise of X1, X2, X5, and X6 in each region of Anhui Province significantly hampers the growth of ESC in that region and its adjacent territories. It indicates that areas with high ESC are encircled by regions characterized by comparatively low population, urbanization rates, secondary industry contributions to GDP, and fixed asset investments. The escalation of these elements obstructs the advancement of ESC in Anhui Province by elevating resource usage and carbon emissions and diminishing ecological space. The direct and spatial spillover effects of environmental legislation (X3), scientific and technological innovation (X7), water network density (X9), and air quality attainment rate (X10) are notably positive. The values for direct effects were 0.0506, 0.0607, 10.04, and 0.157, whereas the coefficients for spatial spillover effects were 0.0270, 2.480, 4.043, and 0.148, respectively. Regions X3, X7, X9, and X10 in Anhui Province substantially boost ESC in the region and its vicinity. The geographical spillover effect also positively influences adjacent places, collectively enhancing the improvement of ESC in the region and beyond. The spatial spillover impact of X9 demonstrates a significant enhancement, suggesting that a 1% increase in X9 results in a 10.04% improvement in the local ESC and a 4.043% enhancement in the surrounding ESC.
Discussion
This research initially assesses the carbon sequestration, carbon emissions, and the ESC in Anhui Province from 2008 to 2022. Carbon sequestration is 2.598×10⁶ t in 2008 and decreases to 2.512×10⁶ t in 2022. Carbon emissions are rising significantly, with a cumulative increase of 127%. the overall ESC is showing a downward trend. The regional distribution of ESC is examined. The findings indicate a marginal decline in carbon absorption in Anhui Province. Carbon emissions rose markedly. The ESC initially rises and subsequently declines. The ESC exhibits notable regional clustering. High-high clustering regions are predominantly located in southern Anhui, while low-low clustering regions are primarily found in northern Anhui. This exhibits both the same agglomeration and the contrasting pattern of regional and temporal differentiation of carbon emissions in Anhui Province [31-35]. Between 2008 and 2012, regions exhibiting low ESC were primarily located in northern Anhui, characterized by elevated urbanization rates and a significant proportion of secondary industry, alongside substantial consumption of coal and other fossil fuels. Post-2013, no areas with low ESC were identified. The areas of ESC in Anhui Province are predominantly located in southern Anhui, characterized by a significant share of cultivated land, and are spread sporadically. It demonstrates a robust geographical association. This contradicts the finding that carbon emission hotspots are primarily located in the northern region of Anhui Province, while cold spot areas are predominantly found in the southern and western mountainous regions, exhibiting a progressively declining tendency [36-38]. This signifies that the ESC diminishes in areas with elevated carbon emissions, and conversely. The article utilizes the combination of the direct carbon emission factor method and the indirect estimation method to estimate the carbon sequestration, carbon emission, and ESC level in Anhui Province. However, the static carbon sequestration estimation method still lacks the consideration of spatial scale error, industrial structure bias, and dynamic changes. Further exploring the spatial and temporal evolution of ESC, the shrinking trend of the carbon emission cold spot area (southern mountainous area) contradicts the persistence of the ESC hot spot area. It may reflect the carbon leakage effect caused by ecotourism development, which needs more in-depth analysis and research.
This paper examines the primary factors influencing the carbon sequestration ecological carrying capacity in Anhui Province, considering the region’s natural geographic distribution, economic, and social development trends, alongside findings from prior research [39-42]. Potential factors influencing the carbon sequestration ecological carrying capacity in Anhui Province are categorized into three dimensions: economic, social, and environmental. In contrast to the singular examination of influencing factors [43-46], this paper utilizes random forest and spatial Durbin models. Starting from both factor-driven and spatial response. It contains different time scales and different spatial dimensions to explore in depth the complex links between economic and social development, natural geographic differences, and ESC in Anhui Province. This paper employs random forest and spatial Durbin models, considering various temporal dimensions and geographic influence effects. Previous studies [47- 49] indicate that industrial structure and economic development have increasingly emerged as significant elements contributing to the escalation of carbon emissions. This study indicates that the industrial structure and economic development in Anhui Province exert minimal influence on the ESC. The primary determinants influencing the ESC in Anhui Province include water network density, population size, air quality compliance rate, and urbanization rate. The research identified a threshold influence on the ESC. This aligns with the result of Wang et al. that when influencing factors rise, the research subject ultimately stabilizes, exhibiting neither a distinct positive nor negative effect [6]. The air quality attainment rate can only make a substantial beneficial impact if it is above a specific threshold. Moreover, the spatial Durbin model, although corroborating the findings from random forests, further establishes that there exists a considerable spatial spillover impact of these influencing elements. When the article explores the influencing factors of ESC in Anhui Province, the 10 key factors selected do not include all the influencing factors. Subsequent studies should explore the complex relationship between factors such as technological bottlenecks, insufficient funds, regional development imbalance, traditional industry dependence, green technology application, ecological resource transformation, policy support, and regional synergy and ESC in Anhui Province.
Conclusions
This article utilizes the CLCD dataset alongside economic, social, and environmental statistics within the framework of the dual-carbon target. This study assesses the carbon sequestration ecological carrying capacity in Anhui Province and examines the spatial and temporal distribution patterns of this capacity, along with its affecting elements at the municipal level. The study deduces the subsequent findings.
(1) Carbon sequestration in Anhui Province exhibited a generally stable albeit variable declining trend throughout the study period, with an average annual reduction of 0.26%. Conversely, carbon emissions persisted in their ascent, with an average annual growth rate of 6.8%, culminating in a cumulative increase of 127%, which led to an overall decline of 22.00% in the ESC index. The ESC in Anhui Province exhibits spatial distribution patterns characterized by “higher in the south and lower in the north” and “higher in the east and lower in the west”. The regions with low ESC are situated within the industrially developed northern Anhui urban agglomerations, whereas the areas with high ESC are located in the southern Anhui urban agglomerations, which possess a more favorable ecological environment. Anhui Province continues to encounter substantial obstacles in attaining the “double carbon” objective. The north-central region of Anhui Province is a critical focus for future ESC improvement. The extent of green space must be augmented to prevent the unchecked proliferation of urban development. To enhance spatial aggregation of ESCs, it is essential to bolster regional carbon management collaboration, particularly in areas characterized by large carbon emissions and low ESC levels. Advocate for regional collaboration in scientific and technological innovation as well as environmental stewardship. Implement the three pillars of industrial rebuilding in northern Anhui, value realization in southern Anhui, and standard leadership in central Anhui. Develop a multi-tiered, nested carbon-neutral route system. Anhui Province must address the deficiency in green investment by prioritizing industrial technical reform and ecological restoration. Furthermore, we must seize the chance for technical advancement. Leveraging the benefits of the new energy industry chain and the facilitation of digital technology, the achievement of the “dual-carbon” objective necessitates overcoming the “high-carbon lock-in effect” and the “ecology-economy dichotomy” through synergistic innovation among technology, funding, and institutions.
(2) The extent of ESC in Anhui Province is considerably influenced by the density of the water network, population size, air quality compliance rate, and urbanization rate. The impacts of each component on ESC are characterized by dynamic variations in distinct time frames. As they ascend to a specific threshold, ESC will ultimately stabilize. These primary components have considerable regional spillover effects. The swift urbanization of Anhui Province has resulted in a population concentration in urban areas. Moreover, transportation, building, and other sectors exhibit significant energy consumption and elevated carbon emission intensity. This exacerbates the challenge of mitigating emissions in Anhui Province. Anhui Province serves as a significant region in the central area, facilitating the connection between the north and south. ESC-enhancing measures should be tailored according to climatic and regional variables. It should concentrate on regulating urban expansion, decreasing population density, and enhancing urban spatial organization. Creating a platform for the coordinated management of water networks and improving the spatial equilibrium of carbon sequestration via an intercity water dispatch compensation system. Correlate the urbanization rate with carbon sink reserves. Implement the linking mechanism for “carbon footprint - household registration points”. Recognize population density limitations and spatial reconfiguration. Offer theoretical justification for the achievement of global climate objectives.

