

Introduction
Since the reform and opening up, the Yangtze River Delta (YRD) region has become one of the world’s most innovative and dynamic regions, depending on its excellent location, efficient resource allocation, and strong radiation-driven function. For a long time, the economic growth of the YRD region has relied on the development mode of high pollution and high consumption, which has resulted in increasingly serious resource and environmental problems [1]. In addition, due to large-scale property development and infrastructure construction, the infrastructure investment has been high. Social and livelihood investment is disproportionate to infrastructure investment. Therefore, the CPC Central Committee and the State Council of China have requested that the YRD region accelerate the formation of sustainable production and a more sustainable living lifestyle. In recent years, the inefficiency of regional sustainable innovation and uncoordinated spatial distribution in some areas of the YRD region has become the main constraint limiting some cities from building a new development pattern [2]. In this context, a comprehensive understanding of the spatial and temporal evolution characteristics of RSIE and an in-depth investigation of the driving forces of RSIE are of great practical significance for optimizing the allocation of innovation factor resources, perfecting the regional innovation and development system, promoting the construction of a new development pattern, forming new quality productive forces, and facilitating the integrated development of the YRD region.
Sustainable innovation refers to the innovation model that follows the concept of sustainable development in the innovation process and promotes the sustainable development of society, economy, and ecology [3]. Generally speaking, sustainable innovation focuses on examining the situation of undesirable outputs in the regional innovation process, emphasizes innovation activities with sustainable development at the core, focuses on the fairness, continuity, and commonality of the innovation process, and aims to enhance the contribution of innovation to the ecological environment, economic construction, and social development. RSIE refers to the process of maximizing innovation outputs while minimizing negative innovation effects under a given level of inputs [4]. Under the perspective of sustainable development, the improvement of the RSIE aims to make full use of limited innovation resources to ensure the maximization of desirable outputs and, at the same time, reduce the negative impacts of innovation activities on the ecological environment and social life.
In recent years, scholars worldwide have carried out indirect theoretical discussions and practical research on sustainable innovation and its efficiency, which are mainly characterized by the following three features:
(1) Varied Research Region Levels. At the macro level, scholars take administrative regions at all levels as the main body, compare the differences among them, and analyze the characteristics of the spatial and temporal distribution of innovation efficiency, change trends, and influencing factors among administrative regions [4-6]. At the micro level, scholars focus on a certain industry to explore the influencing mechanism [7], driving forces [8], and optimization path [9] of RSIE. (2) Multiple Research Perspectives. On the one hand, scholars have explored the RSIE of specific industries, including manufacturing industry [6], pharmaceutical manufacturing industry [10], financial industry [11], etc., and deeply explored the impact of these industries on regional sustainable innovation. On the other hand, focusing on the economic, social, and ecological dimensions of sustainable innovation, scholars have studied green innovation efficiency [12], technology innovation efficiency [13], and science research efficiency [14].
(3) Studies relying on diversified research methods for the measurement of innovation efficiency typically use Data Envelopment Analysis (DEA) [15], Stochastic Frontier Analysis (SFA) [16], and other methods. In the analysis of influencing factors and drivers, studies usually use methods such as the Spatial Durbin Model (SDM) [17], the Tobit model [18], and Geodetector [19].
In summary, academics have achieved a great deal on sustainable innovation, laying a solid foundation for this research. However, some research deficiencies still exist, as follows. – The scope of RSIE should be further expanded.
The “Matthew effect” of regional innovation tends
to marginalize the main body of innovation and
exacerbate the unbalanced distribution of innovation
factors [20], which is not conducive to sustainable
innovation. – Future development trends should be taken into
account. Most studies on the spatiotemporal
evolution of innovation efficiency focus on spatial
heterogeneity and spatial differences. Innovative
activities can not only solve current problems,
but more importantly, they are future-oriented.
The depiction of spatial patterns should involve
predicting future development trends. – More consideration should be given to the spatial
correlation of driving forces. The bidirectional
spatial spillover effects and the locking feature of
innovation make the spatial correlation of innovation
complicated [21]. At the same time, the traditional
regression model lacks effective research on the
spillover effect of innovation.
The main contributions made in this paper to bridge these gaps are as follows: (1) A comprehensive measurement system of RSIE based on sustainable development theory was constructed, and the RSIE of 41 cities in the YRD region was measured using the Super-efficiency SBM-Undesirable model. (2) By utilizing the standard deviation ellipse to portray the spatiotemporal pattern of RSIE, the NICH index and Hurst index were introduced to comprehensively analyze the future development trend of RSIE in the study area.
(3) Spatial econometric models were used to examine the impact of various innovation environment factors on RSIE and analyze these factors’ spatial spillover effects. (4) The policy implications behind the study’s findings are explained, and corresponding suggestions are given on this basis, which is of great significance for improving the overall effectiveness of regional coordinated development.
Materials and Methods
Study Area
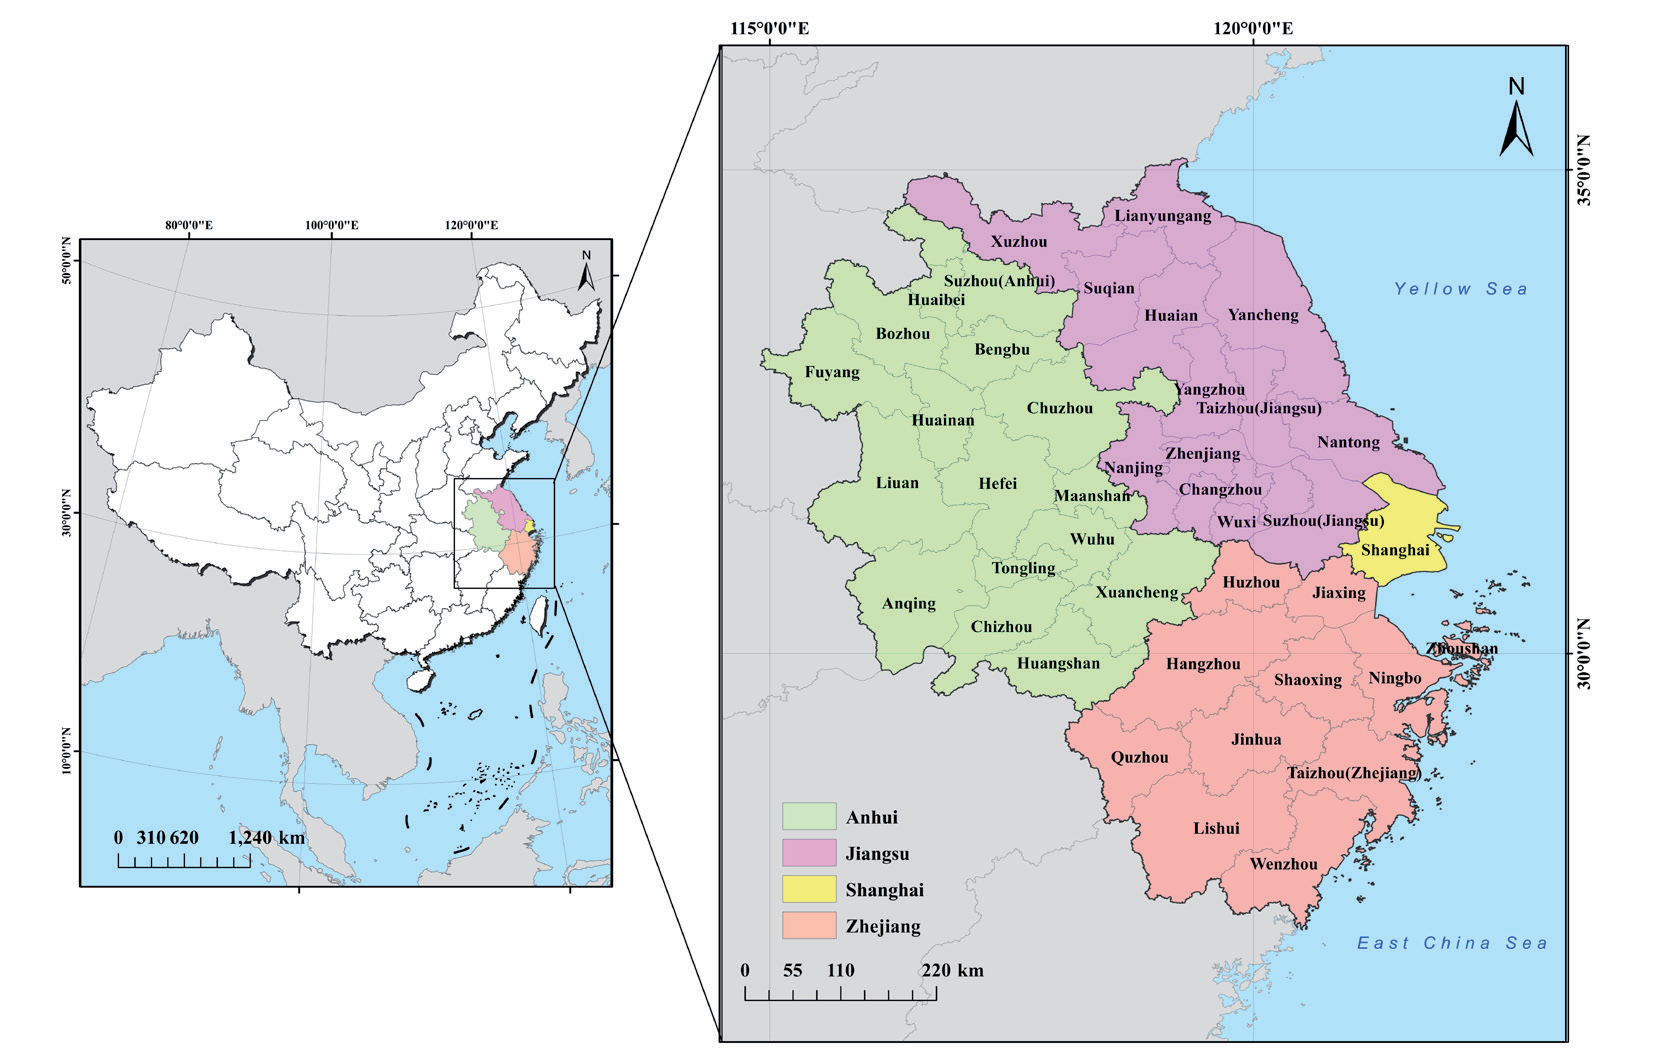
The YRD region is located in the eastern part of China and consists of 41 cities at the prefecture level and above in four provincial-level administrative regions, namely Shanghai, Jiangsu, Zhejiang, and Anhui Provinces (Fig. 1). The YRD region is one of the regions with the most active economic development, the highest degree of openness, and the strongest innovation capacity in China. By 2022, the region’s resident population had reached 240 million, accounting for 17.0% of the country’s total population. By 2023, the regional GDP had reached 30.5 trillion yuan, accounting for 24.2% of the GDP of China. The YRD region is rich in innovation resources and has well-developed innovation factors. The regional R&D investment exceeds 0.6 trillion yuan. Moreover, the region has 462 general and vocational higher education institutions, which continuously inject new vitality into the innovation development of the YRD region. Since the 14th Five-Year Plan, the integrated development of the YRD region has risen to the level of a national strategy, giving full play to the leading demonstration role of the YRD region in promoting the process of Chinese-style modernization.
After decades of development, the YRD region has grown to be the ballast of China’s economy and is the central region of the national economy, a manufacturing highland, a frontier of scientific and technological innovation, and a window for opening up to the outside world. In recent years, the YRD region has been actively exploring green development, incorporating the construction of ecological civilization into regional development planning, increasing ecological environmental protection, promoting industrial restructuring, and building a green development system, which is significantly ahead of other regions in the country. Therefore, this study selects the three provinces and one city in the YRD region, which are of typical significance, as the study area.
Research Methodology
Super-Efficiency SBM-Undesirable Model
The traditional Data Envelopment Analysis (DEA) method assumes an efficient frontier, which leads to multiple results of 1 on the DEA frontier for RSIE in multiple cities at the same time. In addition, the traditional DEA method also causes errors due to the selection of radial direction and angle, which ultimately leads to biased analysis results that are not conducive to decision-making. For this reason, this paper adopts the super-efficiency Slack-Base Measure (SBM) model, which considers slack variables and undesirable outputs, to measure the RSIE. The SBM model has been widely applied in the field of DEA due to its advantages, such as a non-radial and non-angular measurement approach, more precise identification of inefficient units, and effective handling of undesirable outputs, which can provide efficiency evaluations more aligned with real-world situations. The specific formula is:
(1)
In formula (1), ρ is the RSIE of the decision unit; n is the number of decision units; m is the number of input indicators in each decision unit; s is the number of output indicators in each decision unit; x is the RSIE inputs in the corresponding matrix; yg is the desirable outputs; yb is the undesirable outputs; and λ is the vector of weights.
Standard Deviation Ellipse
Standard Deviational Ellipse (SDE) is a method of visualizing the characteristics of the spatial distribution of objects, which intuitively reveals spatially the directional deviation (agglomeration or dispersion) characteristics of the study elements in the geographical distribution [22]. The specific formula is:
(3)
In formulas (2), (3), (4), and (5), (XSIE, YSIE) are the coordinates of the center of gravity of RSIE in the YRD region; θ is the azimuth of the standard deviation ellipse; ∂x, ∂y are the standard deviations along the x-axis and the y-axis, respectively; n is the number of cities at the prefectural level and above in the YRD region; xi, yi are the spatial areas of the distribution of RSIE; xi, yi are the deviations of the coordinates of the 41 cities at the prefecture level and above in the YRD region from the center of mean; and wi is the weighting.
NICH Index
The NICH index, which measures the relative development rate, can be used to explore the development trend of RSIE during the study period. The NICH index, as a measure of the dynamism of RSIE, can be used to reflect the characteristics of the changes in RSIE in the time scale and is calculated by the following formula:
In formula (6), E0, Et represents the RSIE values at the beginning and the end of the study in this region, respectively, and E0i, Eti represents the RSIE values at the beginning and the end of the study in the i-th prefectural-level city and above, respectively.
Hurst Index
The Hurst index is an effective method for quantitatively describing the long-range dependence of a time series [23]. In this paper, the Hurst index reveals the continuity and strength of the time series trend of RSIE in the YRD region. The basic principles are:
For the time series {E(t)}, t = 1, 2, ..., n, define the mean series:
Cumulative deviation:
Extremely poor:
Standard deviation:
If there exists R/S∝TH, it means that there is a Hurst phenomenon in the time series {E(t)}, t = 1, 2, ..., n, with R/S being R(T)/S(T) and H being the Hurst exponent. The value of H is equal to the slope of the straight line fitted by least squares to R/S in the coordinate system of ln (R/S) – ln T, H ∈ (0,1).
In the above formulas (7), (8), (9), and (10), E is the value of RSIE. When H ∈ (0,0.5), the trend of a shift in RSIE in the region is opposite to the past, it is called the anti-sustainability development trend; H = 0.5, it means that the change of RSIE has nothing to do with the past; H ∈ (0.5,1), it means that the trend of change of RSIE is the same as that of the past, with continuity, and it is called the continuity development trend.
Spatial Econometric Models
This study uses spatial econometric modeling to explore the driving forces of RSIE in the YRD region. Compared with the traditional least squares regression analysis, spatial econometric models take into account the complex spatial correlation and spatial dependence of the samples. The commonly used models include the spatial error model (SEM), the spatial lag model (SAR), and the Durbin model (SDM). The specific formulas are as follows:
In the above formulas (11), (12), and (13), ln y is the RSIE, i.e., the explanatory variable; X is the explanatory variable; ψ is the time fixed effect; μ is the spatial fixed effect; ɛ is the random perturbation term; λ is the spatial correlation coefficient of errors; γ is the spatial spillover coefficient of each explanatory variable; ρ is the spatial spillover coefficient of the explanatory variable; and W is the spatial weighting matrix.
The setting of the spatial weight matrix W is the key to spatial measurement. In this paper, the inverse distance matrix (D) is constructed as the baseline spatial weight matrix using the geographic coordinates of the center of mass of cities at all levels and above. In addition, the robustness of the spatial measurement results is tested using the economic distance matrix (G) constructed with the regional GDP as the benchmark.
Selection of Indicators
Based on the current situation of economic and social development in the YRD region and the development goal of regional integration in the YRD region, this paper refers to existing indicator systems [3, 24, 25] and constructs RSIE measurement indexes (Table 1) in the YRD region based on the inputs, desirable outputs, and undesirable outputs.
Data Sources
The 41 cities at prefecture level and above in the YRD region from 2012 to 2021 are taken as the research objects, and the data are obtained from China Urban Statistical Yearbook, China Science and Technology Statistical Yearbook, and Statistical Yearbooks and Statistical Bulletins of cities at prefecture level and above in the YRD region in the past years. Science and technology expenditure refers to the funding expenditures of the government and its related departments to support scientific and technological activities, generally arranged within the national budget for scientific research. The data in the high-level papers comes from the Web of Science database. The data on patents comes from the State Intellectual Property Office. “Three-waste pollution” refers to the total emissions of industrial sulfur dioxide, industrial smoke and dust, and industrial wastewater. Some of the missing data is filled in by linear interpolation.
Results and Discussion
Time-Series Characteristics of RSIE in the YRD Region
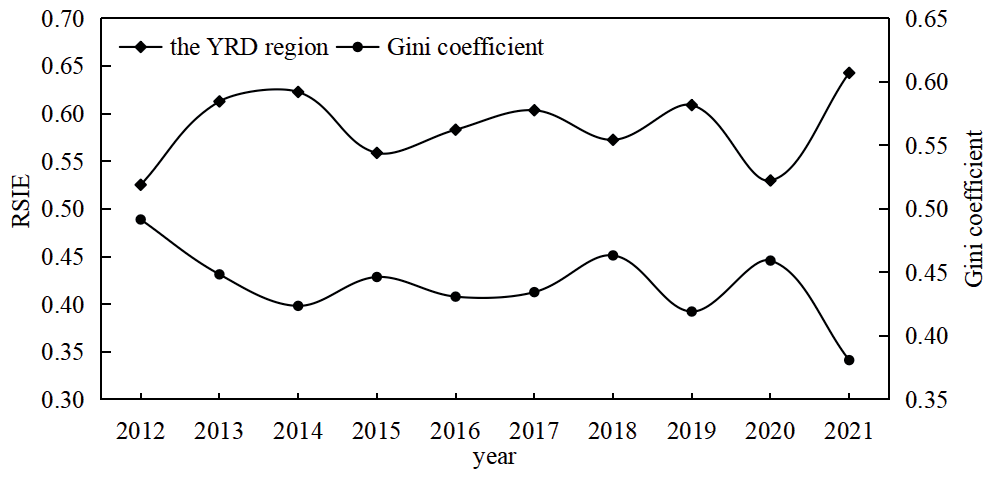
The super SBM-Undesirable model measures the RSIE of 41 cities and the Gini coefficient in the YRD region (Fig. 2). The results show that the RSIE in the YRD region has three stages of evolution from 2012 to 2021.
Table 1.
Indicators of regional sustainable innovation efficiency.
Stage I (2012-2015): The RSIE shows a rapid growth and then a sudden decline, with regional differences narrowing during this period. At this stage in the ‘12th Five-Year Plan’ period, the YRD region is in the stage of deep adjustment of industrial structure. The traditional manufacturing industry is facing the pressure of transformation and upgrading. Shanghai, Jiangsu, and other places have made great efforts to eliminate backward production capacity and transform into high-end manufacturing and service industries. In the process of industrial transformation, the region actively explored new directions, introduced some advanced technologies and talents, and promoted the formation of distinctive industrial clusters and industrial chain cooperation, which strengthened inter-regional economic ties and technological exchanges and led to a more reasonable allocation of innovation resources in the region, narrowing regional differences. However, in this process, when external technology introduction is restricted, and the capital chain is short due to the turbulence of the international financial market and other reasons, innovation resources cannot be continuously invested, which causes a sudden decrease in the innovation efficiency of some cities.
Stage II (2015-2018): The RSIE shows a slow, fluctuating growth trend, with regional differences increasing. During this period, with the in-depth implementation of the national ‘Three Goes, One Down, One Supplement’ and the supply-side structural reform, resources flowed from the surplus and inefficient industries to the emerging innovative industries. Capital flowed back to the real economy innovation field, which drove the inter-regional production capacity transfer, cooperation, and innovation. In the process of capacity transfer, regions with relatively lower levels of economic development, such as Anhui, undertook industries from developed regions. These regions welcomed advanced technology and management experience brought by the transferred industries. However, various reasons, such as the mismatch between the local industrial foundation and new technologies, along with backward production capacity, failed to effectively improve the local innovation status quo. Meanwhile, it also led to an increase in local undesirable ecological output.
Stage III (2018-2021): The RSIE shows a sharp upward fluctuation, with narrowing regional differences. This stage is significantly affected by both global trade protectionism and the COVID-19 pandemic. Western countries have tightened export controls on China’s high-tech products. In response to this situation, China has substantially increased its independent R&D investment, which has effectively fostered a local innovation ecosystem and facilitated the integration of the domestic market and the diffusion of innovation. The impact of the pandemic has led to disruptions in the industrial chain and supply chain, with many industrial enterprises nearly shutting down. Moreover, budget allocation has caused a notable shift in government spending on science and technology in favor of healthcare. Meanwhile, due to the stringent restrictions on the movement of people, the free flow of innovation factors among regions has been hampered to some extent.
Characteristics of Spatial Evolution of RSIE in the YRD Region
General Distribution Characteristics
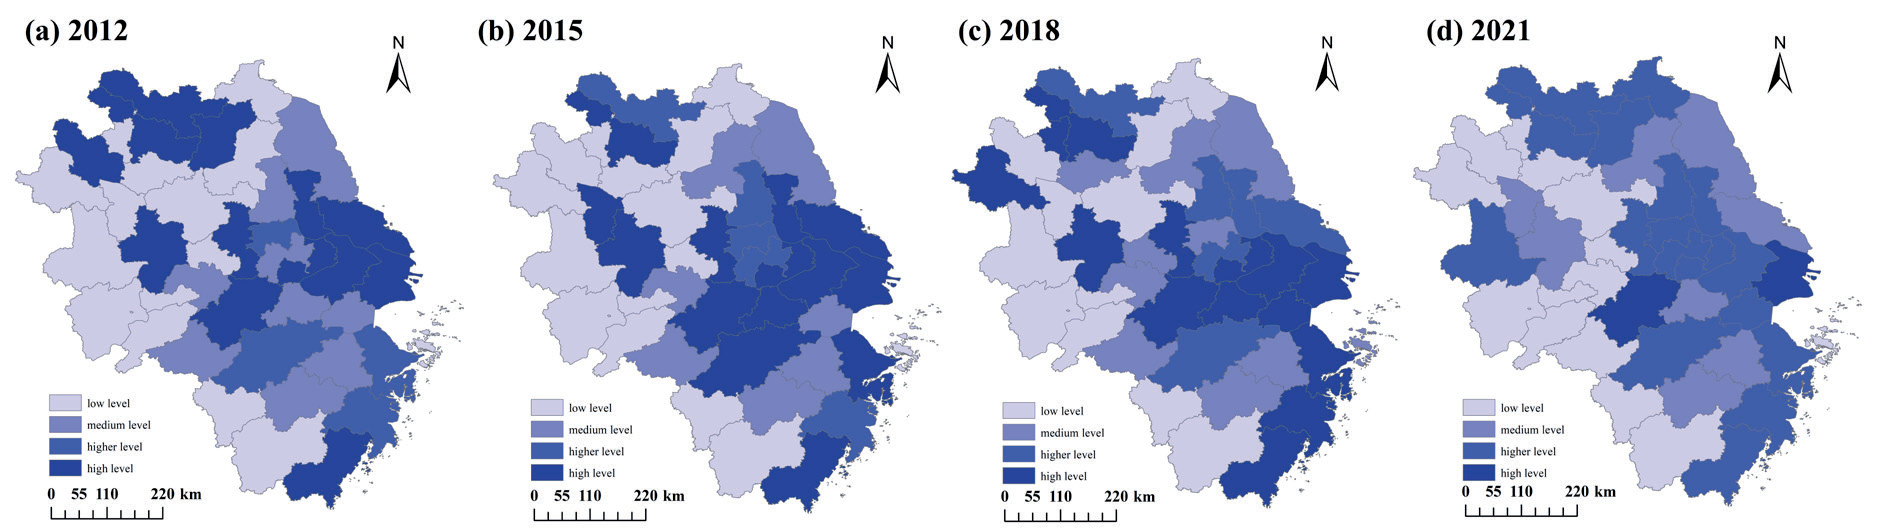
Using the natural breakpoint method, the RSIE of 41 cities in the YRD region was classified into four different development levels, namely, high level, higher level, lower level, and low level. Four nodes in 2012, 2015, 2018, and 2021 were selected as representatives to map the spatial and temporal evolution characteristics of RSIE in the YRD region (Fig. 3). There are significant differences in RSIE among the 4 provincial-level administrative regions, roughly showing the pattern of “Shanghai > Jiangsu > Zhejiang > Anhui”.
Fig. 2.
The temporal evolution of regional sustainable innovation efficiency in the Yangtze River Delta region from 2012 to 2021.
High-level cities are mainly concentrated in regional central cities and their vicinity, represented by the Shanghai-Nanjing and Shanghai-Hangzhou axes, as well as cities such as Hefei, Xuzhou, and Wenzhou. These developed regions possess distinct first-mover advantages manifested in early policy support for attracting innovative resources and strategic industrial layouts. Thanks to these advantages, they have successfully attracted a large number of innovative factors such as talents, capital, and technology, thus forming a favorable innovation ecology. In terms of innovation environment, most of these cities have numerous higher education institutions, research institutes, and high-tech enterprises and relatively well-developed mechanisms for collaborative development and cooperation among industries, universities, and research institutes, which facilitates the accumulation of more efficient talents and the birth of new technologies. In terms of innovation networks, the spatial geographical proximity of high-level cities facilitates the regions’ access to innovation spillover knowledge. Simultaneously, the integration strategy of the YRD region focuses more on creating advanced manufacturing clusters with international competitiveness. Through a series of policies and measures, regional administrative barriers have been effectively broken down, endowing these cities with economic organizational proximity and institutional proximity. As a result, under conditions of relatively stable proximity, their innovation efficiency tends to remain high. However, due to the “siphoning effect” of high-level cities, their neighboring regions show the phenomenon of “efficiency depressions”. Low-level cities are mainly concentrated in Anhui and southwestern Zhejiang. Most have a relatively weak economic base and lack government investment in science and technology innovation. Traditional industries still occupy the majority of the positions, and there is a lack of innovative mainstays such as universities and high-tech enterprises.
From the perspective of spatial diffusion, the RSIE in the YRD region is characterized by both contagious diffusion and hierarchical diffusion. Contagious diffusion is the process where innovation spreads outward from the center based on geographical proximity, following axes such as transportation corridors and river systems between cities. Hierarchical diffusion, on the other hand, is a process of downward diffusion based on relational proximity, which is limited by the “cognitive threshold” of new technologies. The RSIE in the YRD region shows a spatial evolution pattern of diffusion from high-level central cities such as Shanghai, Nanjing, etc., to their surrounding cities and regional sub-centers such as Xuzhou, Wenzhou, Hefei, etc. This evolution is characterized by a shift from clustering to decentralization, with the number of low-level regions gradually decreasing during the study period, which contributes to the balanced development of sustainable innovation efficiency in the YRD region.
Standard Deviation Elliptic Analysis
The standard deviation ellipse of the RSIE in the YRD region for the six years of 2012, 2014, 2016, 2018, 2020, and 2021 was calculated using ArcMap 10.2, as shown in Fig. 4. The results reveal that the standard deviation ellipse of RSIE in the YRD region exhibits a distinct directional characteristic, presenting a distribution pattern of “Southeast-Northwest”, which reflects that the overall distribution pattern of RSIE in the local region remains relatively stable. The center of gravity of the standard deviation ellipse is consistently located in Changzhou, and its migration direction demonstrates the characteristic of “first moving to the south, then to the north”. From 2012 to 2018, the center of gravity of the ellipse significantly shifted to the south. The ellipse tended to flatten, and the azimuth angle decreased, indicating that the RSIE of the cities in the southwestern part of the YRD region has improved. During this period, certain industries with high sensitivity and environmental impacts relocated from the core area of the YRD region to its periphery. The relatively lower labor costs and abundant land in these peripheral areas provided favorable conditions for industrial agglomeration. Through the flow of technology, talent, and capital, the RSIE was enhanced. Policy played a crucial role in facilitating this shift. The Anhui River Urban Belt Industrial Transfer Demonstration Zone, a national-level demonstration zone located in the southern part of Anhui, was developed through cooperation and the establishment of joint development parks. This zone focuses on industrial upgrading to build a modern industrial system. From 2018 to 2021, the center of gravity of the ellipse initiated a shift towards the north, and the azimuth angle gradually increased, which indicates that the RSIE in the eastern and northern parts of the YRD region is experiencing rapid growth. On the one hand, some cities in the southwestern part of the YRD region are constrained by resource endowment. When accepting the transfer of industries, they often face the issue of losing local innovation resources such as local talents and capital. These cities are caught in the dual dilemma of insufficient endogenous motivation for sustainable innovation and the demand for sustainable innovation. On the other hand, cities in northern Jiangsu have made concerted efforts to build a national innovation demonstration zone for the sustainable development agenda by increasing investment in science and technology innovation, building major innovation platforms, strengthening ecological protection and environmental management, and fostering new industries, which has enhanced the local RSIE.
Analysis of Development Trends
The study of RSIE emphasizes the sustainability of innovation. Hence, conducting a prospective analysis of the direction of change and development of RSIE is crucial. Based on the RSIE in the YRD region from 2012 to 2021, we utilize the NICH index and the Hurst index to predict the future development trend of RSIE in the region. According to formula (6), the NICH index of RSIE in the YRD region is calculated for the period from 2012 to 2021, which serves as a basis for evaluation. Regions with a NICH index greater than 0 indicate that the growth rate is greater than the regional average and are considered a zone of improvement in RSIE. Meanwhile, regions with a NICH index less than or equal to 0 are considered zones of decline in RSIE. Furthermore, with -1, 0, and 1 as the boundaries, the 41 cities at the prefecture level and above in the YRD region are categorized into low decline, lower decline, higher increase, and high increase zones in sequence, as shown in Fig. 5a). Based on the calculation method of the Hurst index, we measured the Hurst index of cities at the prefecture level and above and the YRD region. In order to better reflect the persistence and intensity of changes in RSIE, the persistence of changes in RSIE within the research units is classified into three categories by taking the critical value of persistent change (0.5) and the Hurst index of RSIE in the YRD region (0.6018) as the boundaries, as shown in Fig. 5b). The spatial distribution map of the NICH index and the Hurst index are superimposed to derive the future trend of RSIE in the YRD region, as shown in Fig. 5c).
Fig. 4.
Standard deviation ellipse of regional sustainable innovation efficiency and its center of gravity trajectory in the Yangtze River Delta region.
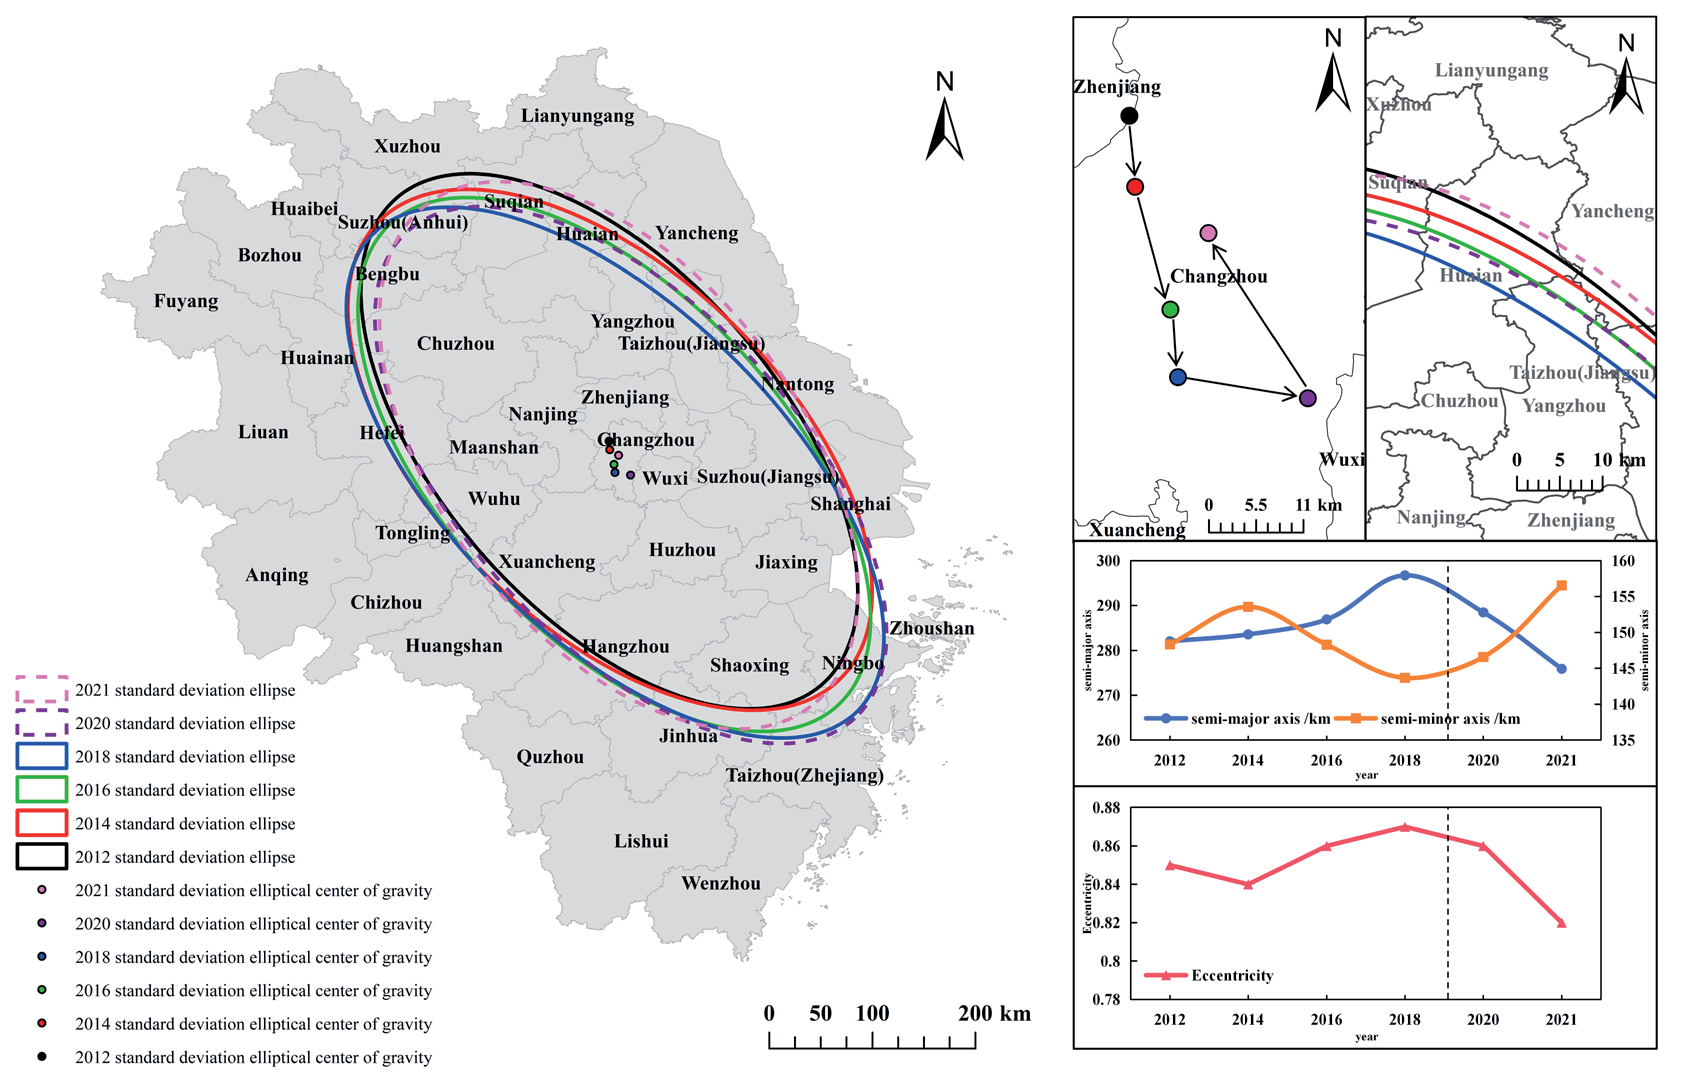
Fig. 5.
Spatial distribution of regional sustainable innovation efficiency trends a), Hurst index b), and future development trends c) in the Yangtze River Delta region.
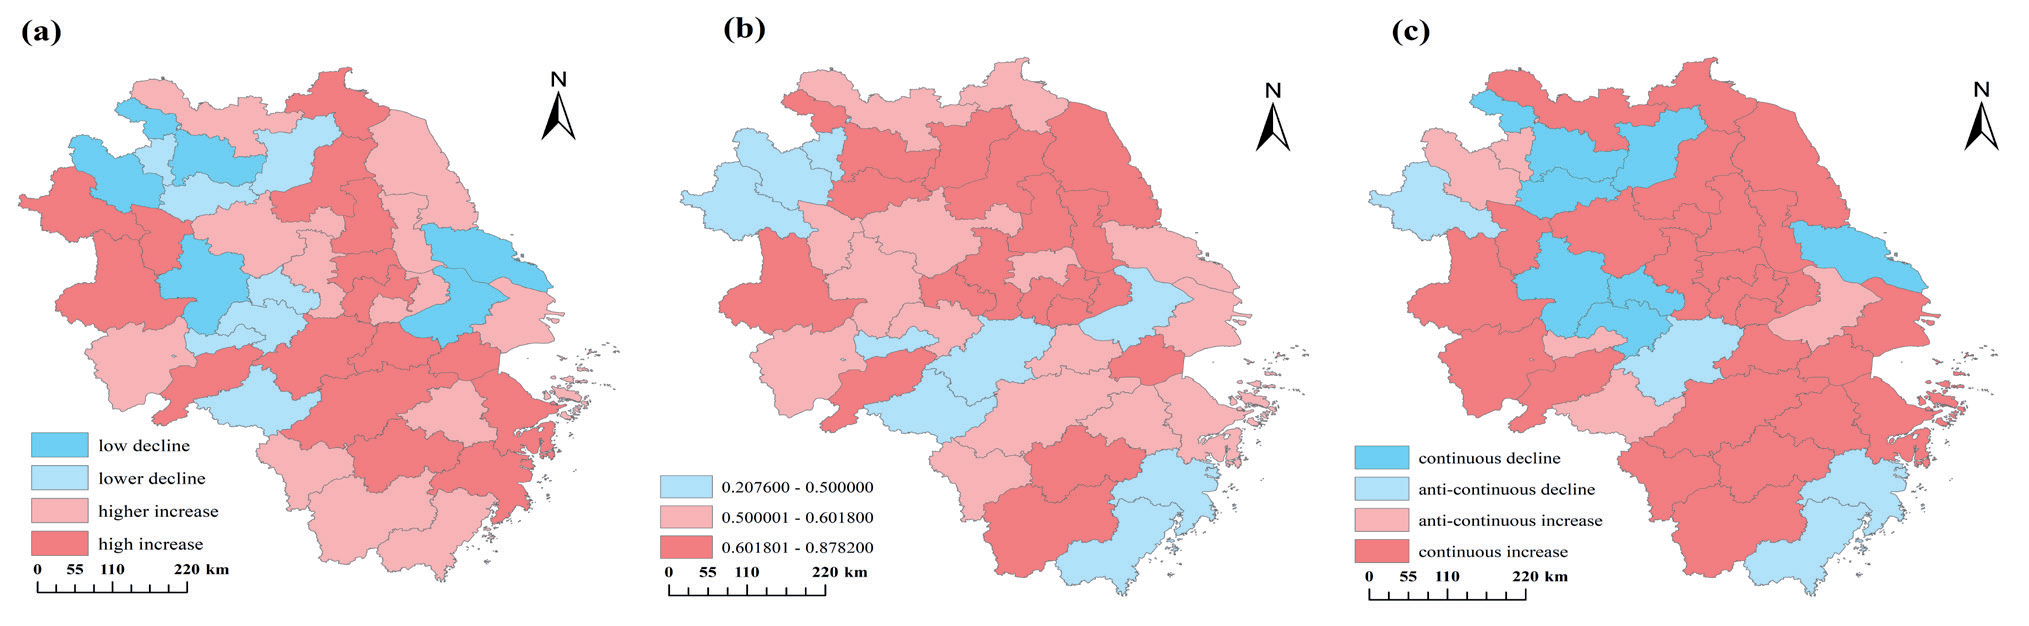
The NICH index reveals that the RSIE of these 4 provincial-level administrative regions has risen in recent years. Specifically, Zhejiang Province has the highest NICH index of 2.04, indicating the most rapid increase in RSIE. Anhui Province’s NICH index is close to 0, indicating the greatest growth potential. The average growth rate of RSIE in Anhui Province and Shanghai is lower than the regional average. Meanwhile, the Hurst index of 4 provincial-level administrative regions in the YRD region is all greater than 0.5, suggesting that the innovation efficiency demonstrates continuity and the development of RSIE maintains a continuous upward trend. At the level of prefecture-level cities and above, the high increase zone is mainly in the form of a belt (Lianyungang-Huainan-Yangzhou-Wuxi-Changzhou), a block (Lu’an-Fuyang-Huainan), and a ring (Jinhua) extending from north to south. The low and lower decline zones are mainly distributed in the middle-south and north of Anhui.
From the perspective of development trends, the future development trend of RSIE in the YRD region shows a continuous upward trend. Among the cities, those demonstrating an upward tendency are distributed in a clustered manner. This includes the northern and western parts of Zhejiang Province, the cities in Jiangsu Province except Nantong, and the eastern and western parts of Anhui Province. However, 7 cities, including Bengbu, Ma’anshan, Suzhou (Anhui), Suqian, etc., show a continuous downward trend. Most of them have high innovation inputs, low outputs, and low conversion of innovation results in the process of innovation development. It is urgent to improve the performance of utilizing innovation resources. By focusing on resolving issues such as industrial homogenization, optimizing the industrial structure, and fully leveraging resource endowment advantages, these cities can strive to reverse the continuous decline in RSIE. In the future, the south-central part of the YRD region, especially Nanjing-Hangzhou and their surrounding areas, will be poised to become a new round of growth poles for RSIE. Meanwhile, the inter-city differences of RSIE in the YRD region will be further narrowed, and the integration of the YRD region will be steadily pushed forward.
Analysis of Driving Forces of RSIE
The generation and expansion of innovation depend on the region’s economic, social, and institutional environment [4]. A sustainable innovation environment is the key to improving RSIE, and differences in innovation environments will bring differences in RSIE. Combined with the research results of current scholars [26-28], the regional innovation environment is a dynamic process involving both economic factors (capital, finance, economic development, etc.) and non-economic elements (education, policy, social culture, etc.). The regional innovation environment comprises a static environment and a dynamic innovation environment, including: (1) Infrastructure environment. Infrastructure includes hard environments (e.g., transport, energy, etc.) and soft environments (e.g., finance, enterprise aggregation, etc.). A good innovation infrastructure environment is conducive to enabling innovation subjects to maximize the effectiveness of using innovation factors. This paper selects the financial environment (fin) and transport infrastructure (tra) to represent the innovation infrastructure environment.
Table 2.
Driving forces of regional sustainable innovation efficiency.
(2) Socio-physical environment. Innovation is a human activity that needs a certain number of talents to support it. A good material living standard and social and cultural atmosphere are conducive to stimulating the spirit of innovation subjects and creating an open and inclusive innovation environment. This paper selects the material standard of living (wa) to represent the social and cultural environment. (3) Regional policy environment. Government policy can stimulate innovation vitality through financial stimulation on the one hand and correct problems in the innovation process through behavioral restrictions on the other. A forward-looking and strategic policy system will prevent and control potential risks, promote the construction of innovation networks, and guide the innovation process. This paper selects government funding (gov) and environmental regulation (re) to represent the regional policy environment. (4) Economic development environment. A good economic environment will attract the agglomeration of innovative industries and promote the flow of regional innovation factors. This paper selects the intensity of business agglomeration (mar) and industrial structure (ind) to represent the economic development environment. (5) Regional learning environment. Learning is an important guarantee for acquiring and amplifying knowledge resources and innovation factors. This paper chooses investment in education (edu) to represent the regional learning environment.
Table 3.
Spatial measurement regression results.
Spatial econometric regressions are conducted on panel data of 41 cities at the prefecture level and above in the YRD region from 2012 to 2021 with the help of Stata 17.0. Without considering the spatial correlation, the Hausman test results reject the original hypothesis at the 1% significant level, so the fixed effects model is chosen. Considering the heterogeneity characteristics of the cities in the YRD region, the great likelihood is applied to test the model separately, and the results show that the inclusion of the time-fixed effect has the best fitting results and the best regression results, so the time-fixed effect is selected for the test. The specific results are shown in Table 3. By comparing the adjusted-R2 and log-likelihood, this paper takes the spatial Durbin model that uses the inverse distance matrix (D) to perform the regression analysis (SDM) as the benchmark model to analyze the drivers. By comparing the spatial measure results of the economic distance matrix (G) used for the robustness test, it is found that the estimation results of the SDM and SEM models do not change significantly. Only the spatial lag term of some SDM models became non-significant. This indicates that the estimation results of the spatial measure model with the inverse distance matrix (D) as a benchmark possess a certain degree of robustness.
Regarding the infrastructure environment, the regression coefficients of the financial environment and transport infrastructure on RSIE did not pass the significance test. It indicates that the infrastructure environment has little influence on the local RSIE. There will be diminishing marginal effects after a certain level of investment in infrastructure construction. For example, in the case of transport facilities, when roads and railways in the YRD region reach a certain density and then continue to increase construction, the improvement in the efficiency of the movement of people and materials is no longer obvious. At this point, the pulling effect of the infrastructure construction on the RSIE becomes limited. It is of great significance to optimize the ratio of the 'Troika' by changing the concept of relying on infrastructure investment to drive regional innovation [29]. The coefficient of the spatial lag term of the infrastructure environment is negative and significant, at least at the 5% confidence level. This indicates that the infrastructure environment has a negative effect on the efficiency of regional sustainable innovation in adjacent areas. In terms of transport infrastructure, the construction of local infrastructure will cause imitation in the neighboring regions, resulting in a relative surplus of infrastructure in the neighboring regions. The large investment in the infrastructure industry leads to a relative lack of funds for the rest of the industry, which ultimately has a negative impact on the RSIE in the neighboring regions.
Regarding the social and cultural environment, the regression coefficient of the material living standard on RSIE is 0.836, which is significant at the 1% confidence level, while the spatial lag term is 0.046 and is not significant. It shows that material living standards contribute to local RSIE. Wage Growth Contributes to Regional Innovation [30]. Improvements in material living standards help to retain talent and stimulate their potential. Higher wages will create a more active talent market and social environment, which leads to more frequent knowledge sharing. In addition, the increased purchasing power of residents will expand the market demand for new products, motivating enterprises to carry out more innovative activities to meet the growing diversified needs of consumers.
Regarding the regional policy environment, the regression coefficients of government funding and environmental regulation on RSIE are both negative and significant at the 1% confidence level. In terms of government funding, existing studies [31] show an inverted U-shaped relationship between government subsidies and firm viability; thus, this relationship directly impacts RSIE. Moreover, with innovation being one of the key elements of firm viability, when government funding is at a medium level, this can provide sufficient funding for innovation to allow for extensive trial and error processes while balancing incentives and risks to avoid over-investment by firms in costly and risky projects, thus reducing the risk of reduced innovation efficiency [32]. The coefficient of the spatial lag term of government funding on RSIE is -0.888, which is significant at the 1% confidence level, indicating that government funding has a negative impact on RSIE in neighboring regions. This is mainly because the increase in local government funding attracts the entry of innovation factors from neighboring regions, which in turn reduces the RSIE in neighboring regions. In terms of environmental regulation, China’s current environmental regulation policy is rather stringent. Generally, environmental regulations can reduce ecological undesired outputs and force enterprises to complete green transformation. Nevertheless, while generating positive ecological effects, environmental regulations also pose certain challenges to enterprises. In order to comply with environmental regulations, enterprises need to invest in research and development, adopt more environmentally friendly production technology and equipment, and improve production processes, which undoubtedly increases the production costs of enterprises. At the same time, environmental regulations require enterprises to fulfill more information disclosure obligations during implementation and supervision. However, enterprises may not fully disclose relevant information due to reasons like considering costs or concealing negative information, which results in information asymmetry [33]. Information asymmetry makes it difficult for enterprises to accurately judge the market demand for green innovation and the direction of effective allocation of innovation resources [34]. It is difficult for enterprises to accurately predict the long-term impact and market response to environmental regulation policies [35]. Such circumstances will lead to an increase in the risks and uncertainties of innovation activities, which, to some extent, restrains the exertion of enterprises' innovation impetus.
Regarding the economic development environment, the regression coefficient of enterprise agglomeration intensity on RSIE is 0.244, which is significant at the 1% confidence level, and the spatial lag term is 0.639, which is significant at the 1% confidence level. This indicates that the intensity of enterprise agglomeration positively impacts RSIE in local and neighboring areas. On the one hand, the agglomeration of enterprises in the same industrial chain can promote cooperation and communication among enterprises, which can easily lead to scale effects, facilitate specialized division of labor and collaborative innovation, reduce the cost of innovation, and promote the formation of regional innovation networks. On the other hand, the agglomeration of enterprises in the same industry can form an enduring promotion mechanism, which will, in turn, improve the RSIE [36]. The regression coefficient of industrial structure on RSIE is -0.473, which is significant at the 1% confidence level. This indicates that a large proportion of secondary industry has a certain negative impact on the RSIE. In some cities of the YRD region, heavy industries such as petrochemicals, which are characterized by high pollution and high consumption, occupy the main development position. Although they have undergone some transformation, secondary industry upgrading requires large sunk costs, and the benefits of technological transformation of traditional secondary industries are not obvious in the short term. This has led to a cautious attitude of these enterprises towards technological innovation on the one hand and the phenomenon of crowding out the space for the development of high-tech industries and strategic emerging industries on the other, which is not conducive to improving the efficiency of local, sustainable innovation.
Regarding the innovative learning environment, the regression coefficient of education investment strength on sustainable learning efficiency is 0.0352, which is significant at the 10% confidence level. The coefficient of the spatial lag term is -0.062, but it is not significant. This indicates that educational investment intensity positively affects RSIE in the local region. Education will cultivate high-quality and professional talents, promote the accumulation of human capital, accelerate the formation of new-quality productivity, provide endogenous power for regional sustainable innovation, and thus improve RSIE.
Conclusions
This paper determines the RSIE of 41 cities at the prefecture level and above in the YRD region using the super-efficiency SBM-Undesirable model and analyzes the spatial evolution of the RSIE and its driving forces by combining the spatial Gini coefficient, the standard deviation ellipse, the NICH index, the Hurst index, and the spatial econometrics model to draw the following conclusions:
From 2012 to 2021, the RSIE in the YRD region shows a basic trend of fluctuation and increase, with a decreasing pattern of “Shanghai Municipality-Jiangsu Province-Zhejiang Province-Anhui Province”. The spatial distribution of RSIE in the YRD region is not balanced, but the regional differences are decreasing.
The standard deviation ellipse shows that the standard deviation ellipse is obviously directional, exhibiting a distribution pattern of “southeast-northwest”. The parameters of the standard deviation ellipse are basically stable, and the pulling effect on sustainable innovation in the direction of “southeast-northwest” increases first and then decreases. The center of gravity of the ellipse is located in Changzhou. The migration direction is characterized by moving first towards the south and then towards the north.
The future development trend of RSIE in the YRD region shows a continuous upward trend, and the central part of the YRD region, especially Nanjing, Hangzhou, and their surrounding areas, will become a new round of growth poles of RSIE.
The infrastructure environment has no significant effect on RSIE but an obvious negative spatial spillover effect. The social and cultural environment has a promoting effect on RSIE. An unreasonable regional policy environment is not conducive to improving RSIE, and government funding has a significant spatial spillover effect. In the economic development environment, enterprise agglomeration facilitates RSIE, and there is a positive spatial spillover effect; industrial structure restrains RSIE. The innovative learning environment promotes RSIE, and no spatial spillover effect exists.
These conclusions provide experience for us to enhance the RSIE in the YRD region:
1) Fully stimulate the vitality of innovative factors such as knowledge, technology, and data. Despite the sustained positive trend in the RSIE in the YRD region, the overall momentum remains relatively low. The YRD region should prioritize enhancing the RSIE as a long-term strategic task, reinforcing the central role of enterprises in technological innovation, fostering the integrated development of the digital economy and the real economy, and activating the potential of existing innovative factors. Additionally, it is crucial to elevate the level of regional coordination and integration, refine the cross-regional factor circulation mechanisms, mitigate industrial homogenization, and streamline cross-regional factor flows among enterprises, as well as achieve the efficient and inclusive allocation of innovative factors for the YRD region’s RSIE.
2) Expedite the establishment of a new production relationship adapted to developing new-type productivity. Enhancing total factor productivity (TFP) is at the heart of establishing a new type of production relationship, with improving labor productivity being a crucial link. It is paramount to increase investment in social governance and people’s livelihood security, strengthen the construction of socio-cultural environments, improve secondary distribution mechanisms, perfect the social security system, strengthen labor law enforcement, and foster new, harmonious labor relations. These efforts aim to better harness the enthusiasm and creativity of laborers, stimulate local consumption, invigorate the organizational elements of interactive relationships among innovation entities such as markets, improve the innovation ecosystem, reduce risks in the innovation process, and provide sustainability guarantees for the innovation process.
3) Continuously deepen the reform of the financial system and environmental law enforcement system. Relying on comprehensive deepening reforms is necessary to lower the market access thresholds for “three new enterprises” (i.e., new technologies, new industries, and new business models), boost private capital confidence, and stimulate corporate innovation vitality. Enterprises are the mainstay of regional sustainable innovation, and government subsidies to enterprises for research and development need to be kept at a medium level, avoiding ‘flooding’ financial support. In addition, the government needs to strengthen its support for the digital economy and promote its integrated development and technological convergence with the real economy. It is crucial to refine the regional ecological compensation and collaborative governance mechanisms, leverage the market functions within the framework of environmental regulations, and promote the transformation of environmental regulations from a focus on simple governance to a comprehensive, service-oriented, and anticipatory approach. Improving market-based environmental regulatory measures, adopting market-oriented incentives, strengthening the policy interpretation of environmental regulations, and enhancing environmental information disclosure mechanisms are essential. These efforts can help establish a fair, just, and transparent system of environmental regulatory measures. Precise assessment and appropriate regulation should ensure that environmental regulatory policies better guide and support the development of RSIE.

