

Introduction
Ecosystem service assessment has recently attracted the attention of scholars from all over the world [1-3]. The ecosystem directly or indirectly meets the demands of human productive life by providing ecosystem services [4, 5]. The ecosystem significantly contributes to sustainable human well-being by regulating climate and hydrology, providing raw materials and food, etc. The integration and coordination of ecosystem services is the basis for policymakers to make scientific decisions on the management of ecosystem services Ecosystem service valuation is a process of quantifying ecosystem services [6]. This entails estimating the value of ecosystem services while comparing and accounting for their own cost, as well as employing economic mechanisms to prevent the destruction of ecological badlands, thus reconciling economic development with ecological conservation [7, 8].
Land is an essential resource for a productive human life and social development. Land use change is the most fundamental manifestation of the coupling relationship between human activities and terrestrial ecosystems, and is also an important driver of the transformation of ecosystem services [9]. The process of land use change directly leads to changes in the functions and structures of ecosystem services, which changes ESV as well [10]. Research on ecosystem service value based on land use change has been widely used in China and abroad [11- 13]. The interconversion of different land use types as a result of the ongoing expansion of social economy and urbanization has had a negative influence on the ecosystem. The overexploitation of land resources even exceeds the carrying capacity of the ecosystem itself, causing considerable amounts of environmental and sustainability issues [14]. By studying the evaluation of ecosystem service value, people can more fully comprehend the characteristics of the ecological environment and formulate scientific ecological protection policies and sustainable regional development strategies [15].
To more accurately and intuitively measure ecosystem service functions, in 1997, Costanza et al. [16] established a taxonomy of ecosystem services and effectively calculated the value of ecosystem services in the global biosphere. In light of this momentous research finding, many domestic and foreign academics have studied topics relating to the value of ecosystem services. Aman et al. [17] quantified the ESVs of Rupandehi District of Nepal from 2005 to 2020 and conducted the spatiotemporal analysis of the region. Najmuddin et al. [18] assessed the ecosystem service value changes in response to the changes of LULC in Afghanistan from 2000 to 2020 by adopting the value transfer method. Related research in China started late, Ye et al. [12] calculated ESV in Guangdong province from 1990 to 2018, studied trade-offs and synergies among ecosystem services using the ecosystem service trade-off degree, and compared the link between ecosystem service value, economic development, and population. Up to now, the majority of the research findings have been on the national [6, 19], city [20, 21], and basin [22, 23] scales. An increasing number of studies have been conducted on the service values surrounding wetland [24, 25], forest [26-28], and plain ecosystems [29-31]. The equivalent factor technique based on unit area [32, 33] and the functional value method based on unit service function [34] are now the two major approaches to calculating the value of ecosystem services. The functional value method involves more parameters, different standards, and a complicated calculation process, while scholars favor the equivalent factor method because it involves fewer parameters, uniform standards, and a simple calculation process. Through a questionnaire-based survey of 700 ecologists in China, Xie et al. [35] developed a table of ecological service value equivalents per unit area of ecosystems in China. However, ecosystem service value is distinctly spatially heterogeneous, with different natural resources, economic development, and policy requirements in different study regions. Therefore, the predominant technique Chinese academics employ to determine the value of ecosystem services is the re-correction of the equivalency factor table, taking into consideration the natural and economic characteristics of the research region.
Since the reform and opening up, Jiangsu Province in China has seen fast urbanization, a large rise in the urbanization rate, and a quick increase in the built-up area [36]. The land use pattern in Jiangsu Province has resulted in significant changes, seriously threatening the ecological environment [37]. At present, the Ministry of Ecology and Environment of the People’s Republic of China places a high priority on the ecological and environmental issues in the Yangtze River Delta area. Jiangsu Province is crucial to the preservation of the natural environment and the sustainable growth of the entire Yangtze River Delta area since this area is a significant component of Jiangsu Province. The measurement of ecosystem service value in Jiangsu Province is an important data support for the optimization of land use structure and ecological quality evaluation in Jiangsu Province. This study modified the ecosystem service value equivalent factor in Jiangsu Province predicated upon the major food crops in the region, dividing the study area into 1163 grid units based on six periods of land use data, that is, from 1995, 2000, 2005, 2010, 2015, and 2020 in Jiangsu Province using Arcgis and Geoda (spatial analysis tools) to measure and analyze the spatial and temporal changes in the ecosystem service value in Jiangsu Province. We combined the actual situation of Jiangsu Province and selected the ecosystem service function, and optimized the ecosystem service value assessment model in terms of equivalent factors and service value coefficients. The objectives of this study are as follows: (1) to quantify the value of ecosystem services in Jiangsu Province and its prefecture-level cities in 1995, 2000, 2005, 2010, 2015 and 2020; (2) to investigate the patterns of spatial and temporal development of ESV in Jiangsu province on the grid scale by utilizing spatial autocorrelation model;
(3) to demonstrate the impact of LULC alterations on ESV in Jiangsu province and offer a theoretical foundation and point of reference to formulate policies for land use and environmental protection.
Materials and Methods
Study Area
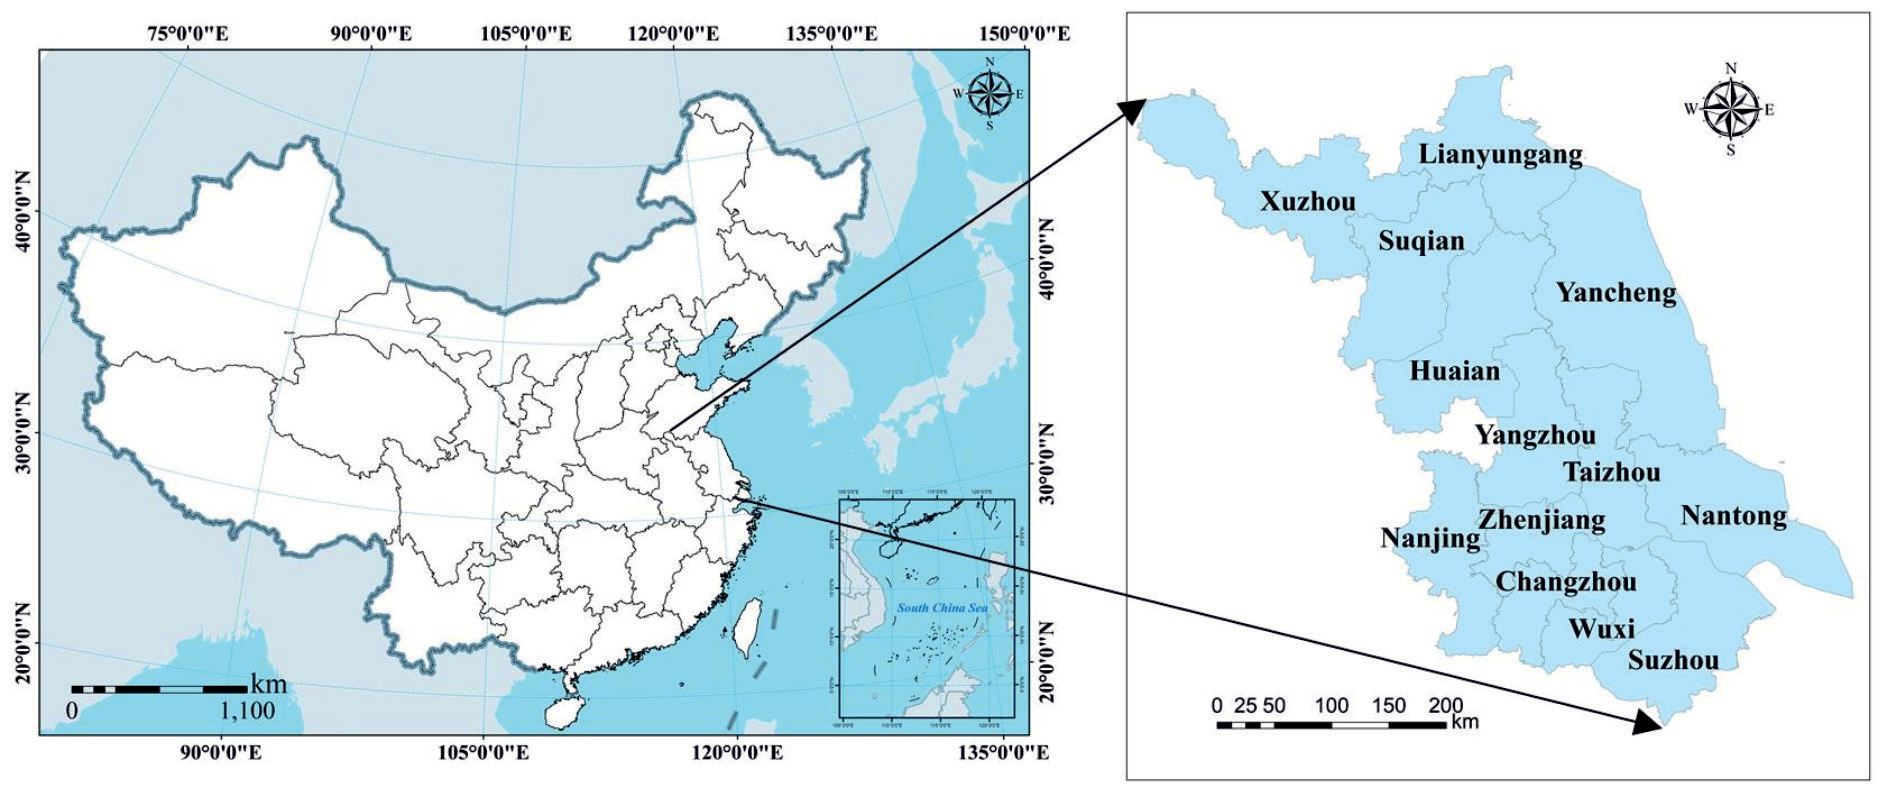
Jiangsu Province is situated at 30°45’~35°08’N, 116°21’~121°56’E on the eastern coast of the Chinese mainland (Fig. 1). With a total size of 107,200 square kilometers, Jiangsu Province makes up 1.12% of China's land area. It is part of the East Asian monsoon climatic zone, which has four distinct seasons, copious rainfall, moderate temperatures, and flat topography. In 2021, the province's resident population was 85,054,000, with an urbanization rate of 73.93%. With the rapid economic development, the GDP of Jiangsu Province in 2021 was 1684.826 billion USD, an increase of 13.18% from 2020, making it one of the provinces with the highest comprehensive development levels in China.
Data Sources
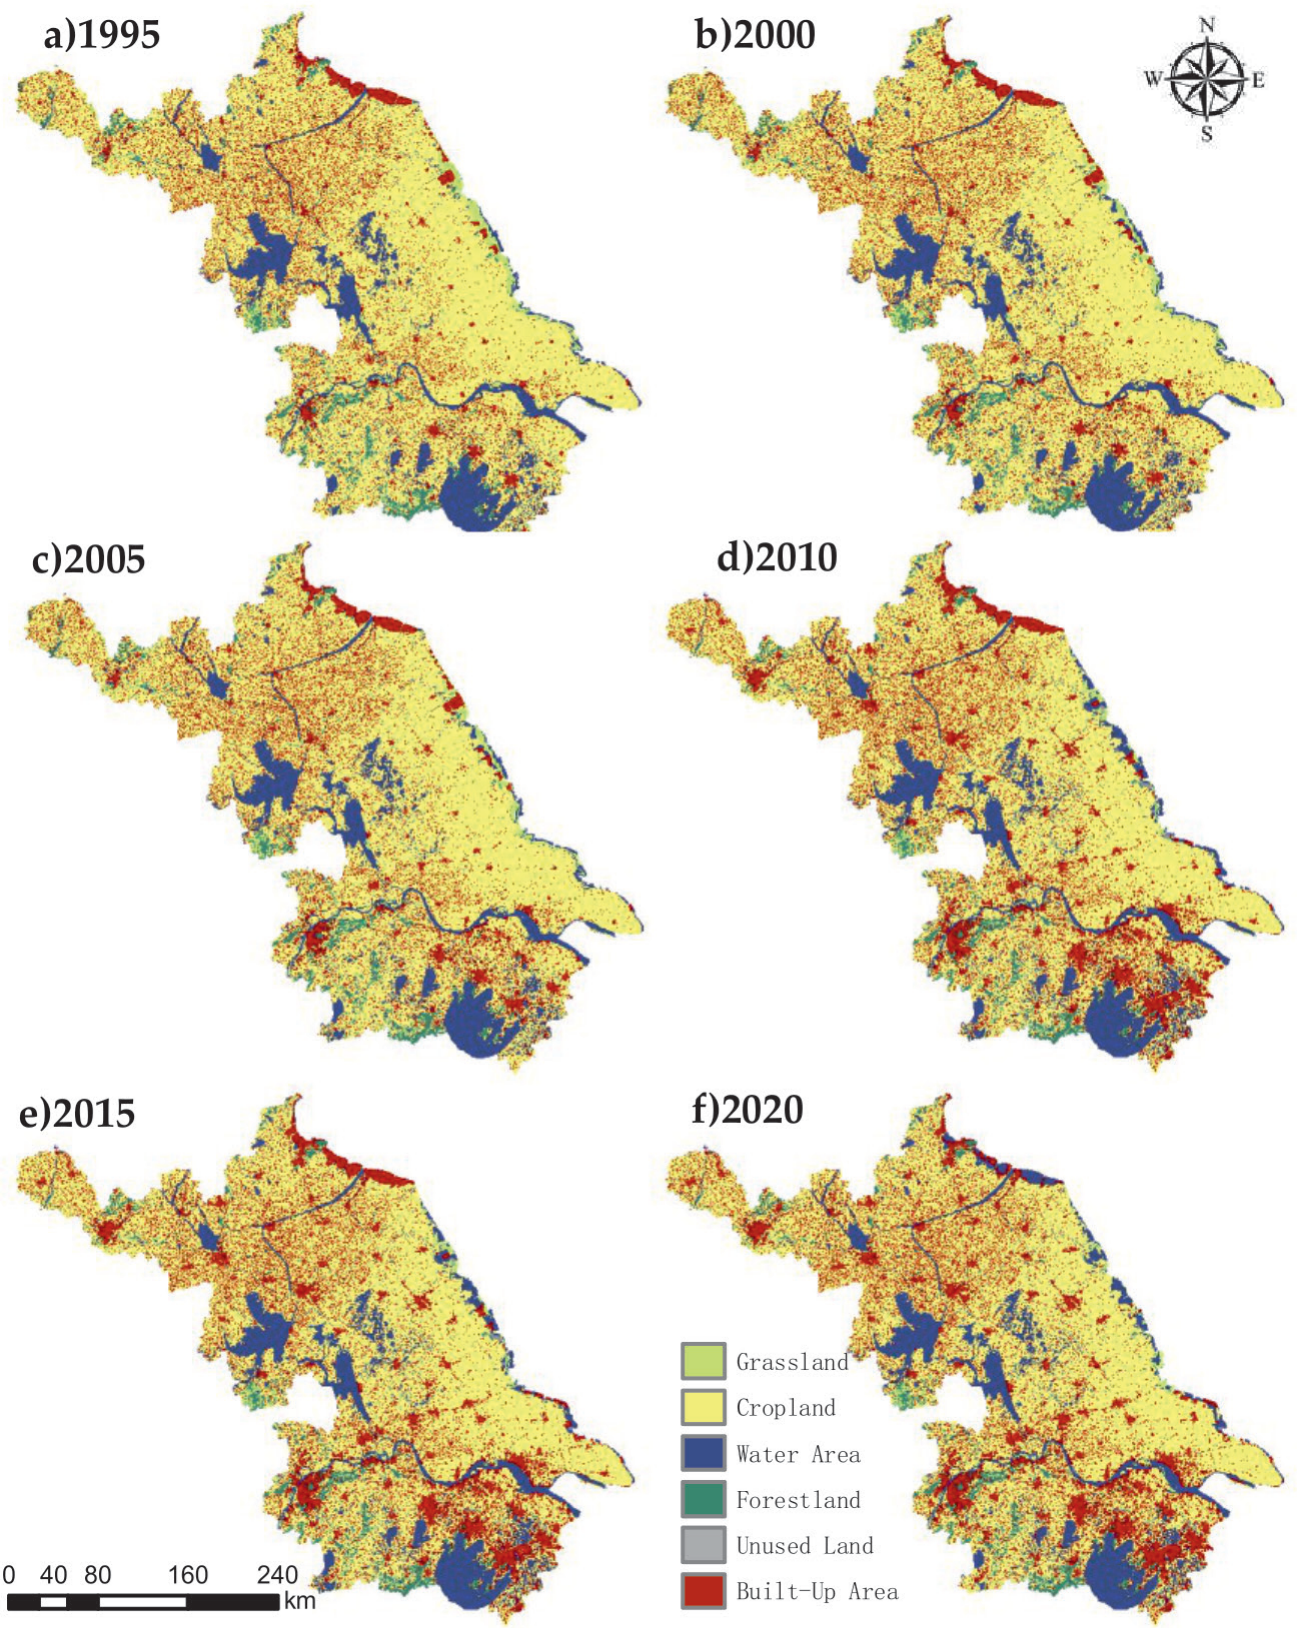
In this study, we used the land use data with a spatial resolution of 30 m from the Data Center for Resources and Environmental Sciences, Chinese Academy of Sciences (RESDC) (http://www.resdc.cn) (Fig. 2). Land use in Jiangsu Province is divided into six types based on its land resources and use attributes: cropland, forestland, grassland, water area, built-up area, and unused land. The National Compilation of Cost and Benefit Information of Agricultural Products (1995, 2000, 2005, 2010, 2015, 2020) and the Statistical Yearbook of Jiangsu Province (2021, 2022) were used to compile the socioeconomic, demographic, and main food statistics.
Methods
Ecosystem Services Value Assessment
In this study, the equivalent factor method based on unit area value constructed by Xie et al. [38] was used. The table of the ESV equivalent factors proposed by Xie et al. is applicable at the national scale. Erros may be raised when it was directly applied to Jiangsu Province. Therefore, we adjusted the ecosystem service value equivalent factor by combining it with the actual situation in Jiangsu Province. From previously published studies, the economic value amount of one standard equivalent factor is equal to 1/7 of the national average grain yield market value in that year [39]. For this study, we chose three major grain crops in Jiangsu Province – rice, wheat, and corn. The economic value of one standard equivalent factor in Jiangsu Province was determined to be 324.27 USD/hm2 on the basis of data on the production, sown area, and grain prices of the three grain crops in Jiangsu Province (to eliminate price fluctuations between years, the grain price in Jiangsu Province in 2015 was used as the benchmark).
Where Ea is the economic value of one ecosystem service equivalent factor (USD/hm²), i is the type of food crop in the study area, n is the number of major food crop categories in the study area, m is the total area of the ith food crop in the study area (hm²), pi is the average price of the ith food crop in the study area (USD/t), qi is the average yield per unit area of the ith food crop in the study area (t/hm²), and M is the total area of the food crop in the study area (hm²).
The table of the ESV equivalent factors proposed by Xie et al. is applicable at the national scale. Erros may be raised when it was directly applied to Jiangsu Province. Therefore, We modified the ecosystem service value coefficient by combining it with the actual situation in Jiangsu Province, obtaining the unit price and the total value of ecosystem services for each land use type in Jiangsu Province. Given that the built-up area is a complex ecosystem with a negligible influence on the value of ecosystem services, it is challenging to gather assessment data and currently impossible to completely quantify the ecosystem service value of the built-up area, whose coefficient is set to 0 in this paper [39, 40]. Finally, combined with the ecological service value per unit area equivalence table of Chinese ecosystems proposed by Xie et al. [38], we assigned Ea to each factor to obtain Table 1.
In this study, we calculated the value of each ecosystem service and the total value of ecosystem services as follows [39]:
Where ESV represents the total value of ecosystem services in the study area, Ai denotes the area (hm²) of the ith land use type, VCi denotes the ecosystem service value coefficient per unit area of the ith land use type, ESVf is the fth ecosystem service value, and VCfi is the fth ecosystem service value coefficient for the ith land use type.
Using grid cells as the basic analysis unit can greatly improve the accuracy of the analysis of the value of ecosystem services in the study area [41]. In this study, the commonly used grid units 1 km × 1 km, 3 km × 3 km, 5 km × 5 km, and 10 km × 10 km were constructed as pre-selection evaluation units based on the literature on grid construction. First we compared the distribution characteristics and differences of ecosystem service value at different grid scales. We found that all of the pre-selected evaluation units of different sizes could reflect the spatio-temporal distribution characteristics of ESV in Jiangsu Province, but 5 km × 5 km and 10 km × 10 km grids could more clearly show the spatial distribution characteristics of ESV in Jiangsu Province. Second, we considered the size of the study area and the difference in the number of grids at different scales, the quantity of 10 km × 10 km grid was moderate, which was convenient for the subsequent zoning management of ecosystem services in Jiangsu Province. Finally, in order to highlight the spatial variability of ESV in Jiangsu Province, a 10 km × 10 km grid was proposed as the evaluation unit. A total of 1163 grids of 10 km × 10 km in the study area were created with ArcGIS software Greate Fishnet, Dissolve, and Clip, and the value of ecosystem services in each grid was calculated to achieve a microscopic reconstruction of ESV at the grid scale. Based on the land use type data in each grid, the ecosystem service value of each land use type in the small grid is calculated separately and finally summed to get the ecosystem service value of the grid.
Table 1.
ESV coefficient of individual services in Jiangsu Province (USD/hm²).
Coefficient of Sensitivity
Ecosystem sensitivity indices can properly reflect the degree of association between ecosystem service value coefficients and changes in land use and ecosystem type [42]. The bigger the CS value, the stronger the impact of the ecological service function value coefficient (VC) on the ESV, and the ESV is more likely to produce large fluctuations. In this study, the sensitivity index of the ESV of each land use type in Jiangsu Province was calculated using the ecosystem sensitivity index model by taking the value coefficients of ecological service functions of cropland, forestland, grassland, water area, and unused land ±50%. The calculation formula is as follows:
Where CS represents the coefficient of sensitivity, ESVj is the adjusted ecosystem service value, ESVi represents the pre-adjusted ecosystem service value, VCjk is the adjusted ecosystem service value coefficient of the kth land use type, and VCik is the pre-adjusted ecosystem service value coefficient of the kth land use type.
Spatial Autocorrelation Analysis
Spatial autocorrelation analysis involves exploring the existence of features such as spatial agglomeration or outliers of a spatial element, which is usually measured and tested using Global Moran’s I and Local Moran’s I [43]. In this study, we used Global Moran’s I to investigate the spatial aggregation characteristics of the ESV of Jiangsu Province. The range of Moran’s I was -1 to 1, and the spatial elements were positively correlated if I>0, negatively correlated if I<0, and randomly distributed if I = 0. Local spatial autocorrelation can measure the local spatial correlation and spatial dissimilarity between each grid and the surrounding grid. Common methods include Moran scatter plot and Local Indicator of Spatial Association (LISA), which are used to portray the spatial aggregation or variance of the measured independent variables. Moran scatter plot can be used to visualize global spatial autocorrelation as well as to study local spatial instability. The 4 quadrants of the Moran scatter plot correspond to the 4 types of local spatial connection forms between a regional unit and its neighbors. LISA [44] can reflect the local spatial relationship between events and surrounding events, and is mainly divided into 4 types, i.e. high–high value aggregation, high–low value aggregation, low–high value aggregation, and low–low value aggregation areas. In this study, Spatial autocorrelation analysis was implemented under ArcGIS and GeoDa software platforms. We calculated it using the following expression:
Where xi and xj represent the spatial unit attribute values, x̅ is the mean spatial unit attribute value, n is the number of spatial units, and Wij represents the spatial weight matrix between factors i and j.
Results
Changes in the Ecosystem Service Value in Jiangsu
Ecosystem Service Value of Various Land Use Types
Based on the land use data, we caculated the value of ecosystem services in Jiangsu Province. From 1995 to 2020, the ESV in Jiangsu increased by 3.15 billion USD, with a growth ratio of 6.47%. As demonstrated in Table 2, the water area and the cropland were the main components of ecosystem service values in Jiangsu Province. The contribution of the water area exceeded 75% and the contribution of cropland exceeded 15% of the total ESVs in Jiangsu Province. Overall, the increase in the ESV of Jiangsu Province mainly profited from the increase in the water area ecosystem service value, caused by the increase in the water area, and the decrease in the ESV of Jiangsu Province was mostly a result of the decrease in the cropland ecosystem service value, caused by the decrease in the cropland area.
Composition of the Ecosystem Service Value
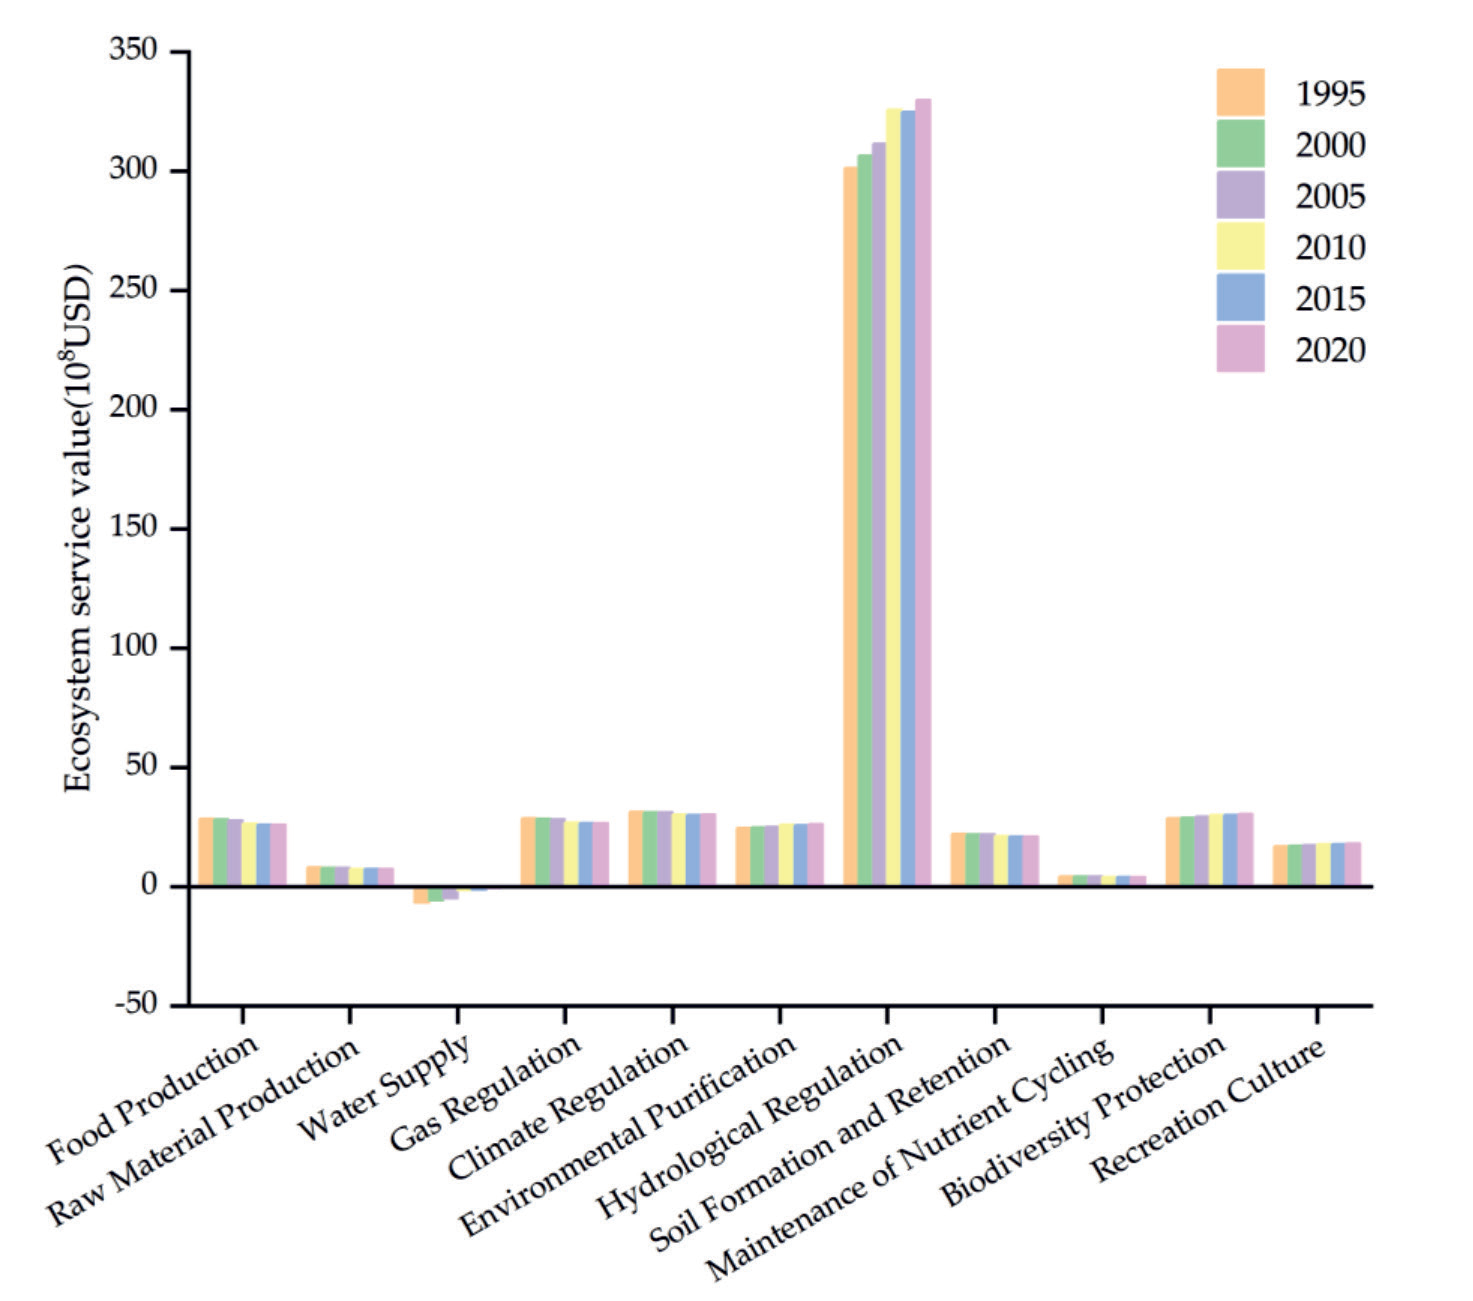
Fig. 3 presents the values of individual ecosystem services in Jiangsu Province. The primary ESV services in Jiangsu Province are ranked in order of magnitude as follows: regulation services>support services> provisioning services>cultural services. From Fig. 3, it can be seen that food production, raw material production, gas regulation, climate regulation, soil formation and retention, and maintenance of nutrient cycling decreased, while the others increased among the secondary services. Among them, the value of individual ecosystem services provided by hydrological regulation was much higher than the values of other services, providing ecosystem services worth 30.20 billion USD in 1995, which increased to 32.99 billion USD in 2020, accounting for 63.56% of the total ESV.
Spatio-Temporal Distribution Characteristics of Ecosystem Service Values
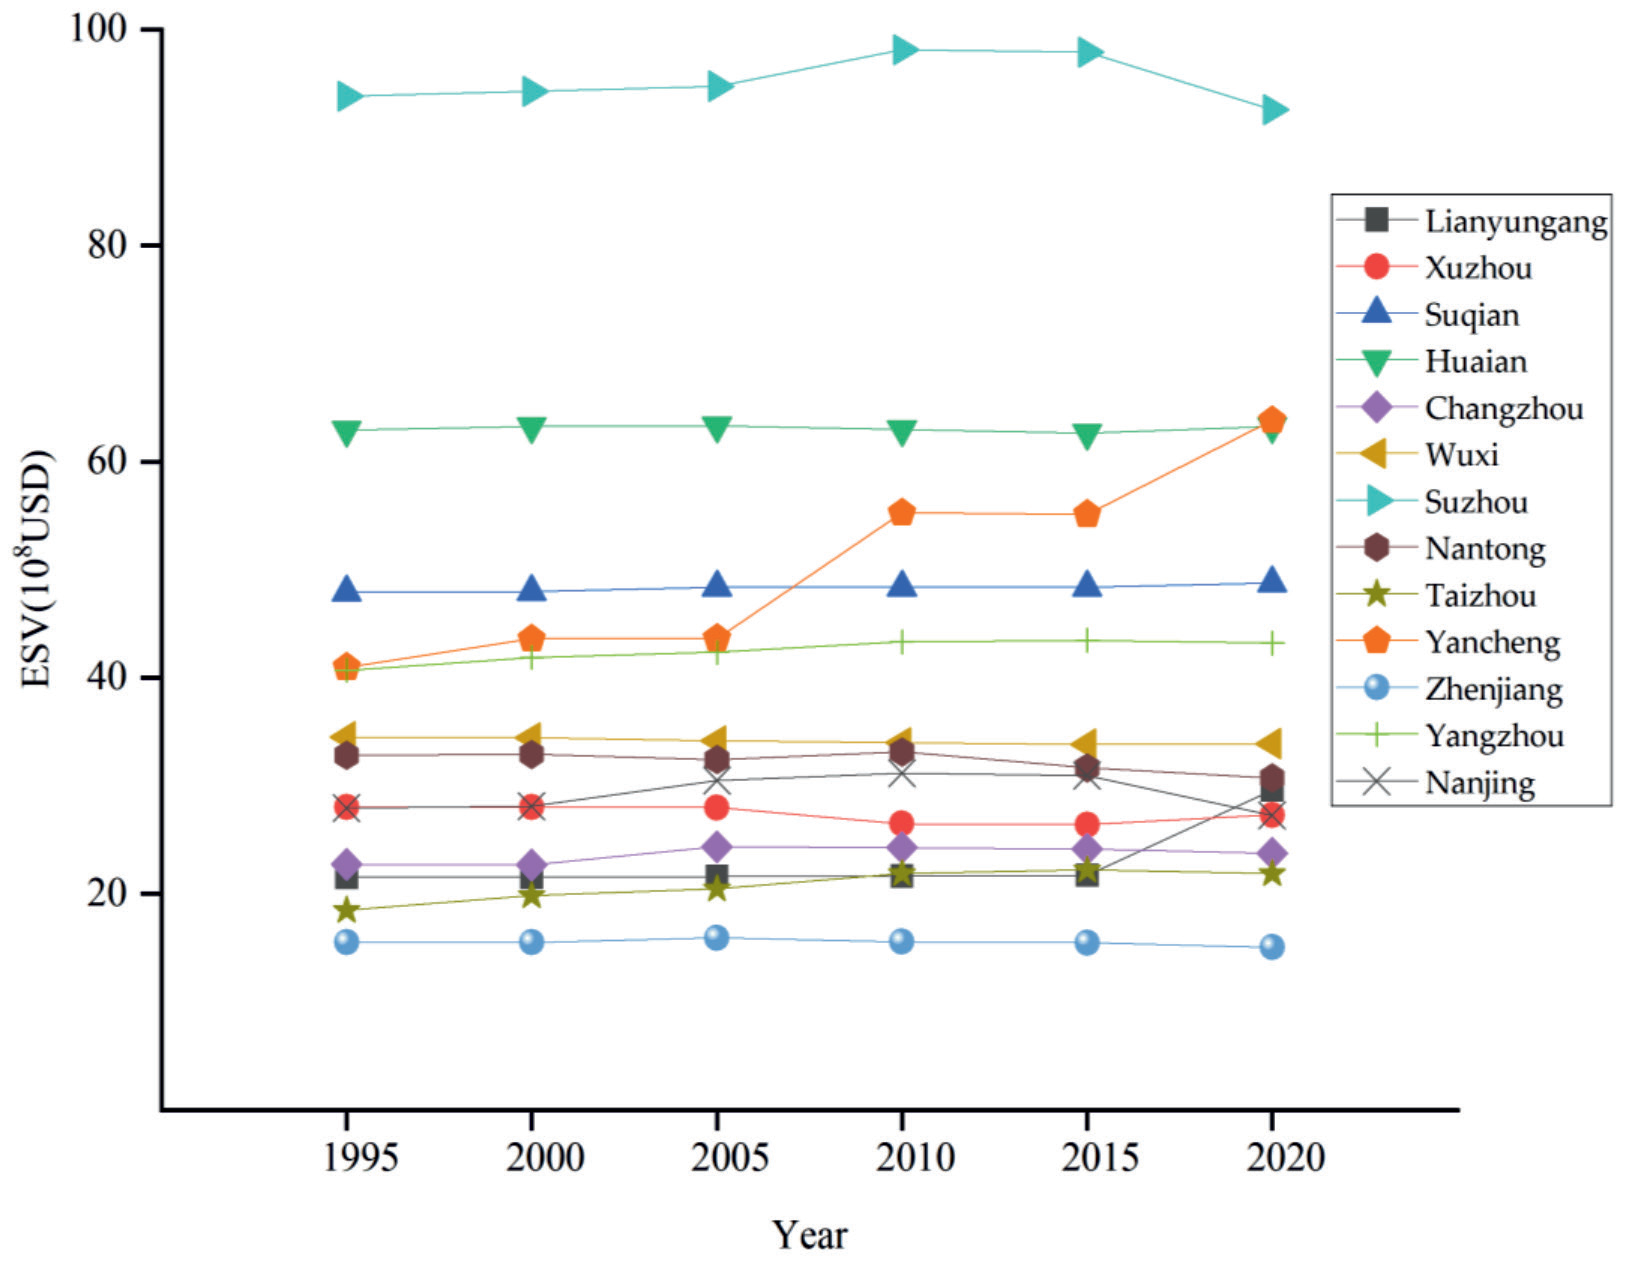
We estimated the ESVs of 13 cities in Jiangsu Province to identify the spatial distribution characteristics of the ESV. Fig. 4 shows that of the 13 cities, the ESV contribution of Suzhou was the highest, reaching 9.26 billion USD in 2020, accounting for 17.76% of the entire ESV of Jiangsu Province. The ESV of Huai’an City changed steadily during the study period, accounting for more than 12% in all six periods, and its contribution was second only to that of Suzhou City. The proportion of the ESV was above 5% in each of the following cities: Suqian, Yangzhou, Wuxi, Nantong, Lianyungang, Xuzhou, and Nanjing. Changzhou, Taizhou, Zhenjiang, and other cities had a lower proportion of ESV, accounting for less than 5% in all six periods.
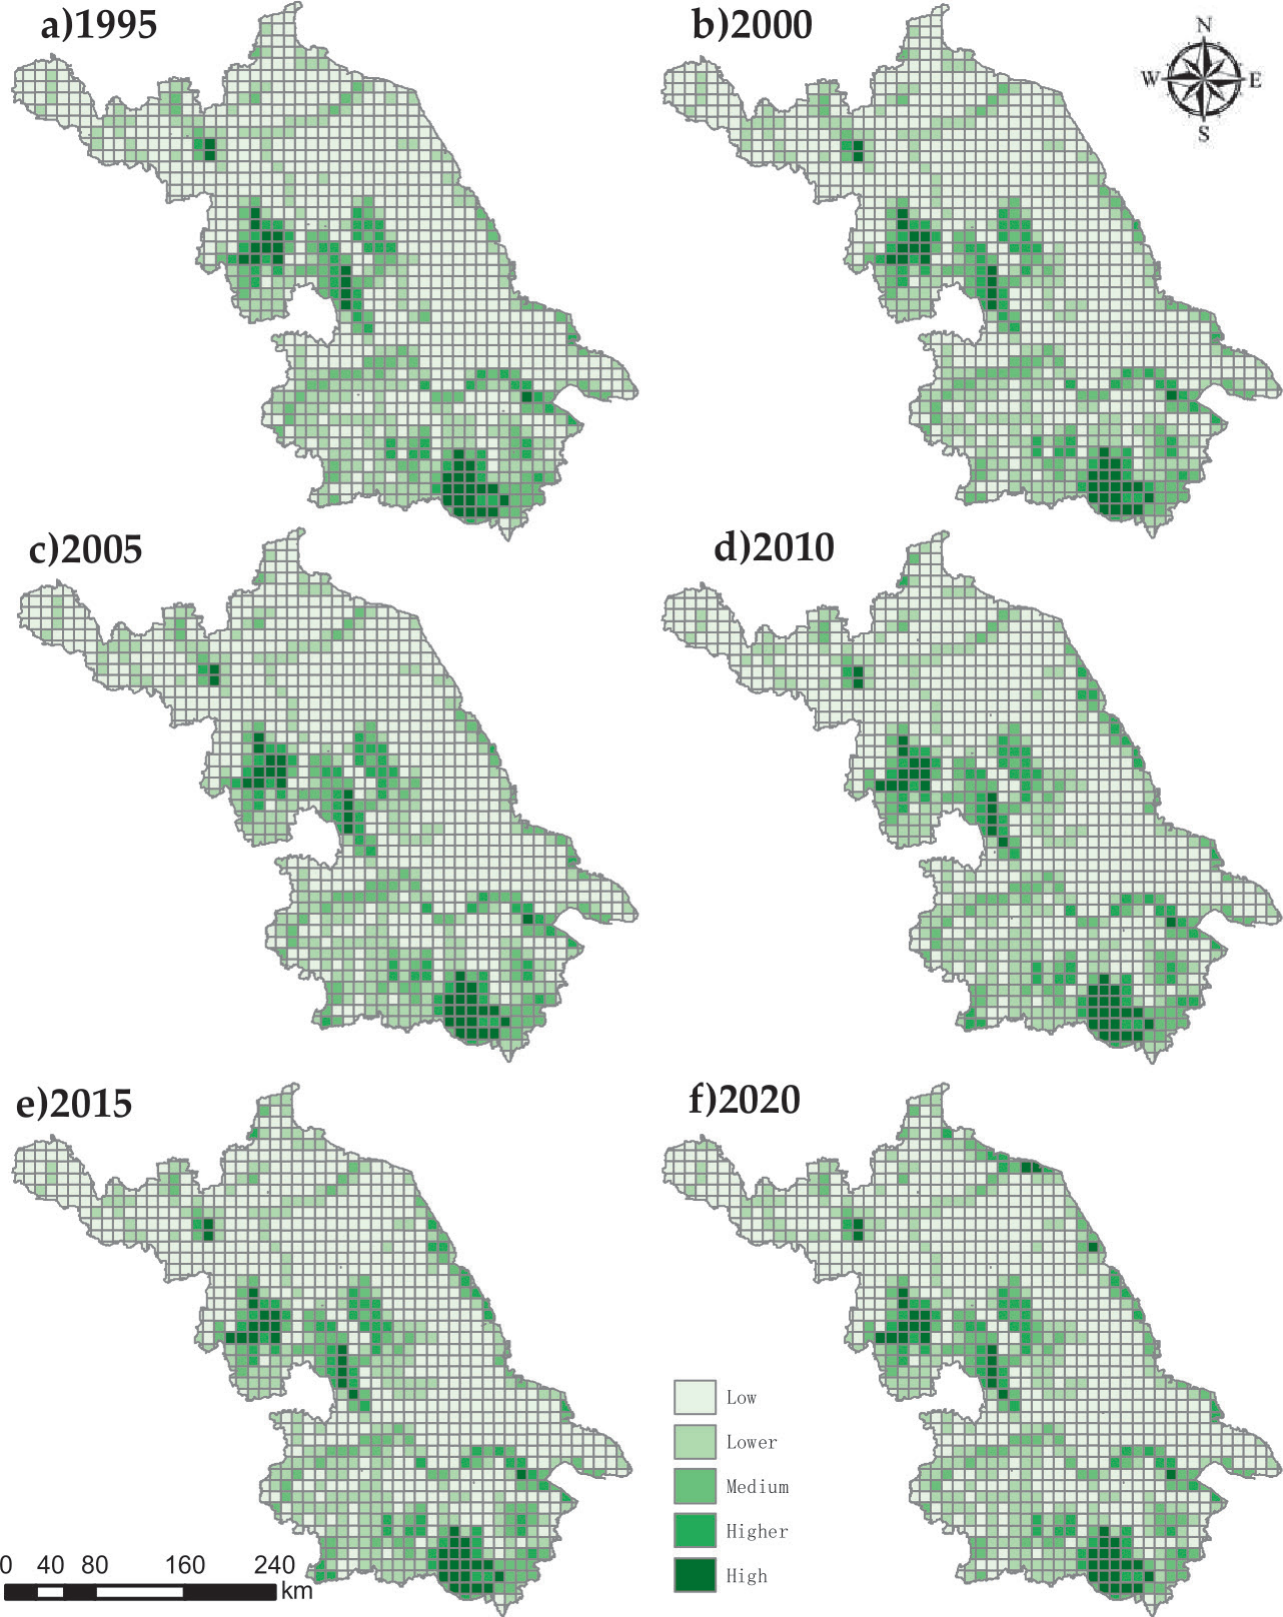
Fig. 5 shows that the high-value and higher-value zones in Jiangsu Province are distributed in a linear pattern. Specifically, the high-value zones in the western and southern regions are distributed in a planar pattern, with the high ESVs in the western region benefiting from Gaoyou Lake and Hongze Lake, while the high ESVs in the southern region benefiting from Taihu Lake. The “M” line high-value zone between the two high-value zones is along the Yangtze River, while Yancheng’s coastal mudflat wetland, which is the largest mudflat wetland in China, is home to the eastern line high-value zone. The lower-value zone is widely dispersed throughout the province, mostly in the core metropolitan districts, and the land use type is primarily built-up area. The middle-value zone and the lower-value zone are spread along the river. As can be observed, in Jiangsu Province, high and low ESVs are mostly determined by the water area in the region.
Table 2.
ESV (USD million) and contribution rates of different land use types in Jiangsu Province.
Sensitivity Analysis of ESV
The sensitivity indices of all land use categories in Jiangsu Province were below 1 (Table 3). The cropland sensitivity index fell steadily between 1995 and 2020, from 0.1852 to 0.1540, showing that the value of ecosystem services in Jiangsu Province was increasingly influenced by changes in the cropland ecosystem service coefficient. The sensitivity index of the ESV of each land use type in Jiangsu Province was in the following order: water area>cropland>forestland>grassland>unu sed land. The highest sensitivity index, which climbed from 0.7538 to 0.7991 between 1995 and 2020, shows that the ESV of Jiangsu Province resulting from water area was the largest and the fastest growing.
Spatial Autocorrelation Analysis
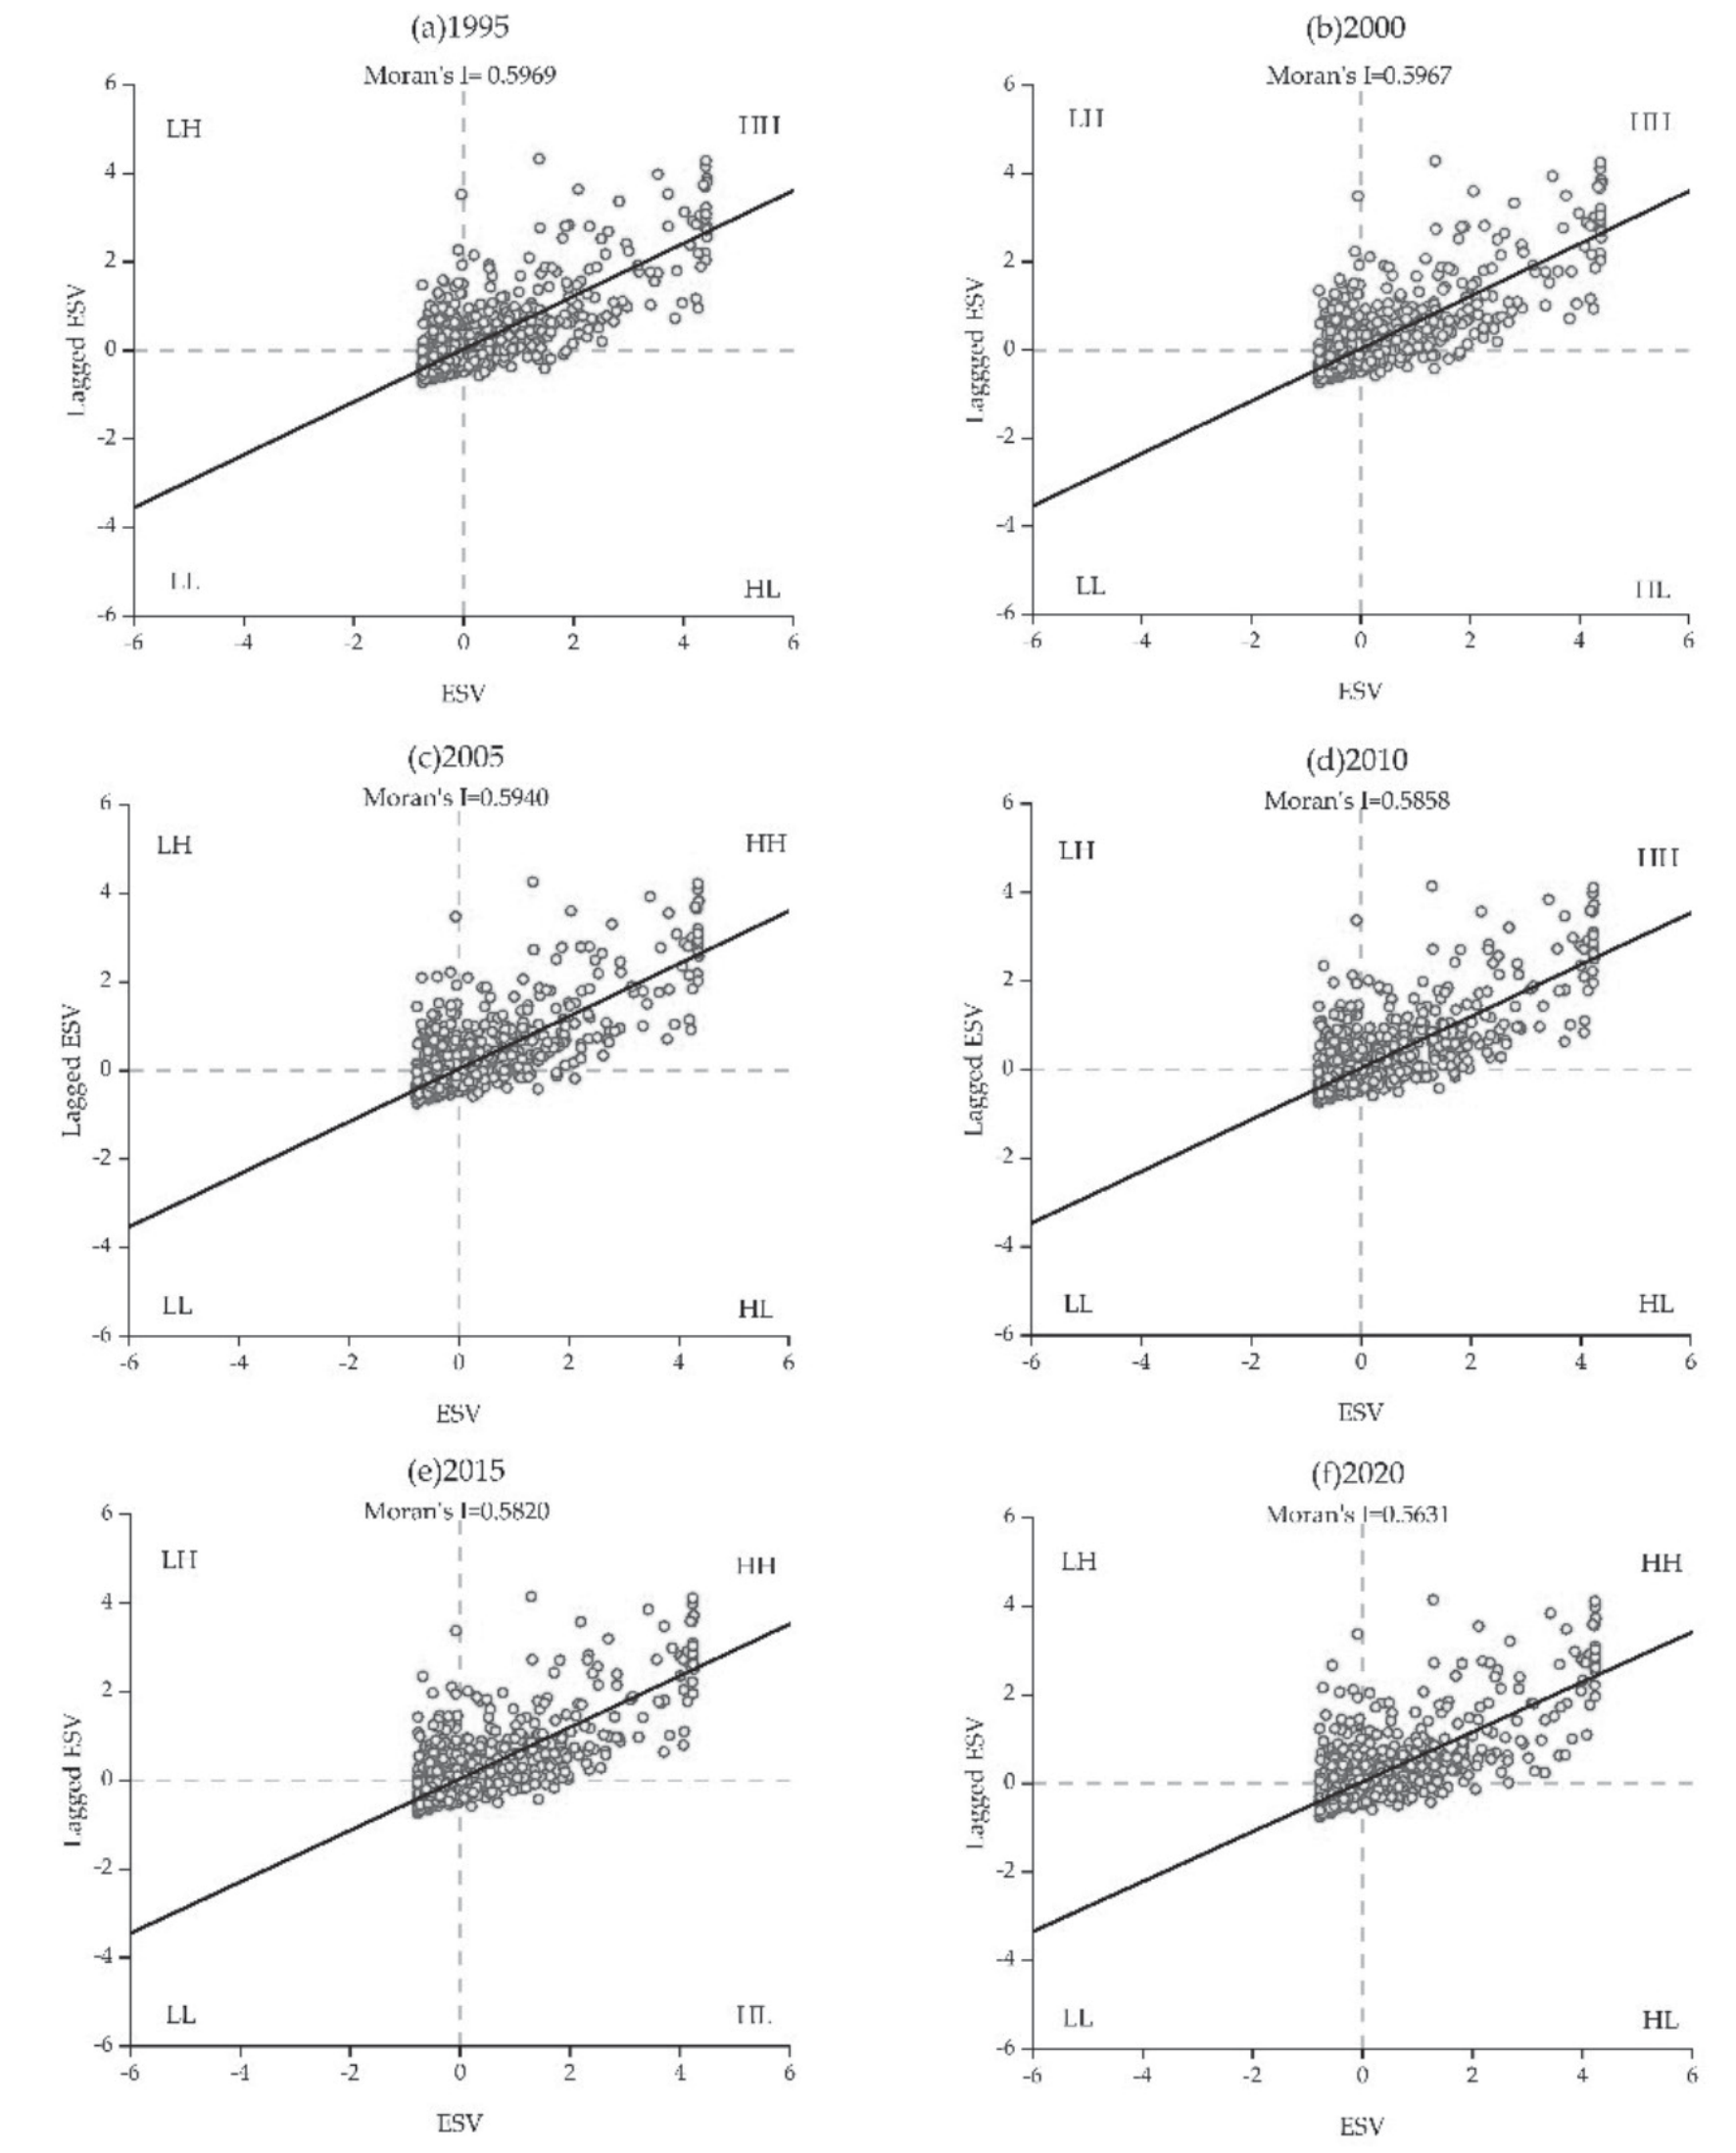
Global Moran’s I values for Jiangsu Province in 1995, 2000, 2005, 2010, 2015, and 2020 were computed as 0.5969, 0.5957, 0.5940, 0.5858, 0.5820, and 0.5631, respectively (Fig. 6). All six periods had a p-value of 0.001, and all passed the significance test. The spatial distribution of the ESV of Jiangsu Province exhibited a positive spatial autocorrelation as opposed to a random distribution. Most of the scattered points fall in the first and third quadrants, which indicates a more significant trend of high-high or low-low aggregation of ecosystem service value in Jiangsu Province. The spatial autocorrelation of the ESV of Jiangsu Province was progressively declining, as seen by the downward trend in Moran’s I for the years 1995 to 2020.
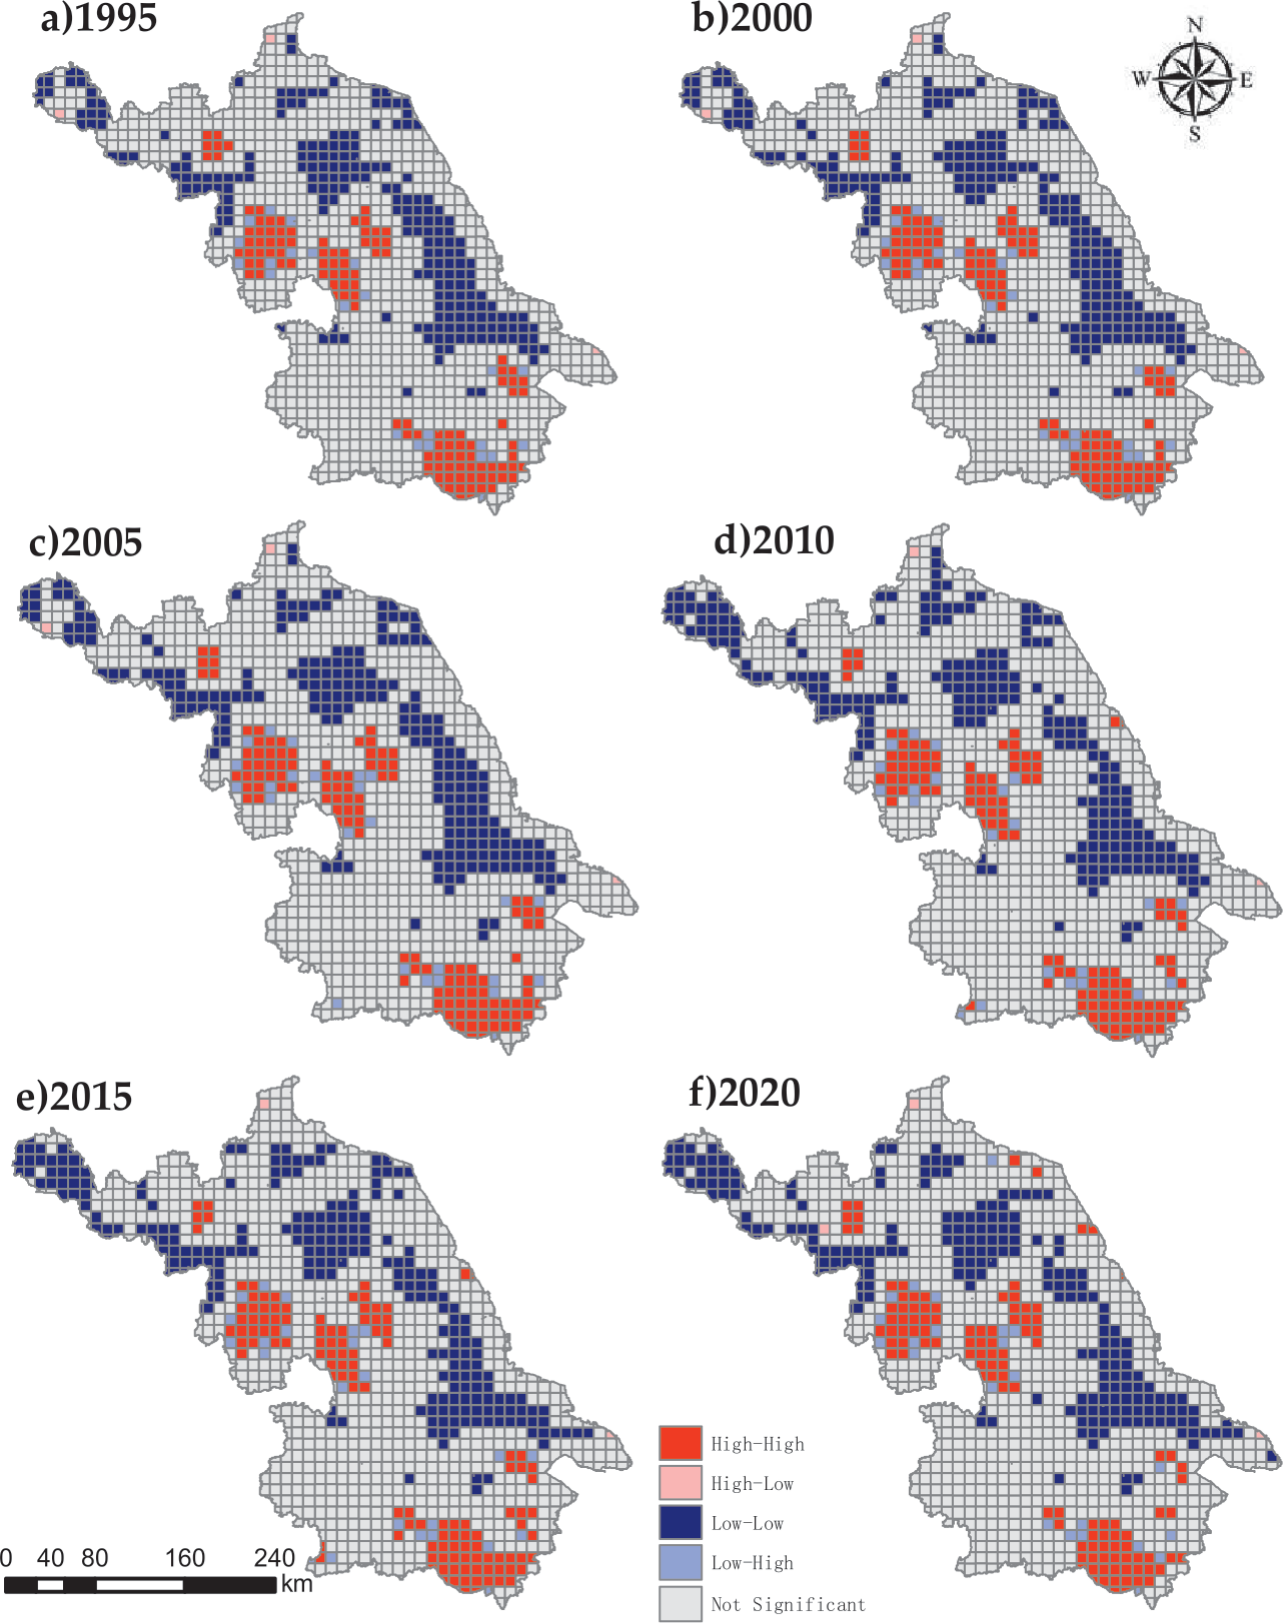
Local spatial autocorrelation analysis was carried out on the data to learn more about the spatial clustering characteristics of the ESV of Jiangsu Province (Fig. 7). As per the findings high–high aggregation and low–low aggregation were dominant in the clustering distribution of the ESV of Jiangsu Province. Spatially, the high–high aggregation zones were mostly concentrated in Suqian and Huai'an in northern Jiangsu, Yangzhou in central Jiangsu, and Suzhou and Wuxi in southern Jiangsu. The low–low aggregation zones were mainly concentrated in the northwestern part of Xuzhou, the central part of Lianyungang, the southwestern part of Suqian in the northern part of Jiangsu, and the northwestern part of Yancheng and the northwestern part of Nantong in the central part of Jiangsu. Overall, the range of low–low agglomerations was much larger than that of high–high agglomerations and both ranges first increased and then decreased, with little change, and the spatial agglomeration of the ESV of Jiangsu Province gradually decreased.
Table 3.
Coefficient of sensitivity of the ESV coefficient in Jiangsu.
Discussion
Impact of Land Use Change on the ESV of Jiangsu
Clarifying the impacts of land-use change on the value of ecosystem services is vital for the realization of regional sustainable development and construction of ecological civilization. Most of the current studies on the value of ecosystem services are based on ecologically sensitive areas [45-47] and few studies have been conducted in economically developed provinces. The size of the study area significantly affects the value of ecosystem services, limiting the precision of the study of the impact of land use change on the value of ecosystem services, and there is a need to find a method that can break through this limitation [48]. The time span of the study is equally important to the findings, with most of the existing studies having a time series of less than twenty years, and few having more than twenty years [49, 50]. In our study, we chose Jiangsu Province, a coastal province with a developed economy, as the study area, and modified the equivalent factor method proposed by Xie et al. to make it applicable to Jiangsu Province. The period 1995-2020 was chosen as the study period, and a 10 km× 10 km grid was used as the study unit to break through the time and area limitations of the study area.
The increase in the built-up area and the reduction in ecological land were demonstrated to be the primary causes of substantial changes in land use types in economically developed regions such as Jiangsu Province. For instance, the LULC pattern in Fujian Province considerably altered between 2000 and 2018, with a major decline in the amount of forestland but an increase in the built-up area [51]. Between 1986 and 2017, the built-up area in Guangdong, Hong Kong, and Macao rose considerably, while the farmland and grassland decreased [32]. Our findings are consistent with those of other studies [52, 53], according to which, cropland, forestland, and grassland in Jiangsu have constantly reduced and the built-up area, the water area, and the unused land have regularly increased. There was substantial change in land use in Jiangsu Province between 1995 and 2010, with continuous urbanization resulting in a notable decline in cropland and a notable increase in the built-up area. In 2010-2020, land use in Jiangsu Province tended to be stable with the effective implementation of various ecological protection policies.
We measured the ESV of Jiangsu Province from 1995 to 2020 by the equivalent factor method of LULC and discovered that one of the crucial influencing factors of the change in ecosystem service function and structure was the change in LULC. From 1995 to 2020, the total ESV of Jiangsu increased by USD 31.55 × 10⁸, among which, the ESV of cropland decreased from USD 90.26 × 10⁸ to USD 80.24 × 10⁸. The ESVs forestland and grassland ESV also decreased by USD 2.49 × 10⁸ and USD 2.901 × 10⁸, respectively, but the total ESV of Jiangsu Province still showed a rising trend, attributable to the increase in the water area ESV from USD 367.47 × 10⁸ to USD 639.16 × 10⁸. The increase in the water area ESV was basically because of the increase in the water area and the remarkably high ecosystem service value coefficient of the water area. Suzhou had the highest ESV among the 13 prefecture-level cities in Jiangsu Province, making up 17.76% of the ESV of Jiangsu Province in 2020. It was followed by Yancheng, Huai’an, and Suqian, with ESVs of 12.25%, 12.14%, and 9.36%, respectively, all of which had the common characteristic of large water areas. According to the available literature, the built-up area has a significant negative effect on the ESV [54, 55]. The lowest ESV ratios in 2020 were in Zhenjiang, Taizhou, Changzhou, and Xuzhou, which had large built-up area ratios, with the lowest built-up area ratio (19.42%) in Taizhou and the highest ratio (24.12%) in Changzhou. Built-up area and water area are, in general, the key to determining variations in the value of ecosystem services among all land use types.
Hydrological regulation, climate regulation, and biodiversity protection make up the three main components of the increase in the ESV of Jiangsu Province in terms of individual ecosystem service value, making up over 75% of the province’s overall ecosystem service value. The importance of these three services is also supported by existing studies. Li et al. [56] found that from 1995 to 2035, the built-up area and cropland in Central Asia will increase by 322.40% and 22.10%, respectively, and biodiversity protection, food production, and hydrological regulation accounted for 80.52% of the total ESV. Regulation services were the main source of the ESV of Jiangsu Province throughout the research period, contributing the most in each of the six periods, accounting for 79.16%, 79.24%, 79.29%, 79.52%, 79.53%, and 79.56% of the province’s overall ESV. The fundamental explanation of this is the sizeable water area in Jiangsu Province, with its high value coefficient in the value of individual ecosystem services.
Overall, ecosystem services are crucial for human existence and green development. The primary objective of ESV evaluations is to support decision-makers in improving ecological conservation planning and management to promote sustainable human and natural development. Analysing the spatial and temporal evolution characteristics of ecosystem service values based on the grid can provide a basis for ecological spatial planning and ecological use control schemes in Jiangsu Province. Based on the spatial autocorrelation analysis, it can provide a reference for the formulation of differentiated ecosystem compensation policies, which is important for the ecological protection and high-quality synergistic development in Jiangsu Province.
Limitations of the Study
The land use data employed in this study currently lack sufficient resolution and have certain limitations. In future ESV-related studies, higher-resolution remote sensing image data should be widely used to improve the assessment accuracy. The unit-area-based equivalent factor method, first proposed by Costanza et al. [35] and later modified by Xie et al. [38], was used in this study to estimate the ESV. In this method, we used only the grain data of three crops, rice, corn, and wheat, for 25 years, which will undoubtedly exert a slight negative impact on the objectivity of the estimated ecosystem service values. The built-up area was not included in the ecosystem service value measurement because of its systematic complexity and difficult data access, which should be considered in future studies. However, in order to build an ecological civilization and regionally coordinate sustainable economic development in Jiangsu Province, this study analyzed the spatial and temporal evolution of ecosystem service values as a result of land use change. The study’s findings are valid and reliable.
Conclusions
In this study we measured the value of ecosystem services in Jiangsu from 1995 to 2020. In addition we explored spatio-temporal evolution characteristics of the ecosystem service value in Jiangsu Province. The results show the following:
(1) The total ESV of Jiangsu Province showed an overall upward trend, with an increase of 3.15 billion USD and a growth rate of 6.47% from 1995 to 2020. Water area and cropland were the largest contributors in terms of ESV and had the largest impact on the ESV. The water area had the highest share in the service value coefficients of hydrological regulation, environ-mental purification, biodiversity protection, and recreation culture.
(2) Sensitivity analysis demonstrated that the ESV of Jiangsu Province is inelastic to the modified value coefficient and that the modified value coefficient is applicable to Jiangsu Province. The sensitivity index of the ecosystem service value of each land use type is in the following order: water area>cropland>forestland > grassland>un-used land. This means that water area and cropland are the highest contributors to the ESV of Jiangsu Province.
(3) The ESVs of all 13 cities in Jiangsu Province that were part of this study show a significant positive spatial correlation in spatial distribution and the positive correlation is gradually weakening. The clustering connection of the ESV of Jiangsu Province exhibited high–high and low–low agglomeration as the primary clusters and high–low and low–high agglomeration as the supplementary clusters.
In general, land use changes brought on by rapid urbanization and the increase of water area have appreciably impacted the ESV of Jiangsu Province. To achieve environmentally friendly and sustainable economic development, it is imperative to conduct scientific assessments of ecosystem service values. The study’s findings can be used as a guide when making decisions on protecting the ecological environment and optimizing the land use structure of Jiangsu Province.

