

Introduction
The rise of ecology leads to the rise of civilization, while the decline of ecology leads to the decline of civilization. Since the reform and opening up, the Communist Party of China has led people of all nationalities to adhere to and develop socialism with Chinese characteristics. The comprehensiveness of national strength has been greatly enhanced. But with the rapid development of the economy, the frequent occurrence of extreme weather, pests, and diseases, virus epidemic outbreaks, and the frequent occurrence of environmental pollution and destruction of the phenomenon have also appeared to enhance the protection of the ecological environment and to improve the quality of the environment to meet the ardent expectations of the general public. In the new development stage, higher requirements for ecological civilization are put forward. But it also means the reconstruction of ecological civilization and green development in China. During the “14th Five-Year Plan” period, the great rejuvenation of the Chinese nation is in a critical period. The construction of ecological civilization in the new stage of development must analyze the overall situation of the internal and external environment, treat ecological problems with foresight, optimize the means and methods of ecological and environmental management, and strategically lay the effective use of environmental resources, so as to make the development of “greenness” and “affluence” enhance each other.
This paper measures the coordinated coupling relationship between China’s ecological environment and economic development from 2013 to 2022 through a coupled system model and principal component analysis. Firstly, the introduction section introduces the research background and significance. Secondly, in the literature review section, the development process of the coordinated coupling model and its application in ecological environment analysis were introduced. Once again, the data and its sources used in this article, as well as the specific steps of the coupling coordination model, were introduced in the materials and methods section. Finally, the coupling coordination degree and spatiotemporal evolution trend of China’s ecological environment and economic development were introduced in the results and discussion. Based on these conclusions, this article also proposes relevant countermeasures and suggestions to improve the ecological environment.
Literature Review
Scholars have studied the ecological environment and economic development earlier. The Kuznets curve theory was first proposed, which defined it as environmental degradation that first increases with national income per capita in the early stages of economic growth and then decreases with GDP per capita after reaching a threshold known as the tipping point, which means that it is believed that the economic-environmental relation curve has an inverted U-shape [1]. Theoretically, EKC depends not only on the level of GDP per capita, but also on a range of changes behind economic growth. Generally, economists analyze the mechanisms behind EKC by studying scale effects, structural effects, and technological effects. However, according to the EKC literature, EKC is essentially an empirical phenomenon rather than some kind of law, which suggests that the evidence for EKC is mixed. Some researchers argue that there is no evidence to support the EKC hypothesis. Emissions of three pollutants (CO2 NOx, and SO2) are positively correlated with income, but there is a possibility that emissions could be reduced as a result of technological progress and structural change [2]. The potential relationship for all three pollutants is a U-shaped inverse, and as economic growth rises, exhaust gas, wastewater, and solid waste first increase and then decline to reach an inflection point [3].
Recently, some scholars have conducted empirical research on the relationship between the ecological environment and economic development in a certain region of China. For example, Yuan et al. chose Xi’an City as the object of research, and the results showed that Xi’an City needs to promote the development of good economic science by transforming the mode of economic growth and the power of growth [4]. Xie and Han conducted a coupled evaluation study using some data from 1987 to 2011 in Gansu Province, which concluded that there is still a lot of room for improvement and provided informative suggestions for its development [5]. Tang and Du conducted a study on the coordinated relationship between regional economic development and the ecological environment in Shaanxi Province, and the results showed that the key to the coordinated development of Shaanxi Province is to strengthen the regional spatial connection and change the economic growth mode [6]. The results show that the key to coordinated development in Shaanxi Province is to strengthen regional spatial links and change the economic growth mode. Mao and Guo studied the overall coupling and coordination of the mountain economy and ecosystem in Shanxi Province, and the results showed that the level of coupling and coordination between the economic development and ecological environment in Shanxi Province showed an overall upward trend and had a large space and potential for development [7]. Su concluded that the ecological environment system and socio-economic system in Ningxia are in the stage of coordinated development by the entropy weight method [8].
Some other scholars introduced different methods, such as using the gray correlation analysis model [9], the PSR-GCQ model, the ecological footprint model [10], the multifactor integrated evaluation method, the modified decoupled coupling model [11], and the gravity model [12], to study the coordinated development between the ecological environment and economic development in different regions. Other researchers in the economy and environment combined innovation-ecology [13], land [14], population [15], and other sub-systems, such as innovative research.
Table 1.
Evaluation index system and weights
To summarize, most scholars have conducted empirical research on the coupling relationship for a province, city, or local area or introduced other subsystems to conduct multi-system research. Most of them have chosen the entropy weighting method, but there are very few studies on the coupling relationship between the ecological environment and the economic development of the whole country. Therefore, this paper will take the relevant indicators of provincial regions from 2013 to 2022, choose the global principal component analysis method to determine the weights and study the couple coordination degree between the ecological environment and economic development in China.
Material and Methods
Construction of the Evaluation Indicator System for Ecological, Environmental, and Economic Development
The ecological environment is the sum of natural and social factors that surround an organism and can directly or indirectly affect its survival and development. In the context of the contemporary economy, the mean-ings of economic development can be numerous. A more representative statement is that economic development is an increase in output as well as a change in the structure of the economy [16]. On the basis of reference to existing studies [5, 6, 13, 15, 16], combined with the above un-derstanding of the connotation of ecological environment and economic development and following the principles of data reliability, completeness, and availability, the ecological environment system is divided into three levels of environmental pollution, environmental resources, and environmental governance, and nine indicators such as sulfur dioxide emissions, greening coverage of built-up areas, and comprehensive utilization of industrial solid waste are selected to constitute the indicators. The indicators of the economic development system are divided into economic operation, industrial structure, residents’ income and consumption, and social development at four levels.
Determination of Weights of Evaluation Indicators
Data Sources and Processing
In this paper, 30 provinces in China (Tibet was not included because of the serious lack of data) were selected as the research object, and the investigation interval was 2013–2022, based on the China Statistical Yearbook and the China Environmental Statistics Yearbook, to obtain the required indicator data. Due to the difference in scale of each indicator, the standardization method of extreme difference was chosen to standardize the raw data.
When Xij is a negative correlation indicator:
When is a positive correlation indicator:
Where Xij is the initial value of the jth indicator for the object, the max(Xij) and min(Xij) are the maximum and minimum values of the original values of the jth indicator for all objects, respectively, and Yij is the corresponding standardized value after the dimensionless quantization using the method of polar deviation.
Determination of Weights
This paper establishes multiple levels for the ecological environment and economic development subsystem, and each level includes multiple indicators because the significance of each indicator is different and the degree of influence on the comprehensive evaluation is not all the same. So it is necessary to assign weights to the indicators at each level to ensure that they are scientific and accurate. If only the cross-section data of each year is subject to principal component analysis, because of the differences in the main plane, the principal components of different years are not comparable, so this paper selects the global principal component analysis that includes the time dimension and finally obtains the weights of each indicator as shown in Table 1.
Empirical studies typically use panel data for consecutive years. There is no incorporation of the time dimension, so the analytical results derived from applying traditional principal component analysis to the cross-sectional data for each year cannot be compared longitudinally over time. The global principal component analysis is based on combining the cross-sectional data tables of many years with the time dimension into a unified three-dimensional time-series data table and then applying the classical principal component analysis, i.e., a two-stage study [17, 18].
The main steps are as follows:
(1) Combining multi-year cross-section data into stereo time-series data tables:
(2) The global variable, which is also known as the distribution of values of the global cluster points on the j indicator, can be expressed by the formula.
(3) The center of gravity of the global data table is:
(4) Calculate the covariance matrix (V) of the normalized data table.
(5) Find the eigenvalues of the covariance matrix and the corresponding eigenvectors.
Coupling Coordination Model
(1) Comprehensive development level index. Using the standardized data and the index weights calculated by the global principal component analysis Wj, the ecological environment development index, as well as the economic development index of each province in China, are calculated with the following formula:
On this basis, the index of the level of comprehensive development of the whole system, T, is calculated using the following formula:
In the formula, α and β are the coefficients to be determined for the ecological environment and economic development subsystems, respectively. Setting them is 0.5 [19].
(2) Coupling degree. The higher the degree of coupling, the stronger the degree of interaction and mutual influence between the two systems of ecosystems and economic development. Referring to the above-mentioned studies, the formula for calculating the coupling index of the two systems of ecosystems and economic development is as follows:
(3) Coupling coordination index. The coupling coordination index refers to the degree of benign coupling in the interaction and mutual influence of the two systems of ecological environment and economic development, which shows the size of the level of coordination between the two systems. The formula is as follows:
Classification of the coupling coordination degree
Referring to the existing research results [20], the coupling coordination level is categorized into ten grades, including high-quality coordination (0.9~1.0; grade = 10), good coordination (0.8~ < 0.9; grade = 9), intermediate coordination (0.7~ < 0.8; grade = 8), primary coordination (0.6~ < 0.7; grade = 7), forced coordination (0.5~ < 0.6; grade = 6), near disorder (0.4~ < 0.5; grade = 5), mild disorder (0.3~ < 0.4; grade = 4), moderate disorder (0.2~ < 0.3; grade = 3), severe disorder (0.1~ < 0.2; grade = 2), and extreme disorder (0~ < 0.1; grade = 1).
Results and Discussion
Comprehensive evaluation analysis uses multiple indicators to evaluate and analyze the comprehensive development of ecological environment and economic development in each province and city, and coupled evaluation analysis uses the coupled coordination index to evaluate and analyze the level of coordinated development of ecological environment and economy in each province and city, and the two are complementary to each other.
The Spatiotemporal Evolution Trend of the Composite Development Index
According to the above formulas, the ecological environment index, economic development index, and comprehensive development index of each province and city in China in 2013 and 2022 are calculated, respectively, and the results are shown in Table 2.
Table 2 shows that in 2013, Hainan, Chongqing, Sichuan, and other places ranked top in the ecological environment index, indicating that their environmental resources are better, sulfur dioxide, nitrogen oxides, particulate matter, and other environmental pollution emissions are less, and there is better environmental governance. Hebei, Shanxi, Henan, Gansu, Xinjiang, and other places in the ecological environment index ranked at the bottom of the list. This is due to the fact that Hebei, Shanxi, Henan, etc. are the pillars of industry; iron and steel, building materials, petrochemicals, and other highly polluting and energy-consuming industries are more. The emissions of sulfur dioxide, nitrogen oxides, and particulate matter remain high, and environmental pollution is serious. Gansu, Xinjiang, and other northwestern regions due to the innate environmental fragility coupled with overgrazing and other anthropogenic activities such as the interference of the intensification of the degradation of the grassland, the shrinkage of the forests, the diminished capacity of the water source, the intensification of the degree of desertification of the land, and a series of other environmental problems, so these provinces’ ecological environment is in poor condition.
Guangdong, Shanghai, Jiangsu, Beijing, and other places ranked at the forefront of the economic development index, these areas of the provincial economic foundation and comprehensive competitiveness of strong, better economic development. Gansu, Guizhou, Yunnan, Hainan, and other places due to their geographic location, topography, and terrain are more complex, transportation is relatively inconvenient, the brain drain is serious, the overall competitiveness of the economy is weaker, and the economic development is backward.
Beijing, Guangdong, Jiangsu, Shanghai, and other places are at the top of the comprehensive development list due to their strong economic development and good ecological environment. Jiangxi, Hainan, Shandong, and other places are in the middle of the list due to their strong development of the ecological environment and the economy, or a more even development of the two. Gansu, Guizhou, Xinjiang, and other places are at the bottom of the list due to their lagging economic development and poorer ecological environment.
Table 2 shows the status of the comprehensive development of the ecological environment and economy in China. Guangdong, Jiangsu, and Shandong have a high ecological environment index and economic development index, indicating that these provinces and cities emphasize the protection of the ecological environment and vigorously promote the development of the economy at the same time. Xinjiang, Ningxia, Inner Mongolia, and other places in the ecological environment index and economic development index are lower, indicating that the ecological environment and economic development of these provinces and cities are relatively backward, economic construction needs to be strengthened, and ecological investment needs to be increased. Jiangxi, Anhui, Sichuan, and other places where the ecological environment ranking is higher than the economic development ranking, belonging to the economic development lagging behind the ecological environment type. Liaoning, Zhejiang, Shanghai, and other places where the economic development ranking is higher than the ecological environment ranking, belong the ecological environment, lag behind the economic development type. The ecological environment-economic development composite indexes of Guangdong, Jiangsu, and Zhejiang rank in the top three, while the ecological environment-economic development composite indexes of Gansu, Guizhou, and Hainan are in the bottom three. In general, the Northwest region has a lower rank in the composite development index, while the Southeast region has a higher rank in the composite development index, indicating that its ecological environment and comprehensive economic development are better than those of the Northwest region.
According to Table 2, Hebei, Henan, Shandong, Shanxi, and Guangdong are in the top five with the most growth in the Eco-Environmental Index from 2013–2022. The industrial structure of Hebei, Shanxi, and Henan is dominated by energy and raw material industries. In recent years, they have been utilizing modern science and technology to upgrade and transform the traditionally heavily polluting industries, adjust the energy structure, increase the proportion of clean energy, and reduce industrial pollution. Guangdong and Shandong have also increased their energy saving and environmental protection expenditures and strengthened their environmental governance based on upgrading the industrial structure. As a result, the quality of the ecological environment has improved significantly. Hainan, Tianjin, Yunnan, Chongqing, and Liaoning rank in the bottom five with the least growth in the Eco-Environmental Index from 2013–2022. Compared to other provinces, these provinces have not significantly improved their Eco-Environmental Quality in this decade, and their environmental governance has not been very effective, so they still need to find ways to reduce pollution and carbon emissions and improve the Eco-Environmental Index in the future.
Table 2.
Comparison of ecological and economic development indices in 2013 and 2022
Jiangsu, Guangdong, Zhejiang, Shanghai, and Beijing are in the top five with the most growth in the EDI from 2013–2022. This is due to the rapid economic development of these provinces and cities, whose economies are mainly focused on high-precision industries, with a focus on high-end industries such as new energy, information technology, and AI, and vigorously developing new and future industries such as the digital economy. Heilongjiang, Jilin, Liaoning, Qinghai, and Tianjin are in the bottom five with the least growth in the economic development index from 2013–2022. This indicates that these provinces and cities have been developing their economies more slowly in the study interval and need to continue to adjust their industrial structure, accelerate industrial transformation and upgrading, and improve their economic development index.
Guangdong, Jiangsu, Henan, Shandong, and Zhejiang rank among the top five in terms of CCPI growth from 2013–2022, with balanced and strong ecological and economic development and better overall development. Hainan, Tianjin, Liaoning, Heilongjiang, and Qinghai rank in the bottom five in terms of CCPI growth from 2013–2022, and their ecological environment and economic development are sluggish, with poorer overall development.
Analysis of Coupling Coordination Degree of Ecological Environment and Economic Development
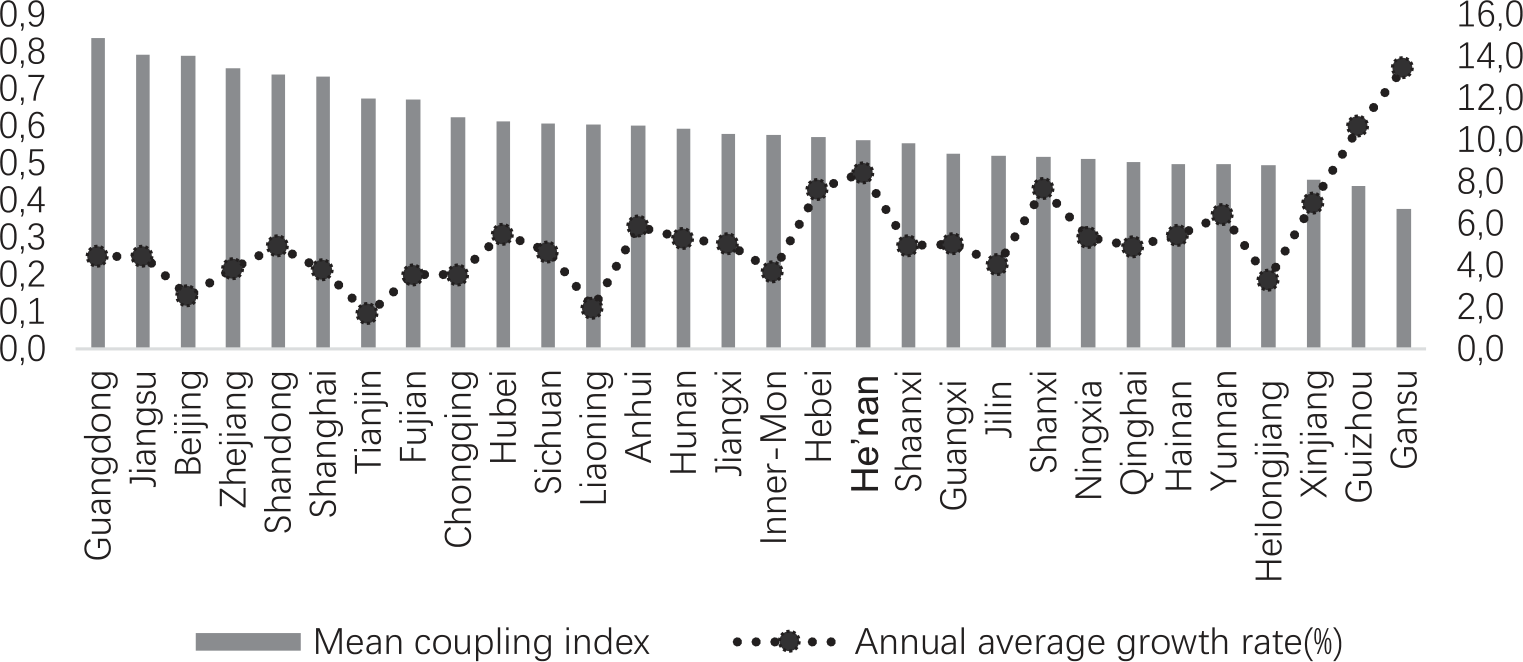
At present, the coupling degree of each region in China is greater than 0.8, indicating that the two systems of ecological environment and economic development of each province in China are in the stage of high-level coupling, and the average degree of the coupling coordination of the two systems in China is high in the study interval. The ecological environment and economic development interact strongly with each other with positive interactions, while the coupling and development relationship continues to evolve and rise smoothly. Shandong, Beijing, Shanghai, Zhejiang, Jiangsu, and Guangdong have a coordination grade of 9 and 10. In the stage of good coordination as well as high quality coordination, these areas are ranked at the top of the coupling coordination, the ecological environment and economic development coupling and coordination of the development of a high level of economic development to improve the quality of the environment, economic development to improve the quality of the economy, science, and technology, human resources, etc., and the protection of the ecological environment can promote the sustainable development of the economy. The protection of the ecological environment can also promote sustainable economic development and become a booster for high-quality economic development, thus forming a good cycle. Shanxi, Inner Mongolia, Jilin, Guangxi, and the other 8 provinces and municipalities ranked in the upper middle, at a coordination level of 7, are currently in the primary coordination stage. Hebei, Liaoning, Anhui, Fujian, Jiangxi, and the other 11 provinces and municipalities ranked in the middle and lower middle, at a coordination level of 8, in the intermediate coordination stage. In the period of integration and adaptation, the level of coordination in the development of the level of coordination still needs to continue to be improved. Heilongjiang, Hainan, Guizhou, Xinjiang, and Gansu are ranked at the bottom of the coupling coordination degree, with a coordination grade of 6, located in the barely coordinated situation, reflecting the low degree of benign coupling of ecological environment-economic development systems and the need to seek relevant suggestions to strengthen the coordination of the two systems.
The Spatial Characteristics and Evolutionary Trends of Coupling Coordination Degrees
After constructing the ecosystem-economic development coupling coordination model, the weights of each index can be determined by global principal component analysis, and then the coupling coordination model is used to obtain the coupling coordination degree of each province in China. The average coupling coordination degree and annual growth rate of each province from 2013 to 2022 are reported in Fig. 1.
The Temporal Characteristics and Evolutionary Trends of Coupling Coordination Degree
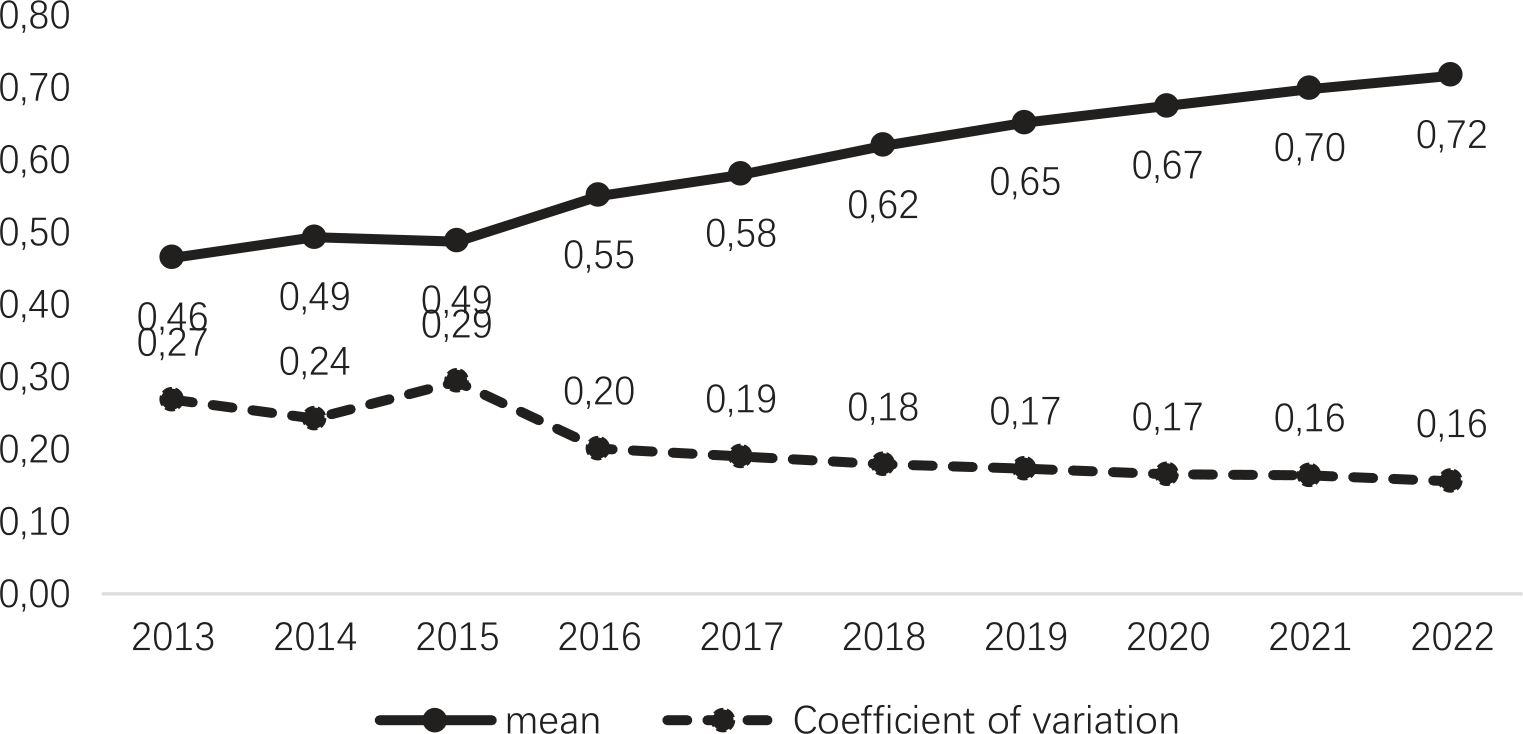
As can be seen from Fig. 2, the coupling and coordination degree of ecological environment and economic development in China’s provinces from 2013–2022 is in a steady growth state during this decade, and the relationship between the two is increasingly developing in a more coordinated direction. However, from 2013–2016, there were some provinces where the coupling coordination degree declined, such as Heilongjiang, Liaoning, and Jilin, the three northeastern provinces, which are rich in minerals, whose pillar industries are traditional heavy industries, mostly pollution-intensive industries with high pollution intensity. Therefore, while realizing economic development, there are a lot of environmental problems, such as overexploitation leading to resource depletion and atmospheric pollution. The degree of coupling coordination decreases due to the frequent occurrence of severe weather caused by overexploitation, such as resource depletion, air pollution, etc. The over-utilization of resources such as overgrazing, deforestation, and a large amount of ecological water extraction in Inner Mongolia has also caused the environment to deteriorate, and grassland degradation, grassland sanding, land desertification, and wind erosion of the land have appeared. Generally speaking, the coupling coordination degree of each province in China shows a gradual increase in the research interval. In recent years, the CPC Central Committee has comprehensively strengthened the construction of ecological civilization, adding green color to the modernization of harmonious coexistence between human beings and nature, and each province seeks measures in line with its own reality, accelerates the adjustment of industrial structure and energy structure, promotes the green and low-carbon transformation, reduces environmental pollution, and strengthens environmental protection in the course of economic development, so that the coupling degree of coordination has increased as a whole.
Conclusions
Based on the indicator data for 2013–2022 in 30 provinces in China, this paper divides the ecological environment system into three aspects. The indicators of the economic development system are divided into four aspects. We apply the coupling coordination model to measure the degree of coupling coordination between the ecological environment and economic development in China, measure the development status of coupling coordination in each province, and study its temporal and spatial characteristics. The following conclusions have been drawn:
(1) The comprehensive development of the ecological environment and economic development systems in China’s provinces is unbalanced. The ecological environment index and economic development index of the northwestern region are both low. These indicate that these provinces are lagging behind in terms of the ecological environment and economic development. In the Southeast region, the ecological environment index and economic development index are both higher, and the overall development index ranks high, indicating that these provinces emphasize the protection of the ecological environment and at the same time vigorously promote the development of the economy. In general, the ecological environment and economic development of the Southeast region are better than those of the Northwest region.
(2) From a time perspective, the degree of coupling and coordination between the ecological environment and economic development in China’s provinces has continued to rise from 2013 to 2022. The degree of coupling coordination between the ecosystem and economic development continues to rise, with significant changes. The coupling degree coordination between the ecological environment and economic development of China’s provinces in the study interval is maintained at 0.8 or above, which is in a relatively stable state. The coefficient of variation decreased from 0.27 to 0.16, indicating that the differences in coupling coordination between different provinces are continuously decreasing.
(3) In terms of spatial patterns, the degree of coupling coordination among the country’s provinces has formed a spatial pattern of high in the east and low in the west. By 2022, most provinces in the eastern and southern parts of China will be in a state of coordination, and the degree of coordination will continue to be optimized. In the northwestern region of China, the degree of coupling coordination has continued to improve from a state of dissonance to a state of coordination and has basically achieved the stages of intermediate and primary coordination.
Suggestions
(1) The government should accelerate the adjustment of industrial structures, and vigorously cultivate new energy, the digital economy, and other strategic emerging industries. Focus on the development of automation, digitalization, and intelligent future industries; promote the adjustment of energy structures; seize the opportunity; and actively lay out new energy industries. Strengthen the conservation and utilization of resources, improve the efficiency of their utilization, and vigorously push forward the clean and efficient utilization of coal.
(2) Deepening coordinated governance to reduce pollution and carbon emissions. Controlling pollution emissions from coal, iron and steel, chemicals, electricity, and other industries, guiding industries to “green”, guiding the green transformation of traditional high-energy-consuming enterprises, and conveying low-carbon concepts upstream and downstream of the industrial chain. At the same time, it is also necessary to comprehensively improve the total amount and quality of forest and grassland resources and improve the carbon sink capacity of forests, grasslands, and other ecosystems.
(3) Establishing a scientific institutional system, revising and improving existing ecological environmental protection and resource and environmental management systems, laws, and regulations, accelerating the construction of a modern environmental governance system, and realizing at an early date that there is already a law to follow in all areas of the ecological environment. At the same time, we will continue to promote technological innovation in ecological and environmental governance, promote the application of scientific and technological achievements, and encourage more social capital to enter the scope of ecological civilization construction.

