

Introduction
Land ecosystems constitute a crucial component of the Earth’s carbon reservoir, making significant contributions to the global carbon cycle [1-3]. They also serve as primary carbon sinks on Earth [4, 5], and enhancing carbon storage in ecosystems is an effective measure to improve their carbon sequestration capacity [6]. Among the various factors influencing carbon storage in land ecosystems, land-use change stands out as one of the most significant [7, 8]. It exerts a profound impact on carbon storage by altering regional climate, soil carbon, and vegetation biomass [9-11]. Since the Industrial Revolution, rapid urbanization has accompanied increased human activities such as industrial production, construction development[12, 13], and deforestation, resulting in disordered land use patterns and severe resource wastage. This has contributed to the accelerated global warming [14-16]. By 2009, China had surpassed the United States to become the world’s largest emitter of CO2, and with continued economic growth, carbon emissions from land use are expected to rise, leading to ecosystem degradation and even the loss of its self-recovery capacity. Ecosystem carbon cycling faces a dual threat from climate change and human activities [17]. To address the challenges of climate change and sustainable development, it is imperative to study the response mechanisms of carbon storage to land use [6, 18, 19].
The Integrated Valuation of Ecosystem Services and Tradeoffs (InVEST) model is a reliable method for quantifying carbon storage [20]. It features simple and efficient data manipulation, high visual accuracy of results, and is designed to balance the relationship between development and conservation. It has been particularly successful in assessing the impact of different policies and plans on regional carbon storage [21]. Numerous scholars have utilized the InVEST model to conduct assessments of land use and ecosystem carbon storage [22, 23]. These assessments include studies on the biomass of individual ecosystems and soil organic carbon [24-27], research on the coordination between rapid urbanization and regional carbon cycling, and the exploration of land-use patterns for emission reduction and carbon sequestration [28-31]. Studies have revealed that urbanization is a major cause of carbon loss [32]. However, implementing policies to guide rational land use patterns, preventing agricultural land loss, actively adjusting land use structures to promote intensive land use, and implementing land remediation and ecological restoration measures can increase ecosystem carbon storage to a certain extent [33-36]. These measures contribute to achieving the goal of optimizing land use for low-carbon outcomes [37].
In the context of China’s “peak carbon and carbon neutrality” strategy, there is a demand to comprehensively promote social green and low-carbon transformation, and construct a new pattern of development and protection. Xi’an City serves as the economic core of the Northwestern region of China and is a leading force in the Western Development Strategy [38]. The city’s urban area is densely populated, and the contradiction between economic development and ecological protection is pronounced. The Qinling Mountains, located in the southern part of the city, span multiple counties and serve as a natural ecological barrier with crucial ecosystem service value for not only Shaanxi Province but also the entire Northwestern region. In response to the national “dual carbon” strategy, Xi’an City has integrated low-carbon goals comprehensively into its planning. Based on its unique natural geographical pattern, the city has prioritized the identification of ecological carbon sink areas, protected and reserved farmland, forest land, and grassland, promoted urban greening, implemented ecological restoration, consolidated achievements in returning farmland to forests and grasslands, restricted urban development boundaries, prevented extensive use of construction land, limited the supply of land to high-carbon industries, accelerated urban renewal and land consolidation, while simultaneously safeguarding space for agricultural and economic development. This has resulted in the formation of an integrated pattern of green and low-carbon development, blending natural, historical, and regional characteristics. This study employs the InVEST model to analyze ecosystem carbon storage response to climate and land use changes in Xi’an, China, from 2000 to 2020, advancing beyond traditional ecological carbon assessment methods. Innovatively, it integrates a climate factor approach to adjust mean carbon density across land use types and precisely measures the impacts of climate and land use changes on carbon storage. Additionally, it maps carbon functional areas, distinguishing between carbon sinks and sources, and identifies critical zones for enhanced ecological protection. This research not only reveals trends in carbon storage over time but also emphasizes the critical role of land use modifications in preserving carbon sinks, facilitating ecosystem service recovery, and supporting national dual carbon objectives. It provides essential insights for crafting land use policies, offering valuable guidance for Xi’an and other inland cities in Northwestern China towards achieving ecological civilization goals.
Materials and Methods
Research Area
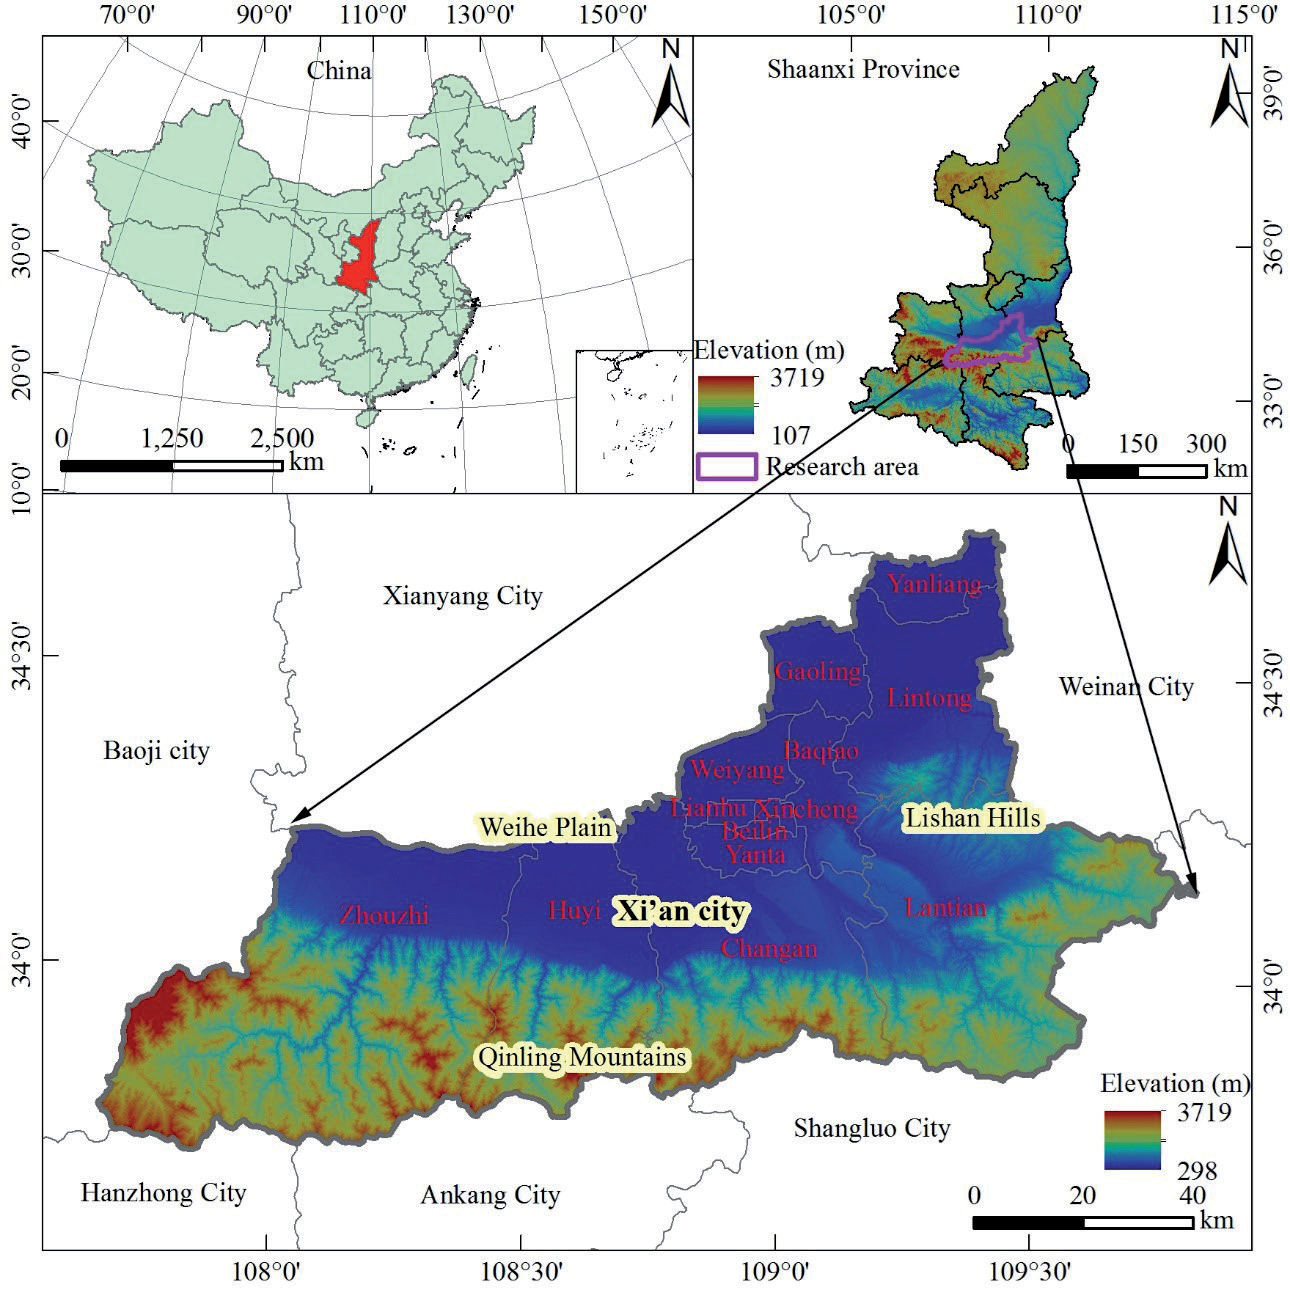
Xi’an City is located in the central part of Shaanxi Province, China (Fig. 1), with coordinates ranging from 107º40′ to 109º49′E longitude and 33º42′ to 34º45′N latitude. Situated to the south of the Qinling Mountains and spanning the Weihe River to the north, it serves as the core city in the Guanzhong Plain urban cluster – a significantly large city renowned globally as a historic city. The topography exhibits considerable variations, with higher elevations in the south and lower elevations in the north. The altitude ranges from 298 to 3719 meters, featuring the intricate peaks and ranges of the Qinling Mountains contrasting with the flat and expansive Weihe River Plain, thus constituting the primary mountainous, hilly, and plain landforms in Xi’an City. The climate falls under the temperate continental category, characterized by cold and dry winters and hot and humid summers. Precipitation and temperature exhibit concurrent seasonal patterns, with an average annual precipitation of approximately 600 mm and an average annual temperature of around 13.5ºC. The annual evaporation ranges between 800 and 1000 mm. The total land area is 10,096.89 square kilometers, with the northern Weihe River Plain serving as the main area for agricultural development and construction. In contrast, the southern Qinling mountainous region and the eastern Lishan hills are the primary zones for ecological conservation. Xi’an City is administratively divided into 13 districts and counties: Zhouzhi County, Chang’an District, Huyi District, Lantian County, Yanta District, Lianhu District, Xincheng District, Beilin District, Baqiao District, Weiyang District, Gaoling District, Yanliang District, and Lintong District.
Data Source
Land use Data
The land use data encompasses three periods in Xi’an City, specifically the years 2000, 2010, and 2020. The dataset utilized is derived from the China National Land Use/Cover Change (CNLUCC) monitoring dataset, which relies on Landsat satellite remote sensing images from the United States as its primary information source. The CNLUCC dataset is a nationally scaled multi-temporal land use/land cover thematic database constructed through manual visual interpretation [39]. It adheres to the land use classification system [40]. The land use data for the three periods in Xi’an City was reclassified into six primary categories: Cropland (Crop.), Woodland (Woo.), Grassland (Gra.), Water area (Wat.), Built-up land (Bui.) and Unused land (Unu.). For consistency with model input requirements, all data were formatted as 30-meter resolution raster datasets. Additionally, a uniform coordinate system, WGS_1984_UTM_Zone_49N, was applied across all datasets.
Meteorological Data
Meteorological data includes the annual average temperature and annual precipitation for both China and Xi’an City. The annual average temperature and annual precipitation for China are obtained from relevant literature, with values of 9ºC and 628 mm, respectively [41, 42]. The values for the annual average temperature and annual precipitation in Xi’an City are sourced from the Statistical Yearbook of Xi’an City for the years 2000 to 2020 (http://tjj.xa.gov.cn/).
Carbon Density Data
The carbon density data include aboveground biomass carbon density (C_above), belowground biomass carbon density (C_below), and soil carbon density (C_soil) for various land use types. The average values for the above-mentioned carbon density components were obtained by referencing the China Land Ecosystem Carbon Density dataset and associated research findings from the National Ecological Science Data Center (http://www.nesdc.org.cn/). These values are provided for six land use types at the national level (Table 1).
Research Methods
Dynamic Degree of Land Use
Land use dynamic degree refers to the extent and manner in which land use types and distribution change over time. It can be used to reflect the rate of change of various land use types in a study area over a certain time scale, revealing the evolutionary patterns of land use patterns [43]. The calculation method is illustrated in Equation (1):
Where ki represents the dynamic degree of a specific land use type. ua and ub denote the initial and final areas, respectively, of a particular land use type within the study area. T represents the time span.
Land use Transfer Matrix
The Land Use Transition Matrix is a crucial tool for studying land use changes. It is employed to depict the direction and quantity of conversions among different land use types within the study scale, representing the inflow and outflow directions as well as the corresponding area magnitudes for each land class [44]. The calculation method is outlined in Equation (2):
Where Cxy represents the pixel value at the x row and y column of the land use raster data at the end of the study period, Mxyt and Mxyt+1 represent the x row and the y column of the raster data for the t period and t+1 period, respectively.
InVEST Model Carbon Storage Module
(1) Estimation of carbon storage
The InVEST model can estimate carbon storage under current land use patterns by combining land use data with basic carbon pool data. This model categorizes carbon storage into four major basic carbon pools: aboveground biomass carbon storage, belowground biomass carbon storage, soil carbon storage, and dead organic matter carbon storage. The total carbon storage is the sum of these four carbon pool storages [45]. Since dead organic carbon storage is challenging to observe and its quantity is relatively small, this study only considers biomass carbon storage and soil carbon storage, excluding the portion related to dead organic carbon storage. The calculation method is detailed in Equations (3-4).
Where Ctotal represents the total carbon storage in the study area (Mg). Ck represents the carbon density for the k land use type (Mg·ha⁻¹). Ak represents the area for the k land use type (ha). Ck–above is the above-ground biomass carbon density of Class k land use type (Mg·ha⁻¹), Ck–below represents the aboveground biomass carbon density for the k land use type (Mg·ha⁻¹). Ck–soil represents the belowground biomass carbon density for the k land use type (Mg·ha⁻¹).
2) Carbon Density and Its Adjustment
Carbon density is a crucial factor in assessing regional carbon storage and is essential data for the InVEST model’s carbon module, which calculates carbon storage. Carbon density can vary due to climate [46-49]. Therefore, for accurate carbon storage estimation, it is necessary to adjust the carbon density for the selected study area.
According to relevant studies, carbon density is mainly influenced by climatic factors such as temperature and precipitation. Tang et al. (2018) explored the impact of climate on carbon storage by estimating carbon density, revealing a negative correlation with temperature and a positive correlation with precipitation. They constructed a model relating carbon density to meteorological factors using an annual average precipitation (MAP) of 400 mm and an annual average temperature (MAT) of 10ºC [48].In regions with an annual average temperature below 10ºC and an annual average precipitation exceeding 400 mm, the carbon density response model was established for China. For Xi’an City, where the annual average temperature exceeds 10ºC and the annual average precipitation exceeds 400 mm, with little variation in temperature and precipitation from 2000 to 2020, the carbon density response model was selected for MAT≤10ºC, MAT>10ºC, and MAP>400 mm. The calculation method is detailed in Equations (5-10).
Table 1.
Average carbon density of six types of land use in China (Mg·ha-1).
| LULC types | National carbon density | ||
|---|---|---|---|
| C_above | C_below | C_soil | |
| Cropland | 0.21 | 3 | 88.53 |
| Woodland | 14.92 | 40.77 | 127.93 |
| Grassland | 1.39 | 3.41 | 96.33 |
| Water area | 0 | 0 | 0 |
| Built-up land | 1.92 | 4.8 | 70.36 |
| Unused land | 0 | 0 | 0 |
Precipitation Factor Impact Model:
(MAT≤10ºC)
(MAT>10ºC)
Temperature Factor Impact Model:
(MAP>400 mm)
Where CSP and CBP refer to the fitted values of soil carbon density and biomass density (Mg·ha⁻¹), respectively, considering the annual precipitation factor. Similarly. CST and CBT represent the fitted values of soil carbon density and biomass density (Mg·ha⁻¹), respectively, considering the annual average temperature factor. MAP denotes annual precipitation (mm), and MAT denotes annual average temperature (ºC).
Applying the aforementioned climate and carbon density response models, the carbon density for each land use type in Xi’an City is adjusted. Correction coefficients are introduced based on the annual average temperature and precipitation data for China and Xi’an City. The correction factor is obtained by multiplying the national average carbon density values (Table 1) by the correction coefficients. Ultimately, the carbon density data for six land cover types in Xi’an City for the years 2000-2020 are derived (Table 2). The calculation method is detailed in Equations (11-14).
Where KSP is the correction factor for soil carbon density based on the precipitation factor. KST is the correction factor for soil carbon density based on the temperature factor. CBP is the correction factor for biomass carbon density based on the precipitation factor. CBT is the correction factor for biomass carbon density based on the temperature factor. KS represents the overall correction factor for soil carbon density, and KB represents the overall correction factor for biomass carbon density.
Carbon Functional Zoning
In consideration of the actual conditions in Xi’an City and based on the changes in carbon density during the study period, the ecosystem carbon functional zones in Xi’an City are categorized into four types from the perspective of “carbon source-carbon sink” interconversion: Carbon balance zone, Carbon sink function enhancement zone, Low carbon optimization zone, and Carbon emission control zone [50], see Table 3.
Table 2.
Carbon density of six types of land use in Xi’an from 2000 to 2020 (Mg·ha-1).
Carbon Storage Response Model to Climate and Land Use Changes
Assuming that land use remains unchanged during a certain period, considering only climate change, the carbon storage under this scenario is considered as the simulated carbon storage under conditions where land use remains constant. The difference between the simulated carbon storage under this scenario and the actual carbon storage represents the impact of climate change on carbon storage. Similarly, assuming that climate remains unchanged during a certain period, considering only land use change, the carbon storage under this scenario is considered as the simulated carbon storage under conditions where climate remains constant. The difference between the simulated carbon storage under this scenario and the actual carbon storage represents the impact of land use change on carbon storage [41]. The calculation method is detailed in Equations (15-17).
Table 3.
Ecosystem carbon function zones in Xi’an.
Where C0 is the actual carbon storage. CSL is the simulated carbon storage under the scenario of land use change. CSC is the simulated carbon storage under the scenario of climate change, CL is the impact of land use change on carbon storage. CC is the impact of climate change on carbon storage. CT is the total change in carbon storage under the combined influence of actual land use change and climate change. The positive or negative values of CT indicate an increase or decrease in the overall change in actual carbon storage, while the signs of CL and CC indicate whether climate or land use change, respectively, led to an increase or decrease in carbon storage.
Results and Discussion
Land Use Temporal and Spatial Changes in Xi’an City
General Characteristics of Land Use Change
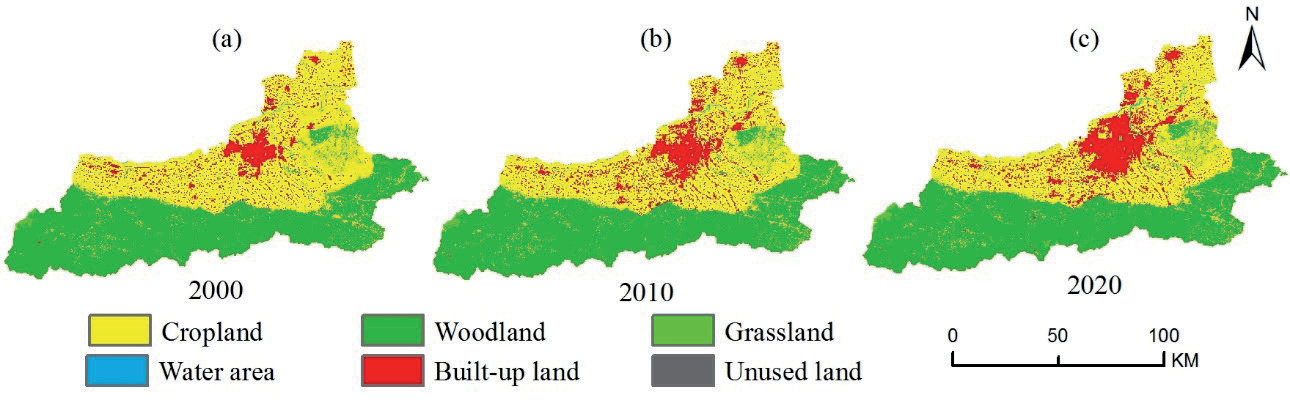
Land use in Xi’an City exhibits significant spatial differentiation, primarily divided by the Qinling Mountains and the central urban area. North of the Qinling Mountains, cropland and urban land dominate, while south of the mountains, forest land prevails. Within the central urban area, urban land is the primary land use, while outside the urban area, cropland predominates, often intersecting with urban land (Fig. 2). The major land use types in Xi’an City are forest land and cropland. From 2000 to 2020, land use changes were characterized by a contraction of cropland and expansion of urban land, with increases in water bodies and grassland. Changes in forest land and unused land were minimal. Spatially, there is an overall trend of “expansion in concentric circles centered on the city core.” Changes in cropland mainly occurred in the plain areas surrounding the urban core, such as Zhouzhi County, Chang’an District, Huyi District, Lantian County, Gaoling District, Yanliang District, and Lintong District. The expansion of urban land mainly occurred in the urban areas of Yanta District, Lianhu District, Xincheng District, Beilin District, Baqiao District, Weiyang District, and Gaoling District. Changes in forest land, grassland, and water bodies mainly occurred in the mountainous and hilly areas of Zhouzhi County, Chang’an District, Huyi District, Lantian County, and Lintong District.
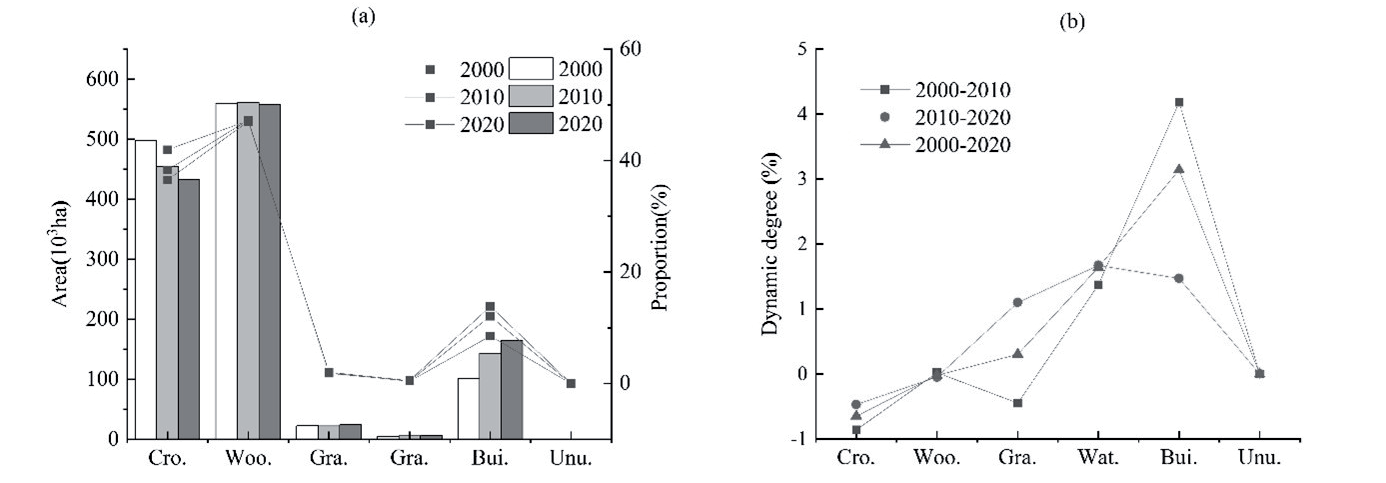
From Fig. 3, it can be observed that cropland has continuously decreased, but the rate of decrease in the later period has slowed compared to the earlier period. The dynamic degree from 2000 to 2020 is -0.65, accounting for a total decrease of 5.43%. Specifically, the dynamic degree from 2000 to 2010 is -0.86, contributing to a decrease of 3.62%, while the dynamic degree from 2010 to 2020 is -0.47, accounting for a decrease of 1.81%. Woodland initially increased and then decreased, with the later decrease exceeding the earlier increase. However, the overall change is not significant, with a dynamic degree of -0.02 from 2000 to 2020, representing a total decrease of 0.16%. Specifically, the dynamic degree from 2000 to 2010 is 0.02, contributing to an increase of 0.09%, while the dynamic degree from 2010 to 2020 is -0.05, accounting for a decrease of 0.25%. Grassland first decreased and then increased, with the increase in the later period surpassing the earlier decrease. Overall, there is an increase, with a dynamic degree of 0.30 from 2000 to 2020, representing a total increase of 0.11%. Specifically, the dynamic degree from 2000 to 2010 is -0.45, contributing to a decrease of 0.09%, while the dynamic degree from 2010 to 2020 is 1.10, accounting for an increase of 0.20%. Water areas have continuously increased, with an accelerated growth rate in the later period. The dynamic degree from 2000 to 2020 is 1.64, contributing to a total increase of 0.14%. Specifically, the dynamic degree from 2000 to 2010 is 1.37, accounting for an increase of 0.06%, while the dynamic degree from 2010 to 2020 is 1.67, accounting for an increase of 0.08%. Built-up land has continuously increased, exhibiting the fastest rate of change and the largest growth magnitude. The rate of expansion slowed in the later period. The dynamic degree from 2000 to 2020 is 3.14, accounting for a total increase of 5.34%. Specifically, the dynamic degree from 2000 to 2010 is 4.18, contributing to an increase of 3.56%, while the dynamic degree from 2010 to 2020 is 1.47, accounting for an increase of 1.78%. Unused land has experienced a slight increase, with minimal change, representing an area of less than 0.01%. There is virtually no change in the dynamic degree and proportion throughout the entire study period, with a slight increase in the later period.
Land Use Transfer Characteristics
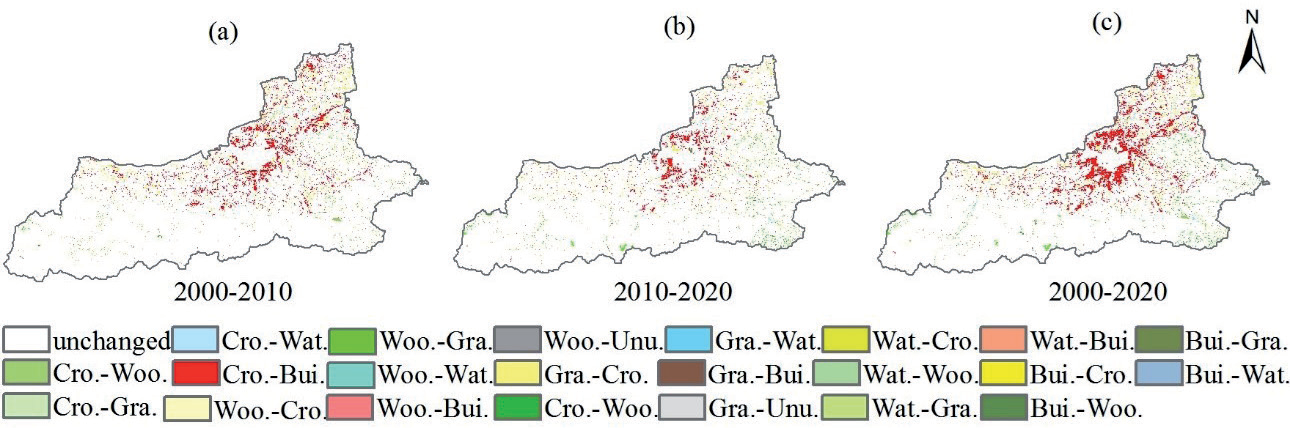
From 2000 to 2020, the predominant land use types undergoing transition in Xi’an were cropland and built-up land, with cropland being the primary source and built-up land being the main recipient. The transfer of built-up land and cropland primarily occurred in the plains, where built-up land expanded in a concentric manner outward from the city center, encroaching upon cropland. The built-up land and cropland in the peripheral counties exchanged in a “point-like” pattern. The transition of forest land and grassland mainly occurred in the Qinling Mountains area, exhibiting a “point-like” or “strip-like” distribution. The transfer of water bodies mainly occurred in the basins of the Jing River, Wei River, and Hei River, displaying a “strip-like” distribution (Fig. 4).
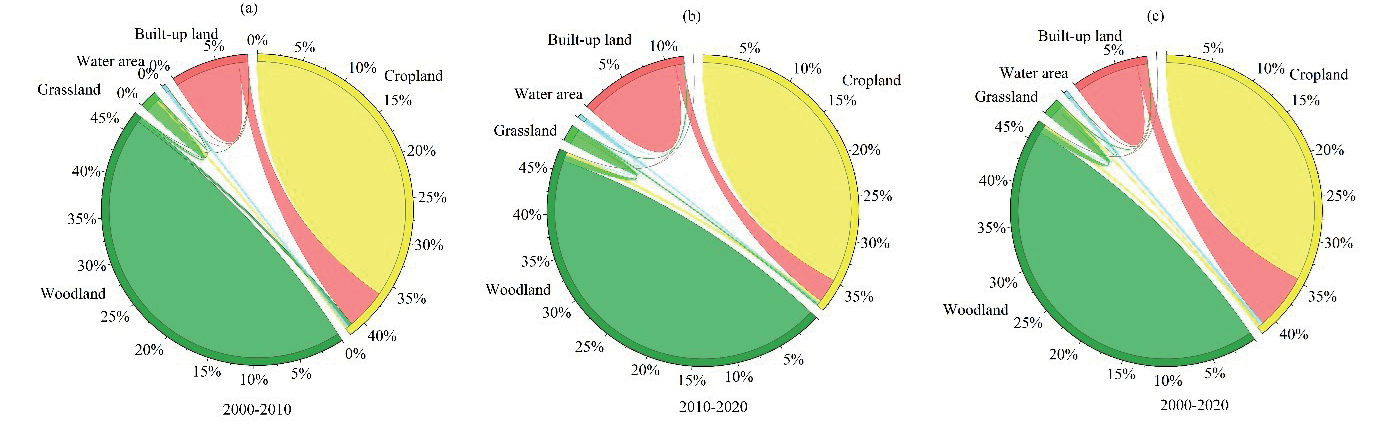
From 2000 to 2020, a total of 106,549.92 hectares of land in Xi’an underwent transitions, accounting for 10.55% of the total area (Fig. 5). Cropland accounted for 68.84% of the total outgoing land, with the majority transitioning to built-up land (89.80%). The incoming cropland accounted for 17.31% of the total, primarily sourced from built-up land (65.82%) and forest land (15.54%). The outgoing rate decreased from 69.22% to 54.35%, while the incoming rate increased from 23.48% to 25.75% from 2010 to 2020 compared to 2000-2010. Woodland accounted for 9.58% of the total outgoing land, mainly transitioning to grassland (67.12%) and cropland (28.08%). The incoming forest land constituted 8.05% of the total, primarily from grassland (64.35%) and cropland (31.67%). The outgoing rate increased from 7.59% to 16.81%, and the incoming rate increased from 8.68% to 12.89% from 2010 to 2020 compared to 2000- 2010. Grassland had an outgoing rate of 7.25%, primarily transitioning to forest land (71.37%) and cropland (21.08%). The incoming grassland rate was 8.35%, mainly sourced from forest land (76.95%) and cropland (15.48%). The outgoing rate increased from 6.42% to 10.25%, and the incoming rate increased from 5.32% to 13.46% from 2010 to 2020 compared to 2000-2010. The water area had an outgoing rate of 2.46%, mainly transitioning to cropland (69.05%), and an incoming rate of 3.73%, primarily from cropland (85.25%). The outgoing rate decreased from 3.11% to 2.00%, and the incoming rate also decreased from 3.82% to 3.23% from 2010 to 2020 compared to 2000-2010. Built-up land had an outgoing rate of 11.87%, mainly transitioning to cropland (95.96%), and an incoming rate of 62.55%, primarily from cropland (98.84%). The outgoing rate increased from 13.67% to 16.60%, and the incoming rate decreased from 58.70% to 44.65% from 2010 to 2020 compared to 2000-2010. Unused land had no outgoing amount from 2000 to 2020, with an incoming amount of 18.72 hectares, constituting 0.02% of the total incoming land, primarily sourced from grassland (62.98%). The incoming rate for unused land increased from 0% to 0.03% from 2010 to 2020 compared to 2000-2010.
Carbon Storage Temporal and Spatial Changes in Xi’an City
General Characteristics of Carbon Storage Change
The InVEST model was employed to estimate carbon stocks in Xi’an for the years 2000, 2010, and 2020.
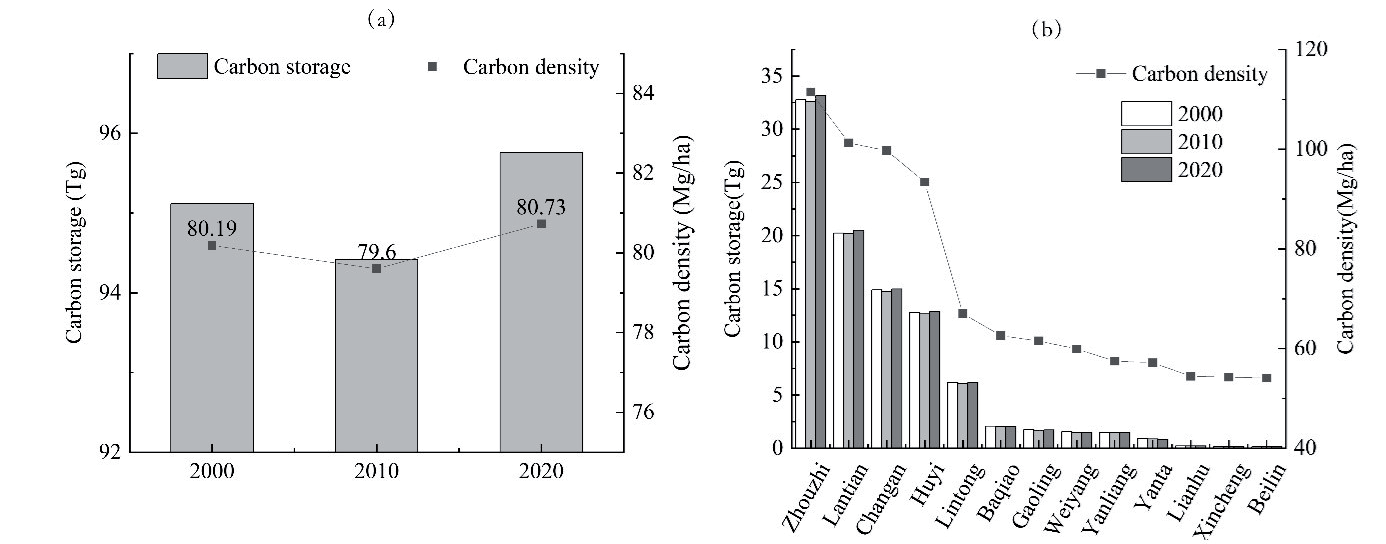
The carbon stocks in Xi’an for the three periods, 2000, 2010, and 2020, were 95.12 Tg, 94.42 Tg, and 95.76 Tg, respectively. The corresponding average carbon densities were 80.19 Mg/ha, 79.60 Mg/ha, and 80.73 Mg/ha. The trends in both total carbon stocks and carbon density in Xi’an from 2000 to 2020 were consistent, showing a pattern of “initial decrease followed by an increase, overall exhibiting an upward trend” (Fig. 6). Over the period from 2000 to 2020, Xi’an experienced a total increase in carbon stocks of 0.64 Tg, accompanied by an average carbon density increase of 0.54 Mg/ha. Specifically, from 2000 to 2010, carbon stocks decreased by 0.7 Tg, and average carbon density decreased by 0.59 Mg/ha. In contrast, from 2010 to 2020, carbon stocks increased by 1.34 Tg, and average carbon density increased by 1.13 Mg/ha.
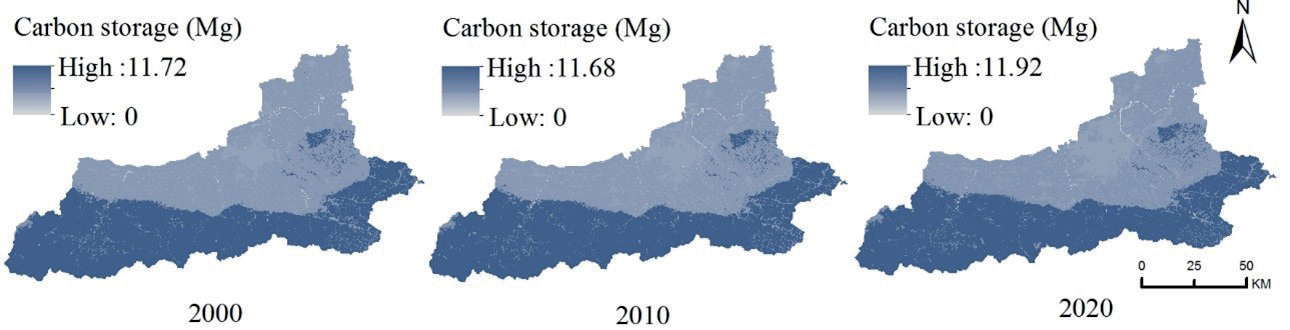
The distribution of carbon stocks in Xi’an exhibits a pronounced north-south spatial difference, displaying a characteristic of “higher in the south, lower in the north, and a central zone with intermediate values.” The average carbon stocks in the Qinling Mountain region are significantly higher, approximately three times that of the Li Mountain hilly region and seven times that of the Weihe River plain. There are substantial variations in carbon stocks and carbon density among different districts and counties (Fig. 7). In the southern part, carbon stocks and carbon density are higher in Zhouzhi County, Huyi District, Chang’an District, Lantian County, and the eastern Lintong District. The carbon stocks are 32.84 Tg, 20.30 Tg, 14.87 Tg, 12.77 Tg, and 6.15 Tg, respectively, accounting for 32.84%, 20.30%, 14.87%, 12.77%, and 6.47% of the total carbon stocks in the entire area. In the northern part, Baqiao District, Gaoling District, Weiyang District, and Yanliang District have relatively smaller carbon stocks and carbon density, with stocks of 2.03 Tg, 1.72 Tg, 1.51 Tg, and 1.49 Tg, respectively, accounting for 2.14%, 1.81%, 1.59%, and 1.56% of the total. In the central urban areas, Yanta District, Lianhu District, Xincheng District, and Beilin District have the smallest carbon stocks and carbon density, with stocks of 0.87 Tg, 0.21 Tg, 0.16 Tg, and 0.12 Tg, respectively, accounting for 0.92%, 0.22%, 0.17%, and 0.13% of the total.
Between 2000 and 2010, the reduction of 0.70 Tg carbon stocks in Xi’an primarily occurred in Zhouzhi County, Chang’an District, and Lintong District, contributing 22.10%, 17.17%, and 12.21%, respectively. Following were Huyi District, Baqiao District, Chang’an District, Lantian County, Gaoling District, Yanliang District, and Yanta District, with contribution rates ranging between 4.58% and 9.93%. Lianhu District, Xincheng District, and Beilin District had contribution rates below 0.20%. From 2010 to 2020, the overall increase of 1.34 Tg carbon stocks was mainly concentrated in Zhouzhi County, Lantian County, Chang’an District, and Huyi District, contributing 40.87%, 25.52%, 15.21%, and 11.52%, respectively. Following were Lintong District, Gaoling District, and Yanliang District, contributing 6.57%, 1.31%, and 1.53%. Contribution rates in Lianhu District, Xincheng District, and Beilin District were below 0.20%, while Baqiao District, Weiyang District, and Yanta District had negative contributions. In summary, the increase of 0.64 Tg carbon stocks in Xi’an from 2000 to 2020 was mainly attributed to Zhouzhi County and Lantian County, contributing 61.29% and 45.07%, respectively. Following were Chang’an District and Huyi District, contributing 13.07% and 13.24%. Lintong District, Lianhu District, Xincheng District, and Beilin District had contribution rates below 0.4%, while Baqiao District, Weiyang District, Yanta District, Yanliang District, and Gaoling District showed negative contributions.
Carbon Storage Variations Across Different Land Use Types
From 2000 to 2020, the carbon density of various land types in Xi’an city ranked from highest to lowest as follows: woodland, grassland, cropland, and built-up land. Due to the influence of land area, the total carbon storage ranked in the order of woodland, cropland, built-up land, and grassland. Woodland and cropland served as the primary carbon sinks in Xi’an, contributing approximately 93% to the total carbon storage in the city. Notably, woodland exhibited the highest carbon storage, approximately 2.3 times that of cropland (Fig. 8).
During the period 2000-2010, the carbon storage in cultivated land, forest land, and grassland decreased by 2.46 Tg, 0.07 Tg, and 0.07 Tg, respectively, while built-up land witnessed an increase of 11.90 Tg. In the subsequent decade (2010-2020), the carbon storage in cultivated land decreased by 0.81 Tg, representing a 67.11% reduction compared to the previous decade. Conversely, carbon storage in forest land and grassland reversed their trends, increasing by 0.90 Tg and 0.17 Tg, respectively. Built-up land continued its upward trajectory, adding 1.08 Tg to its carbon storage. These findings underscore the significant impact of built-up land and cultivated land on carbon storage in the period from 2000 to 2020. Despite the continuous decline in carbon storage in cultivated land, the reduced rate from 2010 to 2020 suggests that protective measures for cultivated land have proven effective. Furthermore, the reversal of carbon storage trends in forest land and grassland, with increased values of 0.83 Tg and 0.10 Tg, respectively, indicates an improved pace of ecosystem recovery in these areas. In conclusion, against the backdrop of a marginally increasing overall carbon storage, the noticeable improvement in the reduction of carbon storage from 2000-2010 to 2010-2020 underscores the need for continued efforts in cultivated land protection, minimizing carbon loss, and sustaining achievements in the ecological restoration of forest and grassland areas to enhance the city’s overall carbon sink capacity.
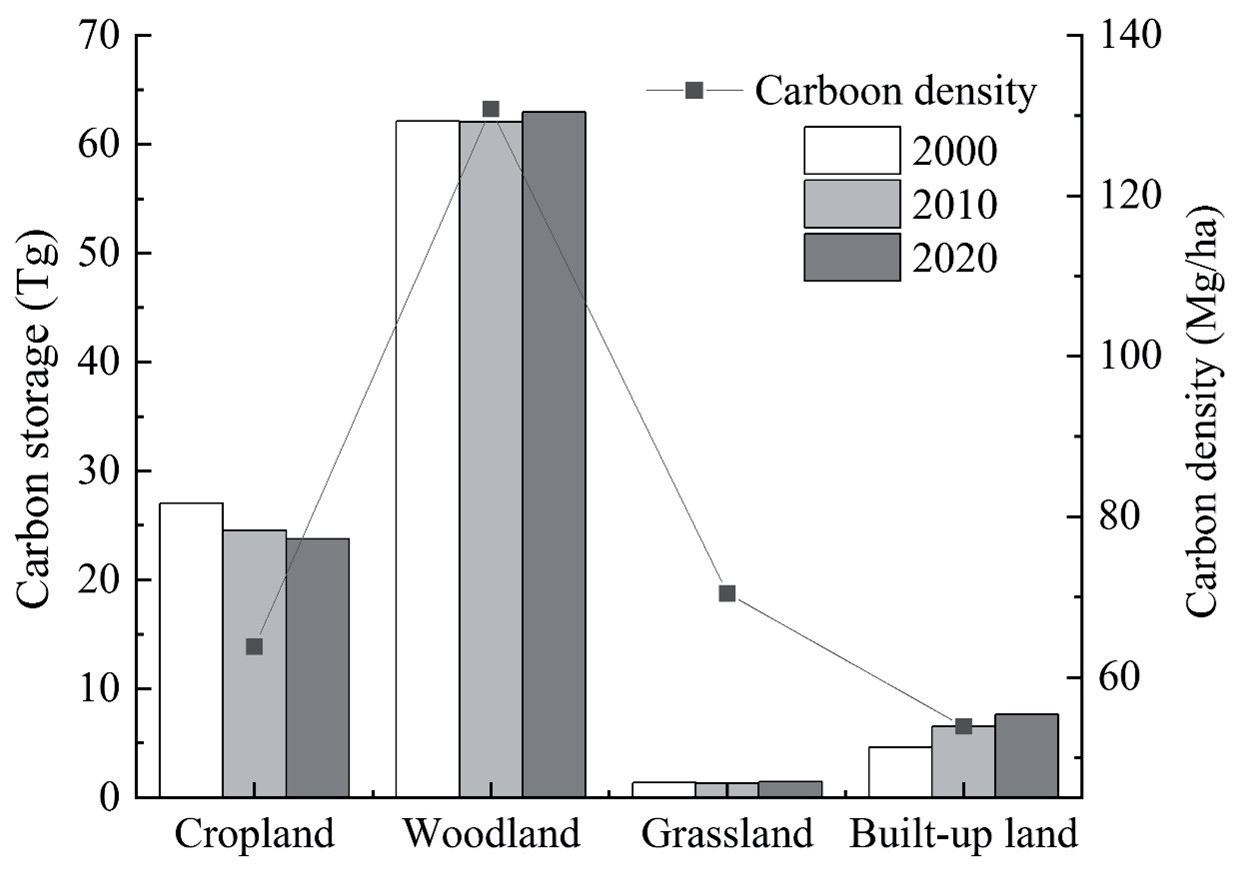
Table 4.
Proportion of carbon function zones in Xi’an City from 2000 to 2020.
“Carbon Sink-Carbon Source” Functional Zone Spatial Distribution and Evolution
From 2000 to 2020, the area proportions of carbon sink-source function zones in Xi’an City were ranked as follows: carbon balance zone, low carbon optimization zone, carbon sink enhancement zone, carbon emission control zone (Table 4). The evolution of carbon functional zones aligns closely with the characteristics of land use change, primarily demonstrating a trend of “expansion in concentric circles outward from the city center” (Fig. 9).
From 2000 to 2010, the carbon balance zone accounted for 92.08% of the total, exhibiting a uniform distribution across the entire region. This zone experienced minimal land cover conversions, generally maintaining its original land cover types. The carbon density showed little change, and the carbon sink function remained essentially constant. The carbon sink enhancement zone occupied 2.14% of the total area, displaying a scattered distribution throughout the region. The primary land cover conversions in this zone included the transformation of plain construction land into arable land, accounting for 49.65%, and the conversion of mountainous arable land into forest land, accounting for 21.16%. The low carbon optimization zone accounted for 4.89% and was mainly located in the Weihe River Plain. In this zone, the predominant land cover conversion involved construction land encroaching on arable land, constituting 94.00% of the conversions. The carbon emission control zone represented 0.88% of the total area and exhibited a distribution across the entire region, with a more pronounced presence along the edges of mountainous areas and around water bodies. The major land cover conversions in this zone included the transformation of forest land into arable land, accounting for 40.72%, and the conversion of arable land into water bodies, accounting for 30.00%.
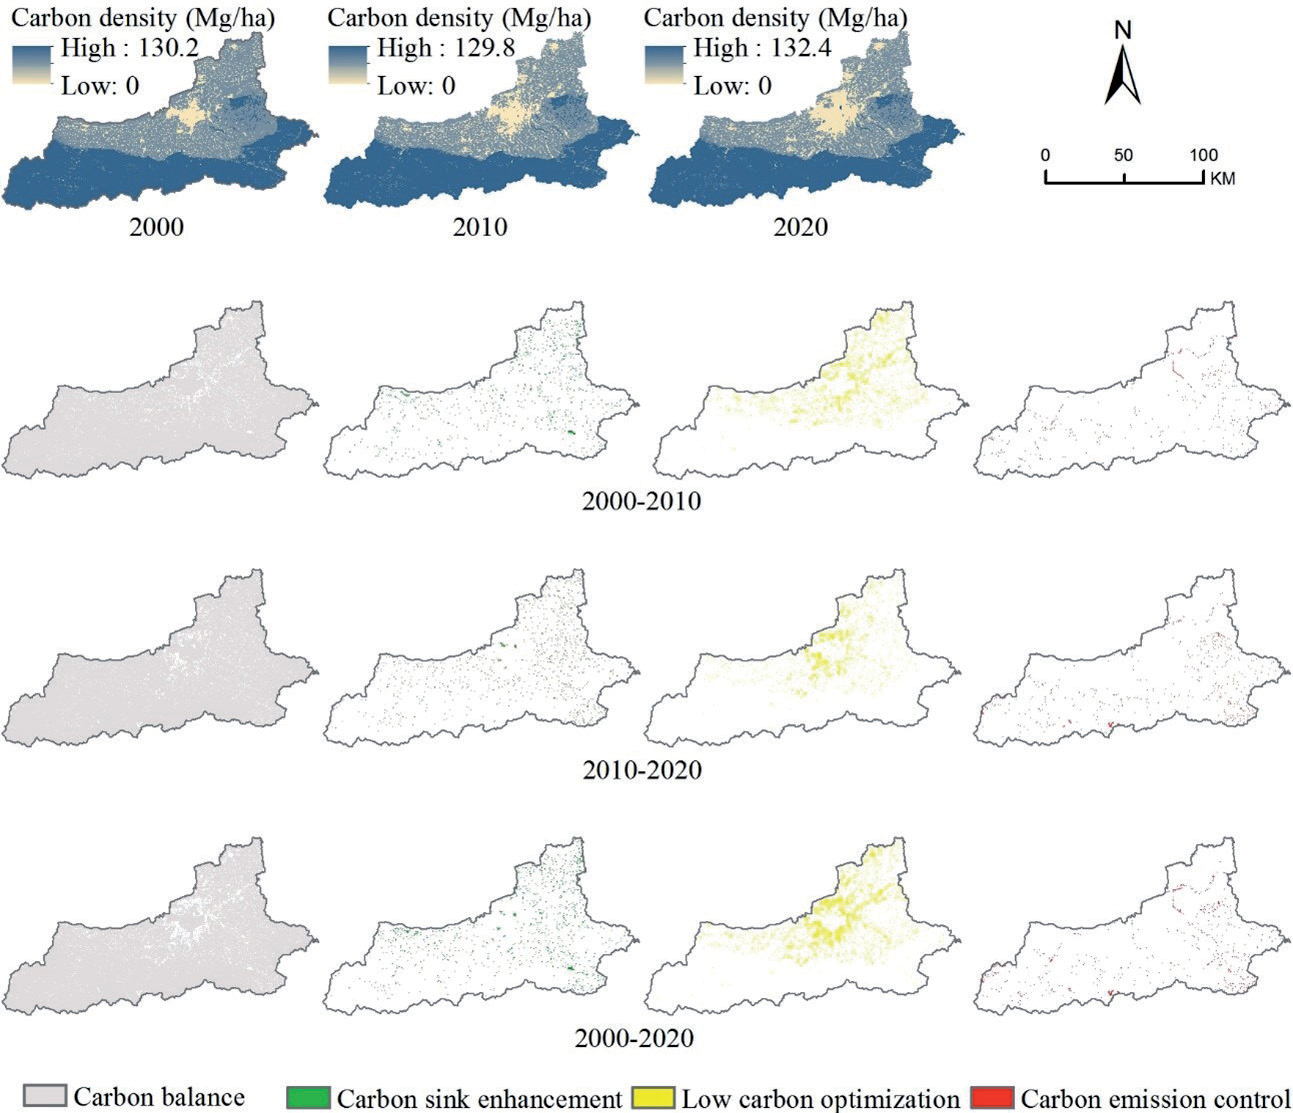
From 2010 to 2020, the carbon balance zone accounted for 93.66% of the total, representing an increase of 1.58% compared to the 2000-2010 period. The carbon sink enhancement zone comprised 2.13% of the total, slightly decreasing by 0.01% from the previous period. The spatial distribution remained largely consistent, with the main land cover transition in the plain areas still being the conversion of construction land to arable land, accounting for 47.20%. In mountainous areas, there was a shift from arable land to forest land being the primary conversion to grassland to forest land, constituting 22.19%. The low carbon optimization zone accounted for 2.95%, showing a decrease of 1.94% from the previous period. The spatial distribution became more concentrated, particularly in the main urban area of Xi’an. Most of the low carbon optimization zones in the surrounding areas shifted to carbon balance zones. The dominant land cover transition remained arable land to construction land, but the expansion trend of construction land slowed down, and the conversion rate of arable land increased. The carbon emission control zone accounted for 1.26%, increasing by 0.37% from the previous period. The spatial distribution remained relatively stable. The primary land cover transition shifted from forest land to arable land to forest land to grassland, constituting 50%.
From 2000 to 2020, the carbon balance zone accounted for 89.45% of the total, with no changes in land cover types within this zone. The carbon sink enhancement zone accounted for 2.46%, primarily involving the conversion of construction land to arable land. The low carbon optimization zone accounted for 6.71%, mainly characterized by the conversion of arable land to construction land. The carbon emission control zone accounted for 1.37%, primarily involving transitions from forest land to grassland and arable land.
In summary, there are variations in the carbon source-sink functional zones over different periods, and they are interconnected and interconverted. Although the overall carbon storage in Xi’an’s ecosystem has shown a slight increase, with an increase in both the area and proportion of the carbon balance zone, and a decrease in the low carbon optimization zone, the area of the carbon sink enhancement zone has decreased. The carbon emission control zone has shown a significant increase in both area and proportion, especially in ecosystems near water systems and mountainous edges, which are more vulnerable, sensitive to external disturbances, experience rapid land cover changes, exhibit fast carbon density changes, and have less stable carbon sink functions. These regions should be given sufficient attention to prevent the transformation of existing carbon sink areas into carbon source areas, leading to carbon losses.
Response of Carbon Storage to Climate-Land Use Changes
The change in ecosystem carbon storage is the result of the combined effects of climate and land use changes. The InVEST model was applied to simulate and quantitatively analyze the impact of climate and land use changes on carbon storage in Xi’an from 2000 to 2020.
From 2000 to 2020, the overall climate conditions in Xi’an exhibited a phenomenon of “warming and increased humidity” (Fig. 10), with warming being more pronounced. The average annual temperature during this period was 14.29ºC, with a maximum of 15.37ºC and a minimum of 13.45ºC. The temperature showed a clear upward trend, with the highest increase observed in the mean temperature and average maximum temperature during the years 2010-2020. The average annual precipitation from 2000 to 2020 was 624.30mm, with a maximum of 973.66mm and a minimum of 420.88mm. Overall, precipitation showed a slight upward trend, with noticeable inter-annual fluctuations, such as the flood-prone year (2003) and drought-prone years (2001, 2006).
According to Table 5, it can be observed that from 2000 to 2010, the impact of climate and land-use changes on carbon storage exhibited a consistent direction of negative feedback inhibition, with land-use changes exerting a slightly greater influence than climate changes. The contribution percentages were 51.27% and 48.73%, respectively. However, from 2010 to 2020, the directions of the effects of climate and land-use changes on carbon storage diverged. Land-use changes played a positive feedback promotion role, while climate changes played a negative feedback inhibition role. The impact of land-use changes was much greater than that of climate changes, with contribution percentages of 128.21% and -28.21%, respectively.
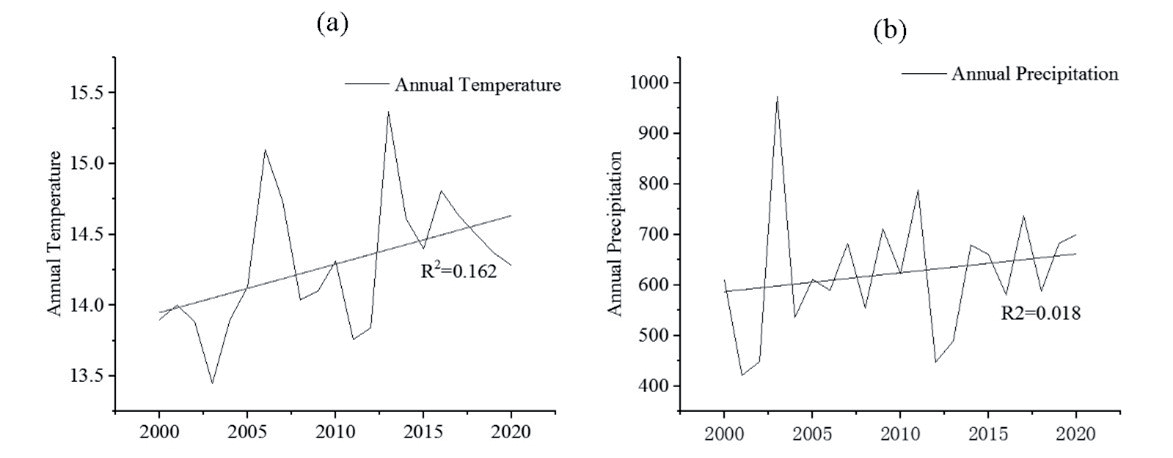
It is evident that from 2000 to 2020, the climatic conditions in Xi’an exerted an inhibitory effect on carbon storage, despite an overall trend of “warming and increased humidity.” Although increased precipitation has a promoting effect on carbon storage, the slight increase in precipitation is far less significant than the rapid rise in temperature. The continuous temperature increase acts as a persistent inhibitory factor on carbon storage. Land-use changes had a greater impact than climate changes on carbon storage, and from 2010 to 2020, this impact shifted to a promoting effect. This shift indicates that during this period, the increased conversion rates of high carbon-density land types, such as forests, grasslands, and croplands, coupled with a reduced conversion rate of land to built-up areas, positively contributed to carbon storage, enhancing carbon storage capacity.
Discussion
Impact of Land Management Models on Carbon Sequestration in Xi’an
Following the introduction of the Western Development Strategy in 2000, Xi’an, as a core mega-city in western China, accelerated its pace of economic development and construction. This rapid expansion of construction land, encroachment on agricultural land, and degradation of forest land led to a decline in carbon storage from 2000 to 2010. However, this trend was significantly alleviated during the 2010- 2020 period. This shift was attributed to the scientific implementation of land-use models, coupled with the practical application of land remediation and ecological restoration measures (Fig. 11). These efforts essentially reversed the decline in carbon storage, resulting in an increase in the carbon balance area and the aggregation of the low carbon optimization area. The impact of land use on carbon storage growth increased from -0.36 to 1.73, and its contribution rose from 51.27% to 128.21% (Table 5). This reversal underscores the effectiveness of the adopted land management models, integrated with practices of land reclamation and ecological restoration, in mitigating the decline in carbon storage and enhancing carbon sequestration capacity in Xi’an.
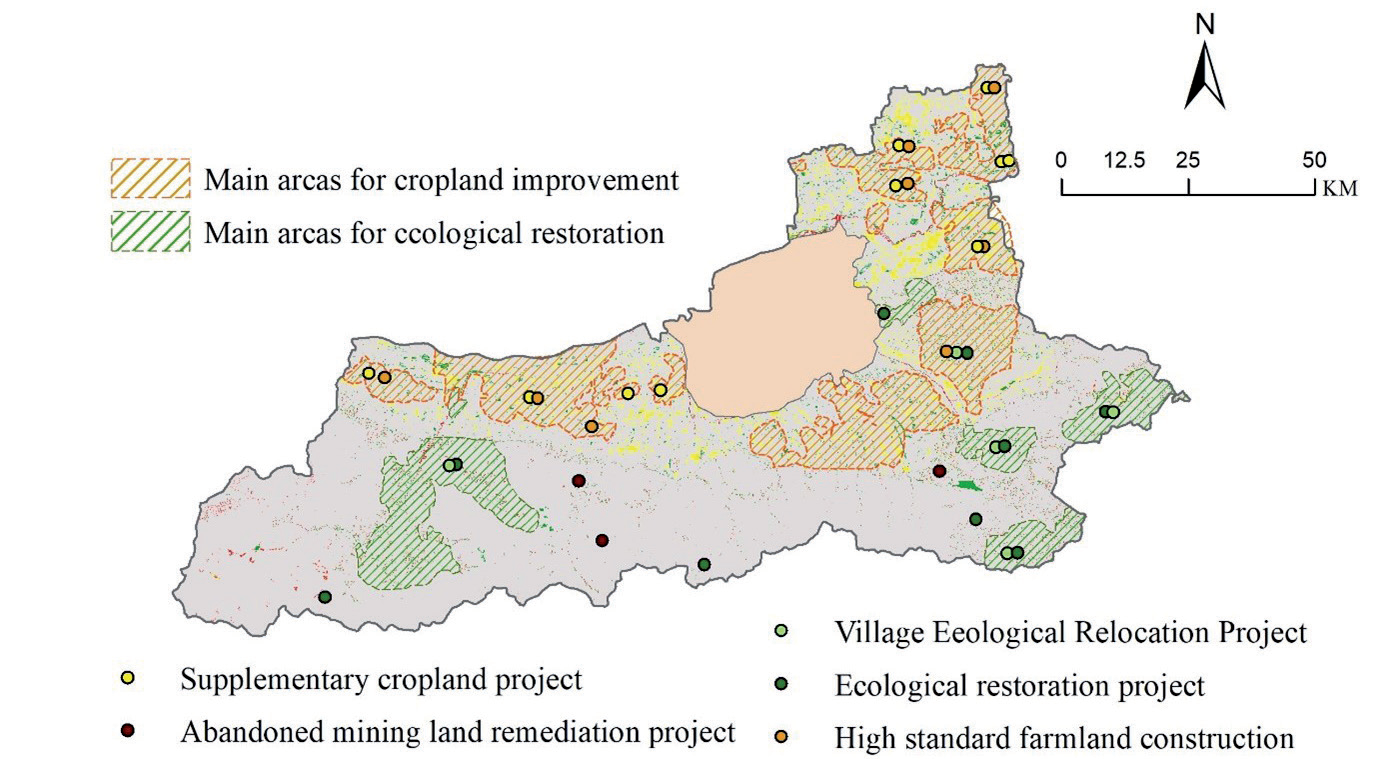
Table 5.
The impact of climate and land use changes on carbon storage in Xi’an City.
| Period | Carbon Storage (×106 Mg) | CL/CT | CC/CT | |||||
|---|---|---|---|---|---|---|---|---|
| CO | CSL | CSC | CT | CL | CC | (%) | (%) | |
| 2000-2010 | 95.12 | 94.76 | 94.78 | -0.70 | -0.36 | -0.34 | 51.27 | 48.73 |
| 2010-2020 | 94.42 | 96.15 | 94.04 | 1.35 | 1.73 | -0.38 | 128.21 | -28.21 |
(1) Urban-Suburban Integration and Revitalization Model Favors Regional Carbon Sink
The “Xi’an City Overall Land Use Plan (2006-2020)” strictly controls the scale of construction land and enhances farmland protection. It implements a balance between the conversion of newly added construction land and cultivated land, delineates a retained farmland area of 2,871.07 square kilometers, and establishes a basic farmland protection area of 2,660 square kilometers. All permanent basic farmland is developed into high-standard farmland, with a total reclamation and supplementation of cultivated land reaching 364 square kilometers. Construction land, through the linkage of rural construction land and urban-rural construction land changes, prioritizes the conversion of inefficient land, releasing rural residential land and prioritizing its reclamation as cultivated land, totaling 174.08 hectares. To promote the interaction of resources between urban and suburban areas, surplus construction land quotas are used to accommodate the overflow of urban functions. Since Shaanxi Province was selected for the inefficient land development pilot project by the Ministry of Land and Resources in 2013, Xi’an has transformed land in urban villages (258 sites), shantytown areas (83 sites), abandoned industrial land, and idle land, totaling 390 square kilometers over three years. By implementing intensive exploration of existing construction land, rigorous protection of cultivated land, and balancing the conversion of cultivated land, not only has the expansion trend of construction land been controlled, but also the decline in the quantity and quality of cultivated land has been alleviated. This protection has preserved the cultivated land carbon sink, leading to the aggregation and compression of the low carbon optimization area toward the city center. The outward diffusion trend has been mitigated, and a considerable number of areas in the low carbon optimization zone have transitioned to the carbon balance area, making a significant contribution to the overall enhancement of carbon sink functions.
(2) Ecological Protection and Utilization Enhancement Model Favors Regional Carbon Sink
Through the implementation of initiatives such as promoting reforestation for retired farmland, ecological relocation of villages, and soil erosion control, as well as the ecological restoration of abandoned mines, ecological functions have been enhanced to ensure ecological security. Since 2009, the Qinling Ecological Reforestation Key Project has restored vegetation through afforestation on 4,230 mu of land, planting 719,000 trees including Chinese junipers and Chinese oil pines, raising the forest coverage rate to 72.95%. The key projects for village ecological relocation and the restoration of abandoned mining land have collectively vacated an area of 637.17 hectares of rural construction land. Since 2018, the Xi’an municipal government has comprehensively addressed the illegal construction of villas in the Qinling Mountains, demolishing 33 illegal construction projects. The comprehensive governance project for the Weihe River and Jinghe River has treated approximately 3,978 hectares of beach land, dredging and clearing approximately 1.94 million square meters, and rectifying the river channels over approximately 175 kilometers. These series of ecological management measures have achieved remarkable results, effectively enhancing regional water conservation and biodiversity, and making a significant contribution to the overall improvement of Xi’an’s carbon sink function.
Issues and Suggestions
While the carbon sink in Xi’an is generally showing positive development, the carbon sink enhancement zone is gradually decreasing. There are still 2.95% of low carbon optimization zones and 1.26% of carbon emission control zones. The fundamental reasons for this decline are the encroachment of construction land on cultivated land and the degradation of forest land.
The low carbon optimization zones are mainly located in the city center and extend outward. The development was faster in the early stages, and the speed slightly slowed down in the later period. Although the encroachment of construction land on cultivated land is inevitable, the key focus for the future should be on how to build an intensive and connotative city, significantly improve land use efficiency, and incorporate low-carbon concepts such as “compact city” and “activation of land resources” into various aspects of urban development, agricultural guarantee, and ecological living. This includes transitioning from an expansive model to an intensive one while adhering to bottom-line constraints and maintaining the red-line for cultivated land. Spatially, Xi’an should promote the development of a compact, multi-nucleus expansion model, with the main urban area as the intensive core and the development of peripheral cluster areas, moving towards high density, high connectivity, and high land mixed-use.
The carbon emission control areas are mainly located in the transitional zone from the Weihe River Plain to the Qinling Mountains, as well as in ecologically sensitive and vulnerable areas near valleys and water systems. These areas have more complex ecosystems and human-environment relationships, with more pronounced changes in carbon sink functions. In the future, efforts should be intensified to restore and protect the ecology of these regions. The existing carbon sink space in the Qinling Mountains should be consolidated, and afforestation and grassland restoration efforts should be sustained. This involves the prioritized development of ecological solid wood species such as deciduous tree forests, undertaking multi-functional carbon sink forest cultivation, and nurturing and managing young forests. It is essential to protect existing high-carbon sink species like deciduous tree forests and special irrigation forests. Furthermore, the promotion of public welfare forestry carbon sink projects with ecological benefits as the primary focus, balancing biodiversity conservation and local farmer income, should be extended. Identified areas of ecological degradation require enhanced overall ecological restoration to increase carbon sinks. It is crucial to stabilize the ecological security pattern, protect essential natural ecological resources such as forests and water systems, and maintain the baseline of the ecosystem’s carbon sink.
Conclusions
Climate and land use change are the primary factors influencing the variation in carbon storage functions within terrestrial ecosystems. This study, based on the corrected mean carbon density of various land use types nationwide, employs the InVEST model to assess the changes in ecosystem carbon storage in Xi’an from 2000 to 2020. The impacts of climate and land use change on carbon storage variation are quantified. The results reveal a changing trend in carbon storage in Xi’an from 2000 to 2020, characterized by an initial decrease followed by an overall increase. During 2000-2010, the total carbon storage decreased from 95.12Tg to 94.42Tg, with a relatively high proportion in low carbon optimization and carbon emission control zones (5.77%). However, there was still a 2.14% increase in carbon sink enhancement zones during this period. Land use changes, particularly the continuous expansion of construction land, contributed slightly more to the decrease in carbon storage than climate change. From 2010 to 2020, the total carbon storage increased from 94.42Tg to 95.76 Tg, with the main influencing factor being land use change (contributing 128.21%). The proportion of low-carbon optimization and carbon emission control zones remained relatively high at 4.21%, mainly due to plain farmland loss and mountainous forest degradation.
The shift in Xi’an’s land management mode, the transition to a suburban integration activation coordination model, and the implementation of ecological protection policies in the Qinling Mountain area have reversed the declining trend in ecosystem carbon storage functions from 2000 to 2010. The overall ecosystem has improved, transforming from a carbon source to a carbon sink. However, the proportion of carbon emission control zones has increased from 0.88% to 1.26%, primarily in the transitional zone between the Weihe River plain and the Qinling Mountains, and the edge areas of valley water systems. These regions are ecologically fragile and highly sensitive, yet their ecological significance is crucial. The protection of these areas should be given high priority, with continuous optimization and adjustment of related conservation policies to enhance the ecosystem services of the Weihe River Valley and Qinling Mountain regions, contributing to the achievement of national “dual carbon goals.”

